水文分析提取河網
The topic of this article is the application of information technologies in environmental science, namely, in hydrology. Below is a description of the algorithm for ranking rivers and the plugin we implemented for the open-source geographic information system QGIS.
本文的主題是信息技術在環境科學(即水文學)中的應用。 以下是對河流進行排名的算法的說明,以及我們為開源地理信息系統QGIS實現的插件。
An important aspect of hydrological surveys is not only the collection of information received from research expeditions and automatic devices but also the analysis of all the obtained data, including the use of GIS (geoinformation systems). However, exploration of the spatial structure of hydrological systems can be difficult due to a large amount of data. In such cases, we cannot do research without using additional tools that allow us to automate the process.
水文調查的一個重要方面不僅是收集從研究考察和自動裝置獲得的信息,而且還包括對所有獲得的數據進行分析,包括使用GIS(地理信息系統)。 然而,由于大量的數據,探索水文系統的空間結構可能很困難。 在這種情況下,如果不使用允許我們使過程自動化的其他工具,我們將無法進行研究。
Visualization plays an important role when working with spatial data. Correct visual representation of the results of the analysis helps to better understand the structure of spatial objects and to know something new. For the image of rivers in classical cartography, the following method is used: rivers are represented as a solid line with a gradual thickening (depending on the number of tributaries that flow into the river) from the source to the mouth of the river. Moreover, segments of the river network often need to be ranked by the degree of distance from the source. This type of information is important not only for visualization, but also for a more complete perception of the data structure, its spatial distribution, and subsequent processing.
在處理空間數據時,可視化起著重要作用。 分析結果的正確視覺表示有助于更好地了解空間對象的結構并了解新知識。 對于經典制圖中的河流圖像,使用以下方法:河流表示為一條實線,從源頭到河口逐漸增粗(取決于流入河流的支流的數量)。 此外,河網的各部分通常需要按距水源的距離程度進行排序。 這類信息不僅對于可視化很重要,而且對于更完整地了解數據結構,其空間分布和后續處理也很重要。
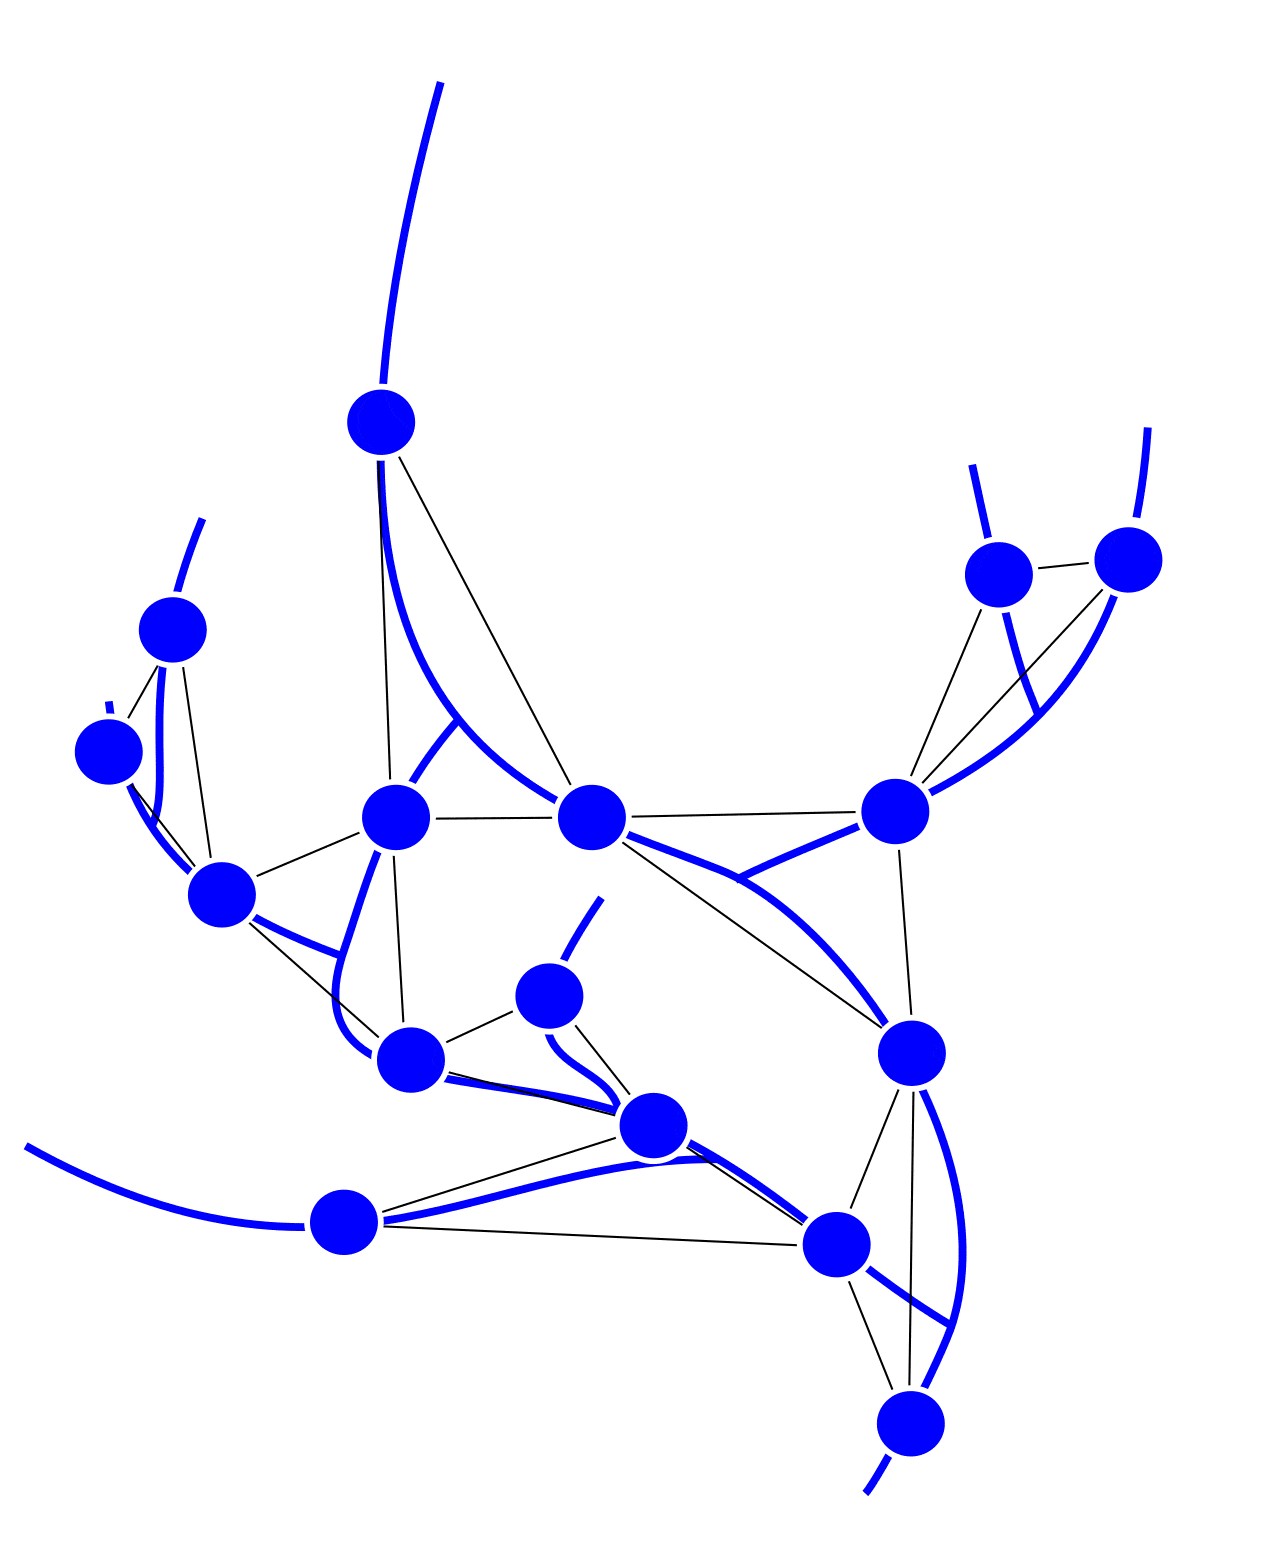
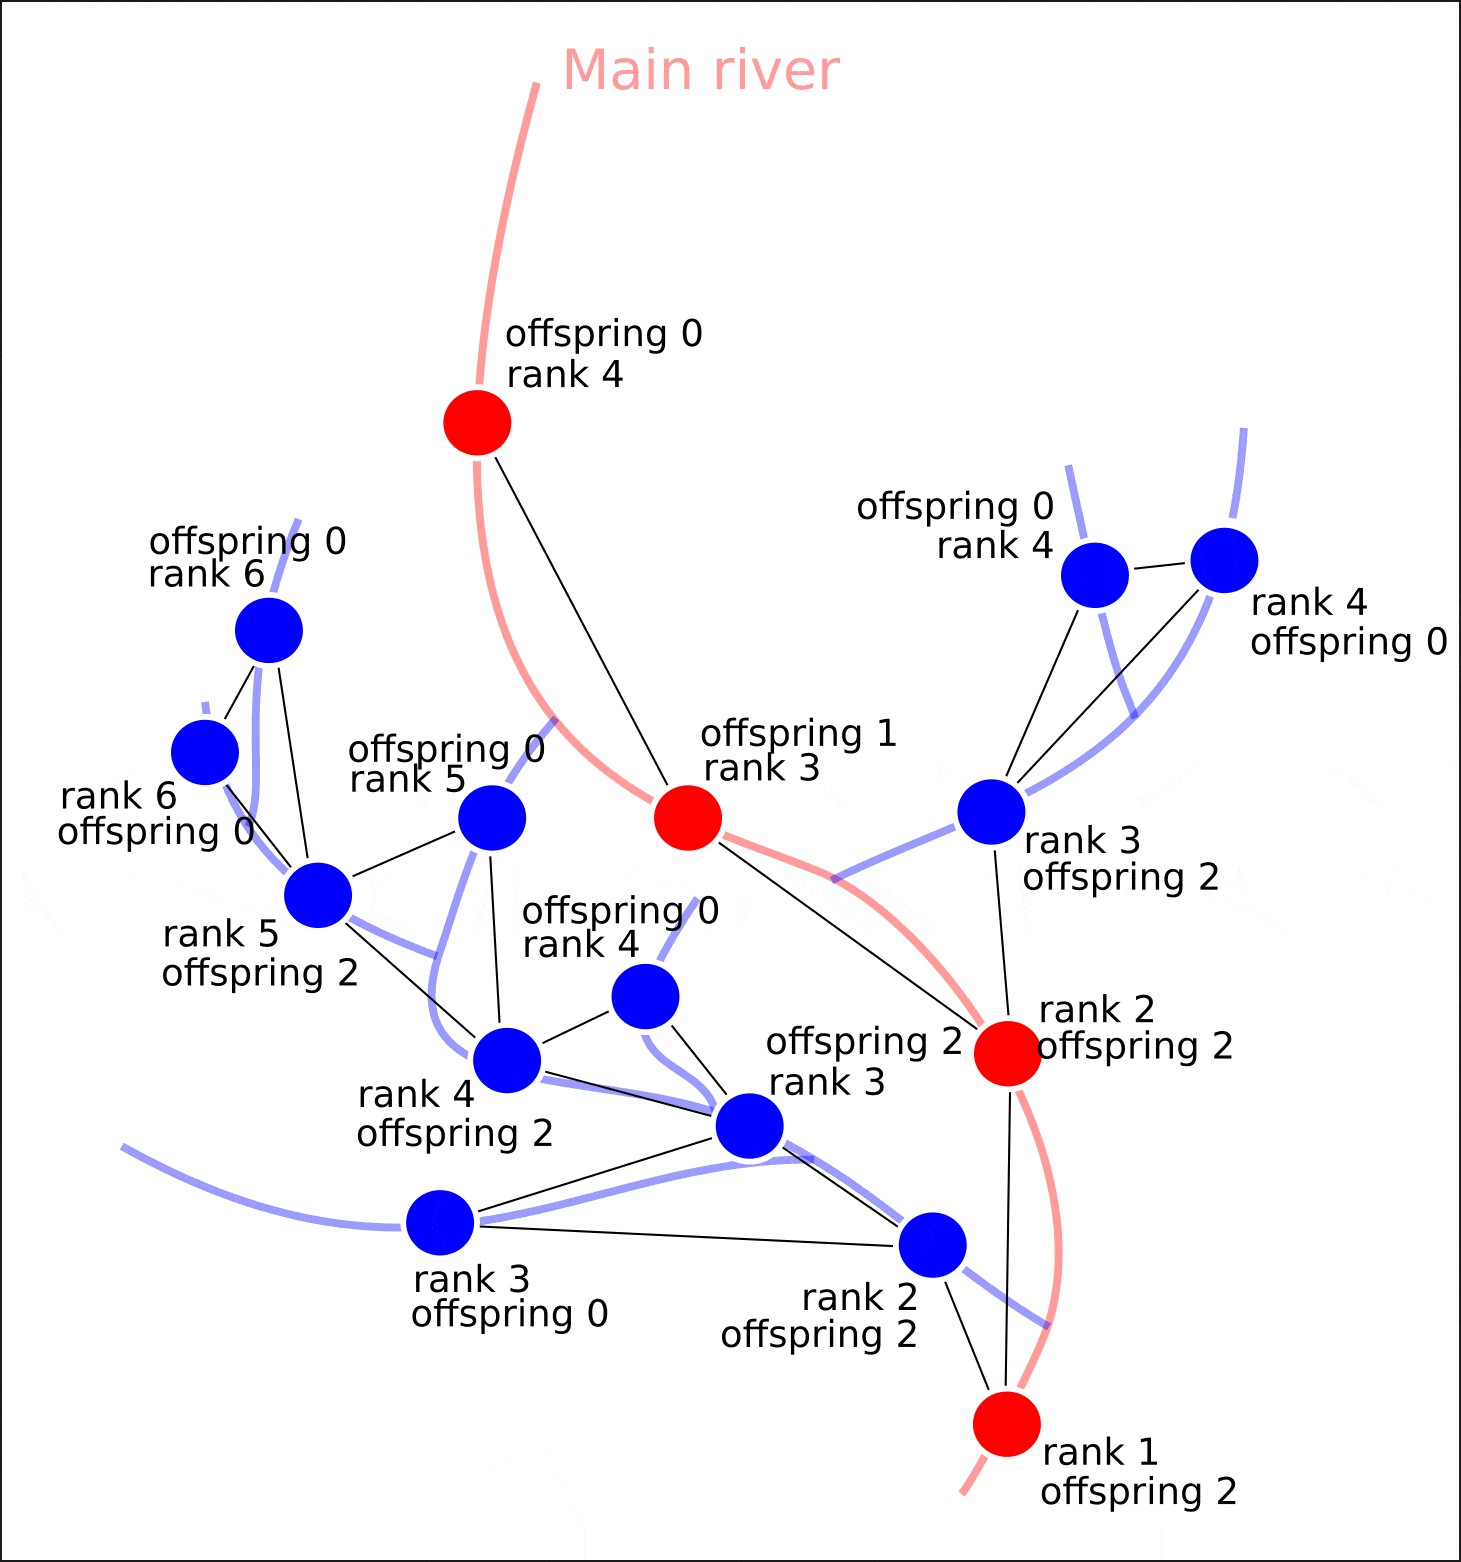
The problem of ranking rivers can be illustrated as follows (Fig. 1):
河流排名問題可以說明如下(圖1):
Thus, each segment of the river needs to be mapped to a value that shows how many segments flow into this section.
因此,河流的每個部分都需要映射到一個值,該值顯示有多少部分流入該部分。
Modern GIS, such as ArcGIS or its open-source competitor QGIS, have tools for working with river networks. However, the river ranking tool requires a large number of additional auxiliary materials and, as it seems to us, unnecessary transformations. For example, for an existing GIS tool to start working with river networks you need to prepare a digital elevation model. A significant disadvantage, in addition to complex and multi-stage data preparation, is the inability to use already prepared vector layers with a river network for analysis, which limits the possibility of using digital bases from open sources (OpenStreetMap or Natural Earth).
諸如ArcGIS或其開源競爭對手QGIS之類的現代GIS具有用于河網的工具。 但是,河流排名工具需要大量其他輔助材料,并且在我們看來,這是不必要的改造。 例如,要使一個現有的GIS工具開始與河網一起工作,您需要準備一個數字高程模型。 除復雜且多階段的數據準備外,一個重要的缺點是無法將已經準備好的矢量層與河流網絡一起使用來進行分析,這限制了使用來自開源(OpenStreetMap或Natural Earth)的數字基礎的可能性。
Of course, you can assign attribute values to segments without using algorithms, but this approach is no longer relevant if you need to rank the network with several thousand segments.
當然,可以在不使用算法的情況下將屬性值分配給段,但是如果需要對具有數千個段的網絡進行排名,則此方法不再適用。
We decided to automate this procedure by representing the river network as a graph and then applying graph traversal algorithms. To simplify the user’s work with the implemented algorithm, a plugin for the QGIS geoinformation system — “Lines Ranking” was written. The code is distributed freely and is available in the QGIS repository, as well as on GitHub.
我們決定通過將河流網絡表示為圖形然后應用圖形遍歷算法來自動化此過程。 為了簡化用戶使用已實現算法的工作,編寫了QGIS地理信息系統的插件“行排名”。 該代碼是免費分發的,可以在QGIS存儲庫以及GitHub中獲得 。
Installation
安裝
The plugin requires QGIS version >= 3.14, as well as the following dependencies: python libraries — networkx, pandas.
該插件要求QGIS版本> = 3.14,以及以下依賴項:python庫-networkx,pandas。
For Linux:
對于Linux:
$ locate pip3
$找到pip3
$ cd <your system pip3 path from previous step>
$ cd <上一步中的系統pip3路徑>
$ pip3 install pandas
$ pip3安裝熊貓
$ pip3 install networkx
$ pip3安裝networkx
For Windows:
對于Windows:
In command line OSGeo4W:
在命令行OSGeo4W中:
$ pip install pandas
$ pip安裝熊貓
$ pip install networkx
$ pip安裝networkx
Using
使用
Input data is a vector layer consisting of objects with a linear geometry type (Line, MultiLine). Custom attributes are stored in the input layer to the output layer.
輸入數據是一個矢量層,由具有線性幾何類型(線,多線)的對象組成。 定制屬性存儲在輸入層到輸出層中。
We do not recommend using a field named “fid” for the input layer. At the stage of connecting gaps in the river network, using the built — in module of the GRASS package- v.clean where this field name is the “system” one.
我們不建議在輸入層使用名為“ fid”的字段。 在連接河網中的差距的階段,使用GRASS軟件包v.clean的內置模塊,此字段名稱為“系統”。
Also, an obligatory input parameter is a point (Start Point Coordinates) that determines the position of the mouth of the river network. It can be set from the map, from a file, or from a layer uploaded to QGIS. The position of the river mouth can be approximate. The calculation is based on the segment of the river network closest to the point (the closing vertex of the future graph).
同樣,強制性輸入參數是確定河網口位置的點(起點坐標)。 可以從地圖,文件或上傳到QGIS的圖層中進行設置。 河口的位置可以近似。 該計算基于最接近該點(未來圖形的閉合頂點)的河網段。
Optional input data:
可選輸入數據:
- the threshold for “tightening” gaps in the river network (Spline Threshold). This operation involves the use of a package of GRASS for QGIS. If the specified package is missing, you should fix the gaps in another way and leave this field empty; 縮小河網差距的閾值(樣條閾值)。 此操作涉及將GRASS軟件包用于QGIS。 如果缺少指定的程序包,則應以其他方式解決差距,并將此字段留空;
- custom field names for the output layer. Allows the user to assign a field name to record the rank of each segment (Rank fieldname), the number of tributaries (Flow field name), and the distance from the mouth in meters (Distance field name). If parameters are not set , the default names of the fields are Rank, Value, and Distance; 輸出層的自定義字段名稱。 允許用戶分配一個字段名稱,以記錄每個段的等級(等級字段名稱),支流數量(流字段名稱)以及到嘴的距離(以米為單位)(距離字段名稱)。 如果未設置參數,則字段的默認名稱為Rank,Value和Distance;默認值為0。
- location of the output file. If this parameter is omitted, a temporary layer will be created and added to the QGIS layer stack; 輸出文件的位置。 如果省略此參數,將創建一個臨時層并將其添加到QGIS層堆棧中。
We can define the task performed by the algorithm as follows: compare the total number of tributaries flowing into each segment of the river, calculate the number of tributaries for each segment, as well as the distance of the farthest point of the segment from the mouth.
我們可以定義算法執行的任務,如下所示:比較流入河流各段的支流總數,計算各段支流的數量,以及該段最遠點到河口的距離。
算法說明 (Algorithm description)
In GIS, data can be presented in two main formats: raster and vector. A raster is a matrix where a certain parameter value is stored in each pixel. Satellite images, reanalysis grids, various output layers from climate models, and others are often represented in raster format in environmental science. Vector data is represented as simple geometric objects, such as points, lines, and polygons. Each object in a vector format can be associated with some information in the form of attributes. All the actions described below will be performed on the vector layer of the river network.
在GIS中,數據可以兩種主要格式表示:柵格和矢量。 柵格是一個矩陣,其中某個參數值存儲在每個像素中。 衛星圖像,重新分析網格,氣候模型的各種輸出層等在環境科學中通常以柵格格式表示。 矢量數據表示為簡單的幾何對象,例如點,線和多邊形。 向量格式的每個對象都可以與屬性形式的某些信息相關聯。 下面描述的所有動作將在河網的矢量層上執行。
As a result, the algorithm returns a vector layer in which each object is assigned attributes that determine the distance of segments from the river mouth and the total number of tributaries that flow into this segment.
結果,該算法返回一個向量層,在該向量層中為每個對象分配了屬性,這些屬性確定了各段距河口的距離以及流入該段的支流的總數。
Preprocessing input data
預處理輸入數據
Note that the topology of the original vector layer may be corrupted. The reason for this may be export / import between different GIS, incorrect file creation, etc. Corrupted layer topology can be expressed in the absence of connections between objects, i.e. the formation of various breaks (Fig. 2), creating additional closures, intersections, etc.
請注意,原始矢量層的拓撲可能已損壞。 造成這種情況的原因可能是在不同的GIS之間進行導出/導入,文件創建不正確等。在對象之間沒有連接的情況下,也可以表示損壞的層拓撲,即形成各種中斷(圖2),從而創建其他閉合,交叉點等
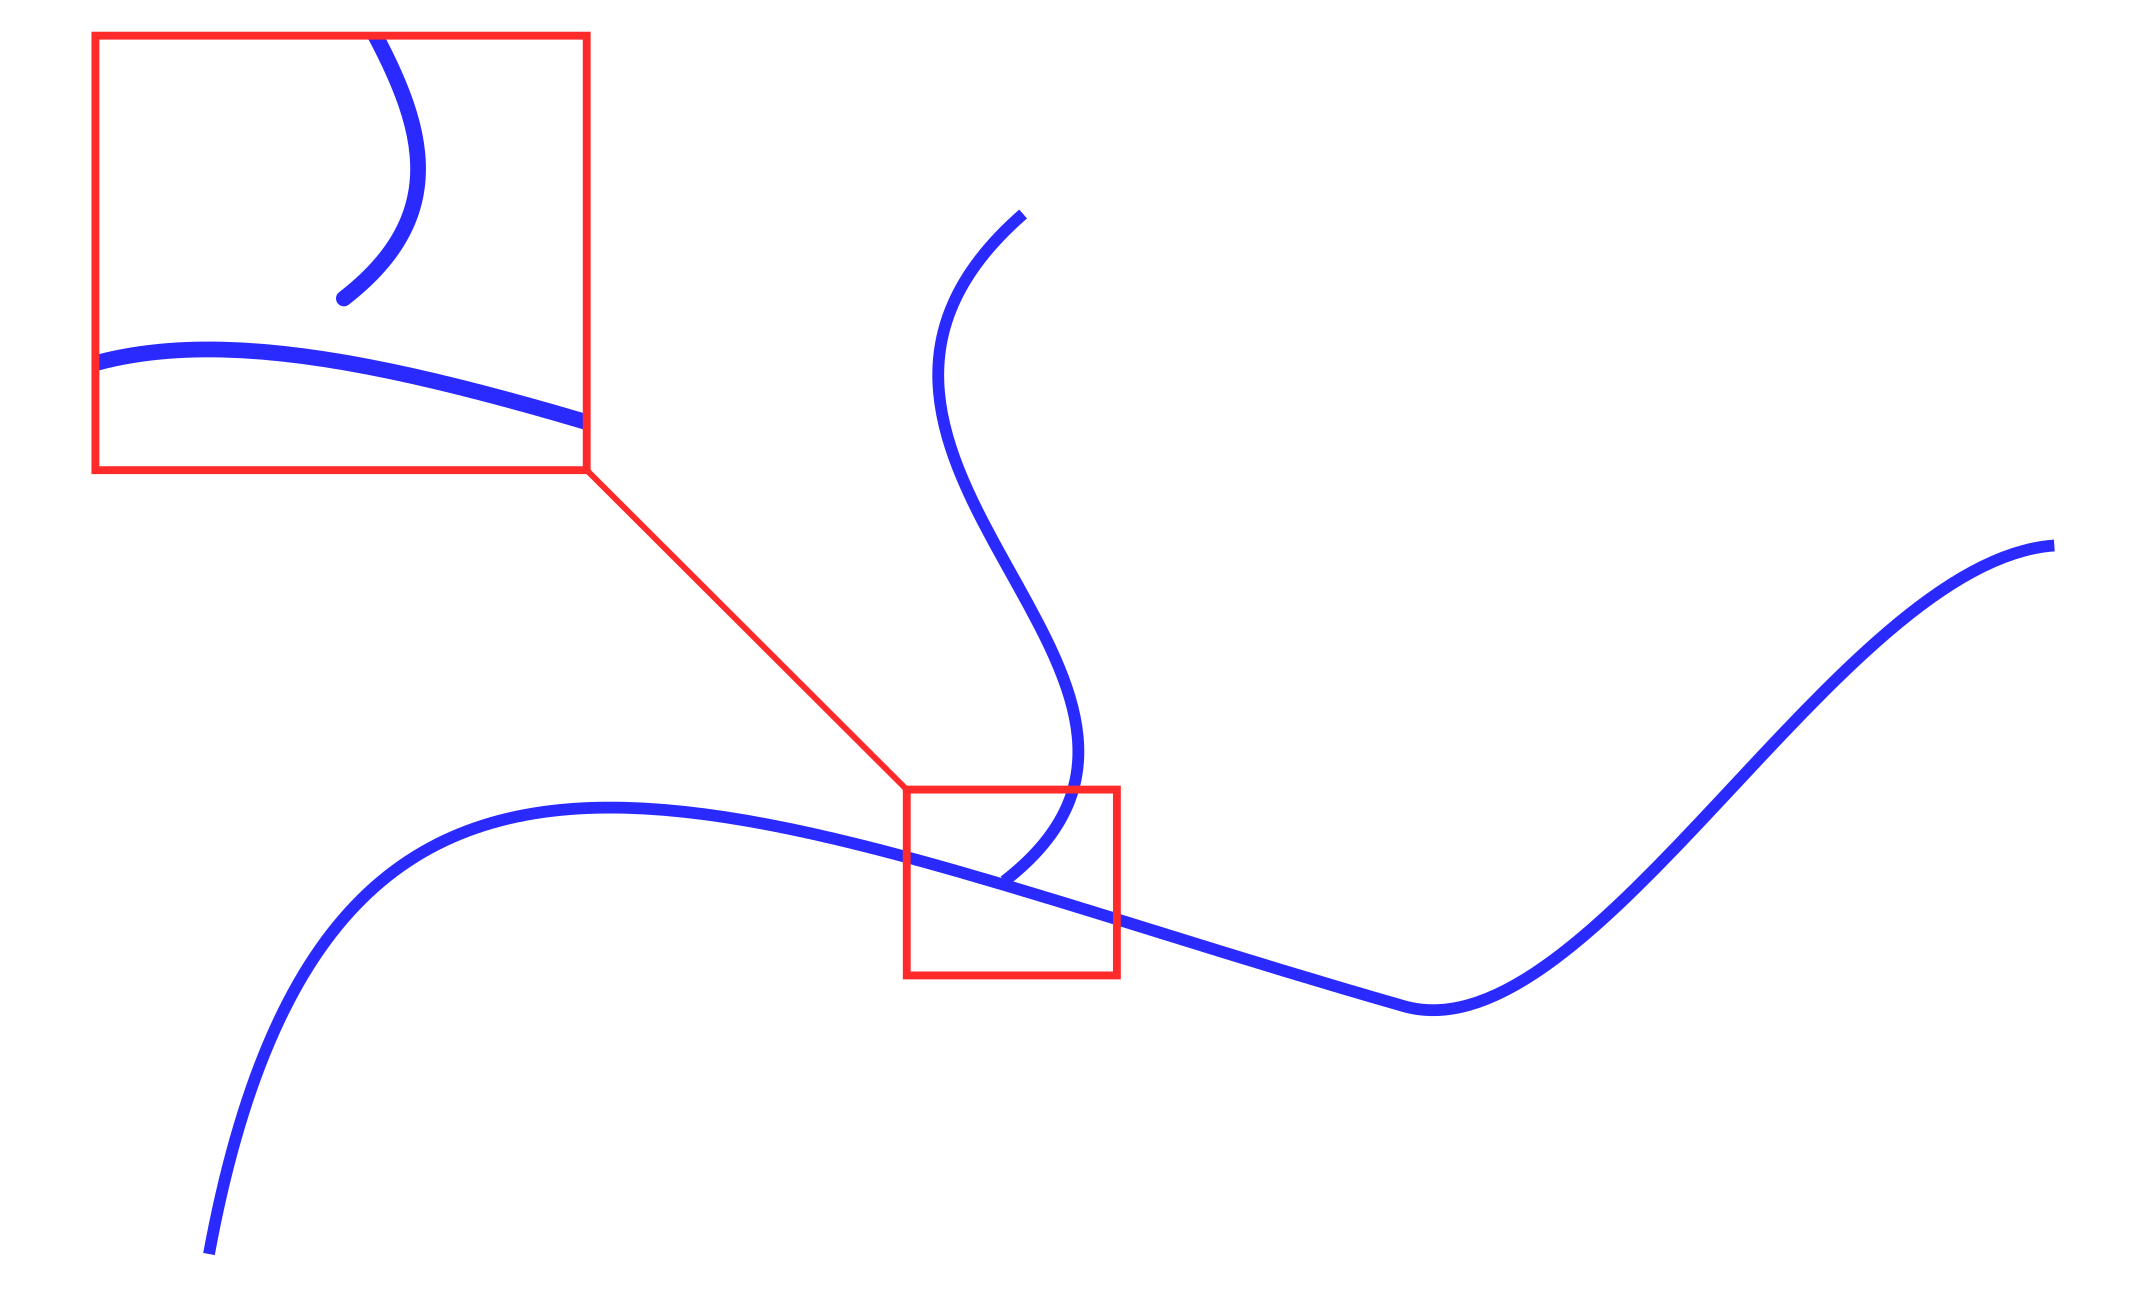
Therefore, the first stage of preprocessing is to correct the topology of objects: “tighten” the nodes, make the original vector layer consistent. To do this, use the tools from the data analysis panel in QGIS — “Fix geometries” (fixgeometries built-in) and v.clean (from the GRASS package).
因此,預處理的第一步是糾正對象的拓撲:“擰緊”節點,使原始矢量層保持一致。 為此,請使用QGIS中數據分析面板中的工具-“修復幾何”(內置的固定幾何)和v.clean(來自GRASS軟件包)。
After the topology is fixed, the layer is divided into segments at the points where the lines have intersections. The result after splitting is illustrated below (Fig. 3).
固定拓撲后,在直線相交的點將圖層分為幾部分。 拆分后的結果如下圖所示(圖3)。
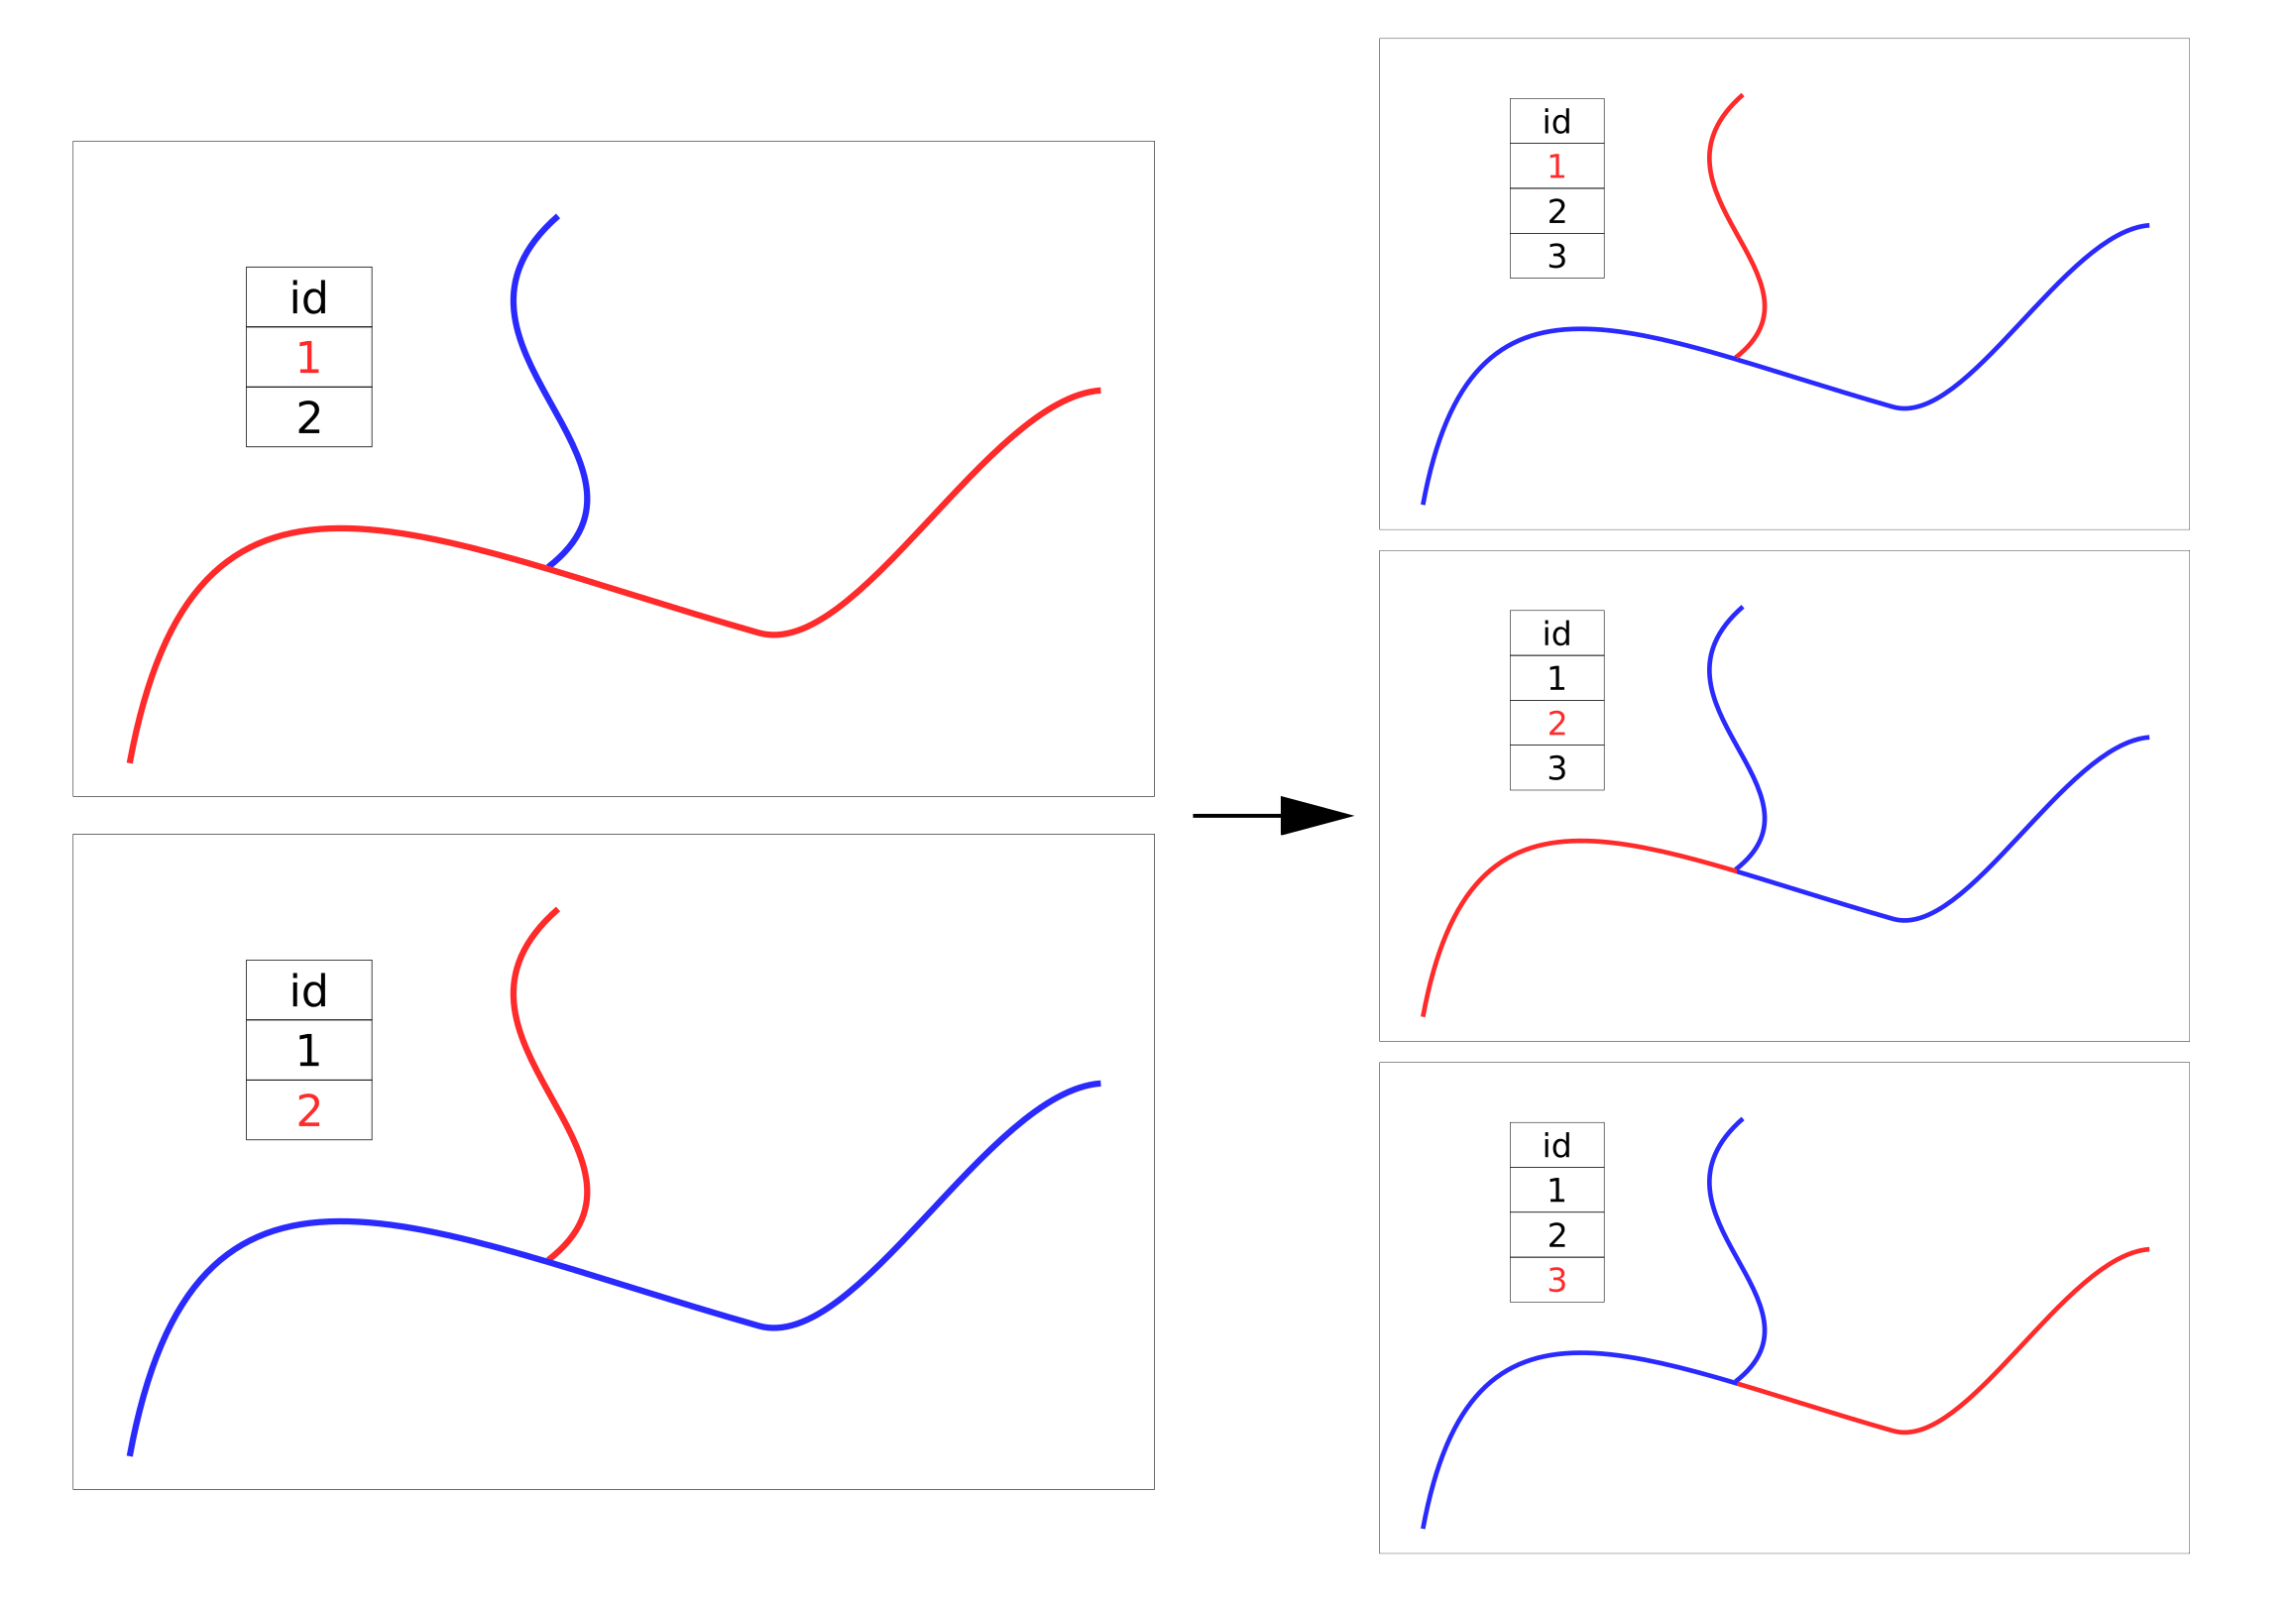
Thus, using the “splitwithlines” tool in QGIS, we divide the source layer into segments.
因此,使用QGIS中的“ splitwithlines”工具,我們將源層劃分為多個段。
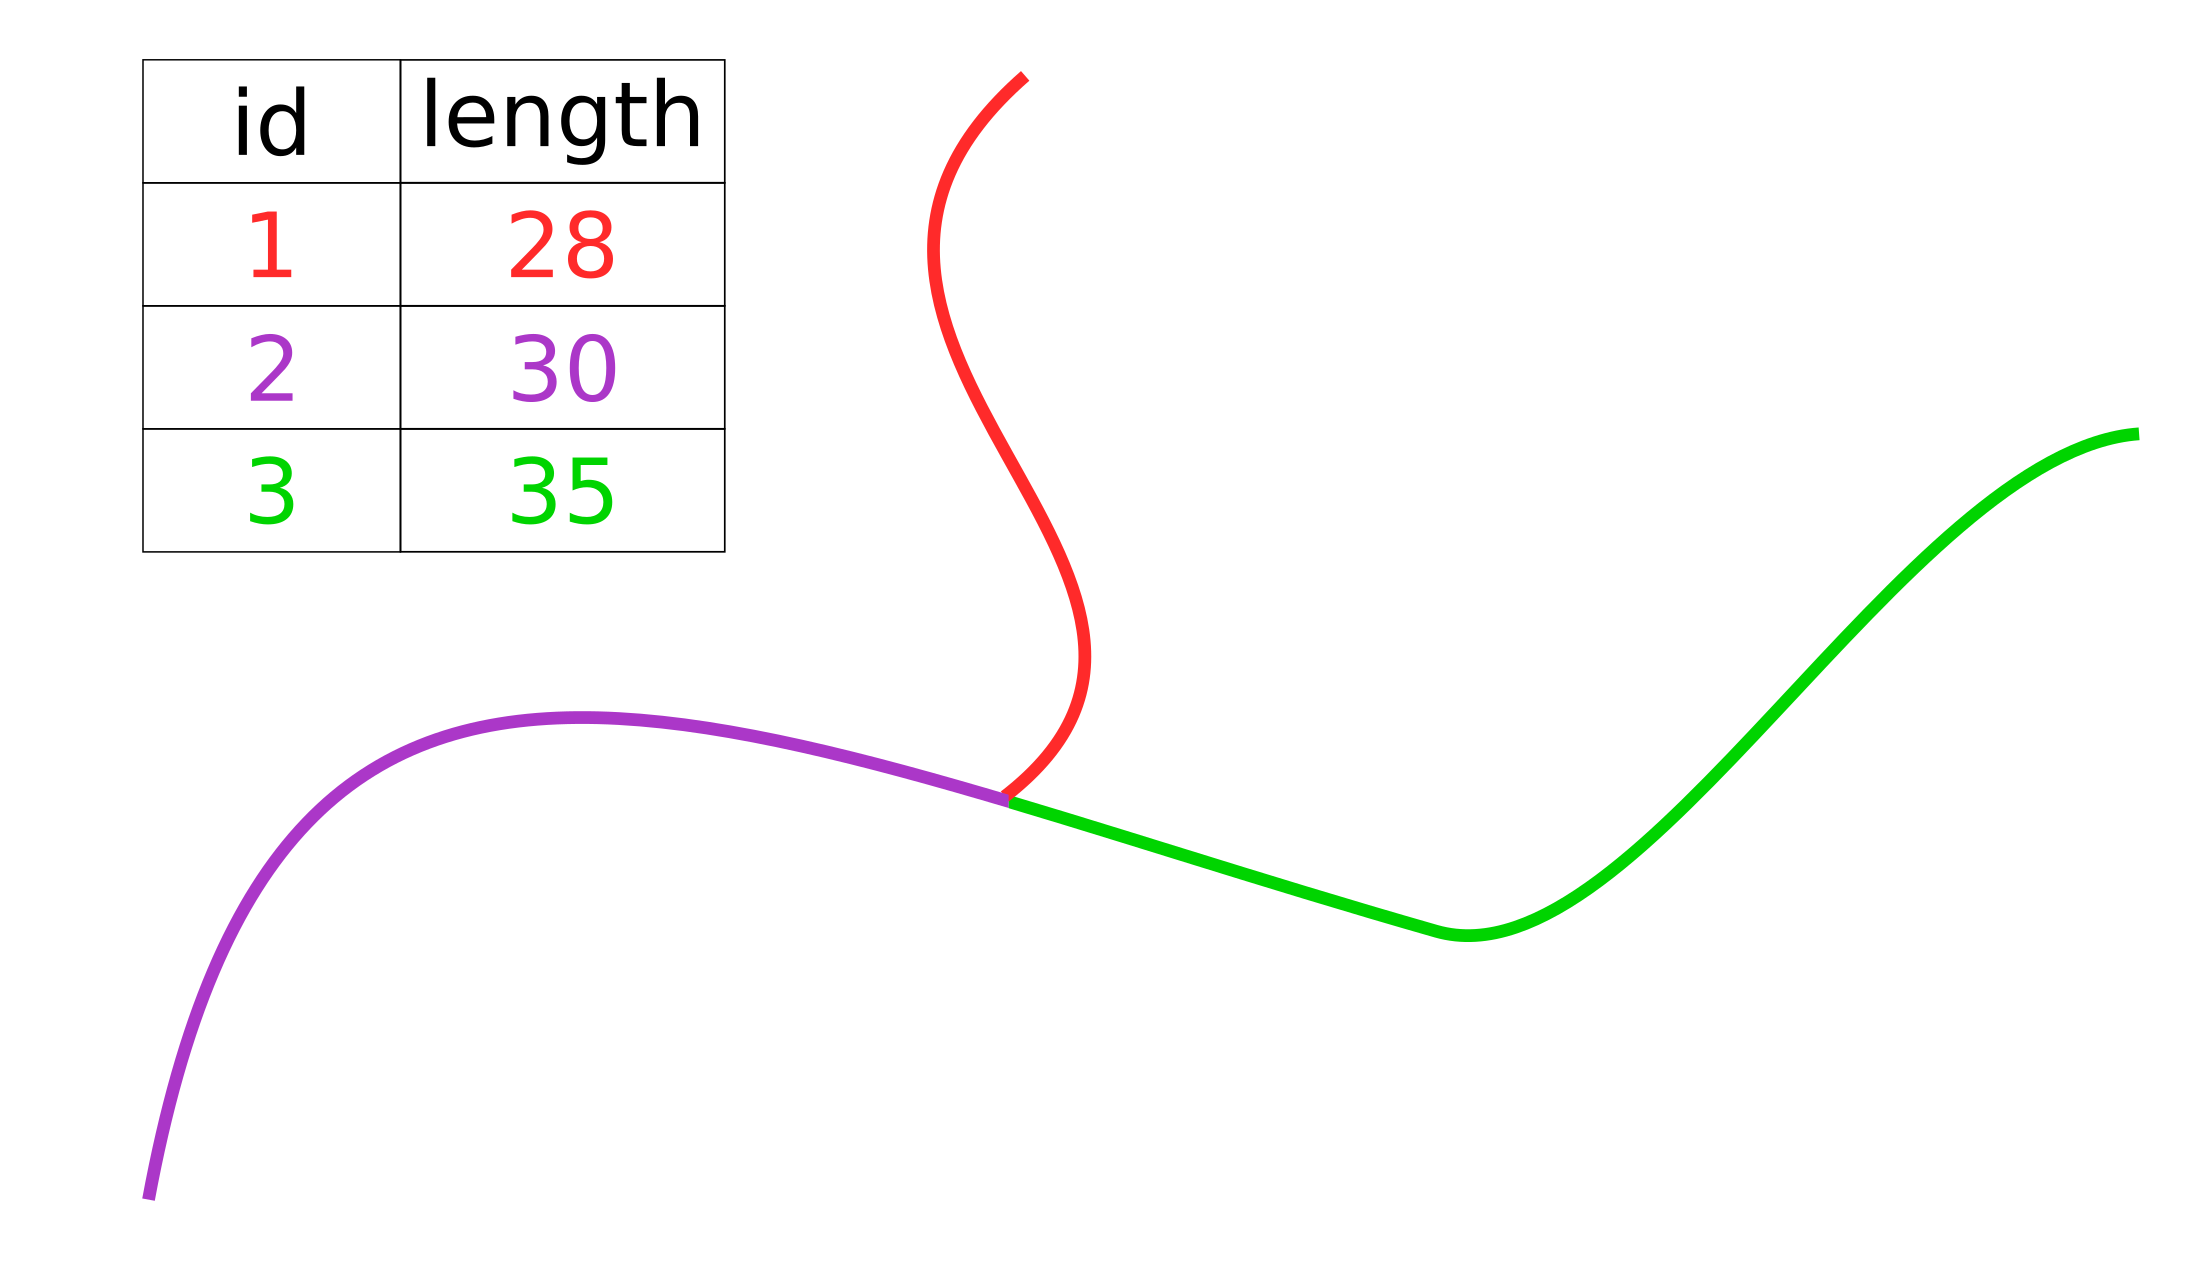
For each segment, we use QGIS to calculate the length and enter data in the attribute table of the layer (Fig. 4). the segment Length is calculated according to the user settings of the project (Project -> Properties -> General -> Ellipsoid).
對于每個段,我們使用QGIS計算長度并將數據輸入到圖層的屬性表中(圖4)。 段長度是根據項目的用戶設置(項目->屬性->常規->橢圓形)計算的。
After that, using the “line intersection” tool (built-in tool), we get a point vector layer, where information about segment intersections is set in the attribute table. This attribute table can be interpreted as an adjacency list.
之后,使用“線相交”工具(內置工具),獲得一個點矢量層,其中在屬性表中設置了有關線段相交的信息。 該屬性表可以解釋為鄰接表。
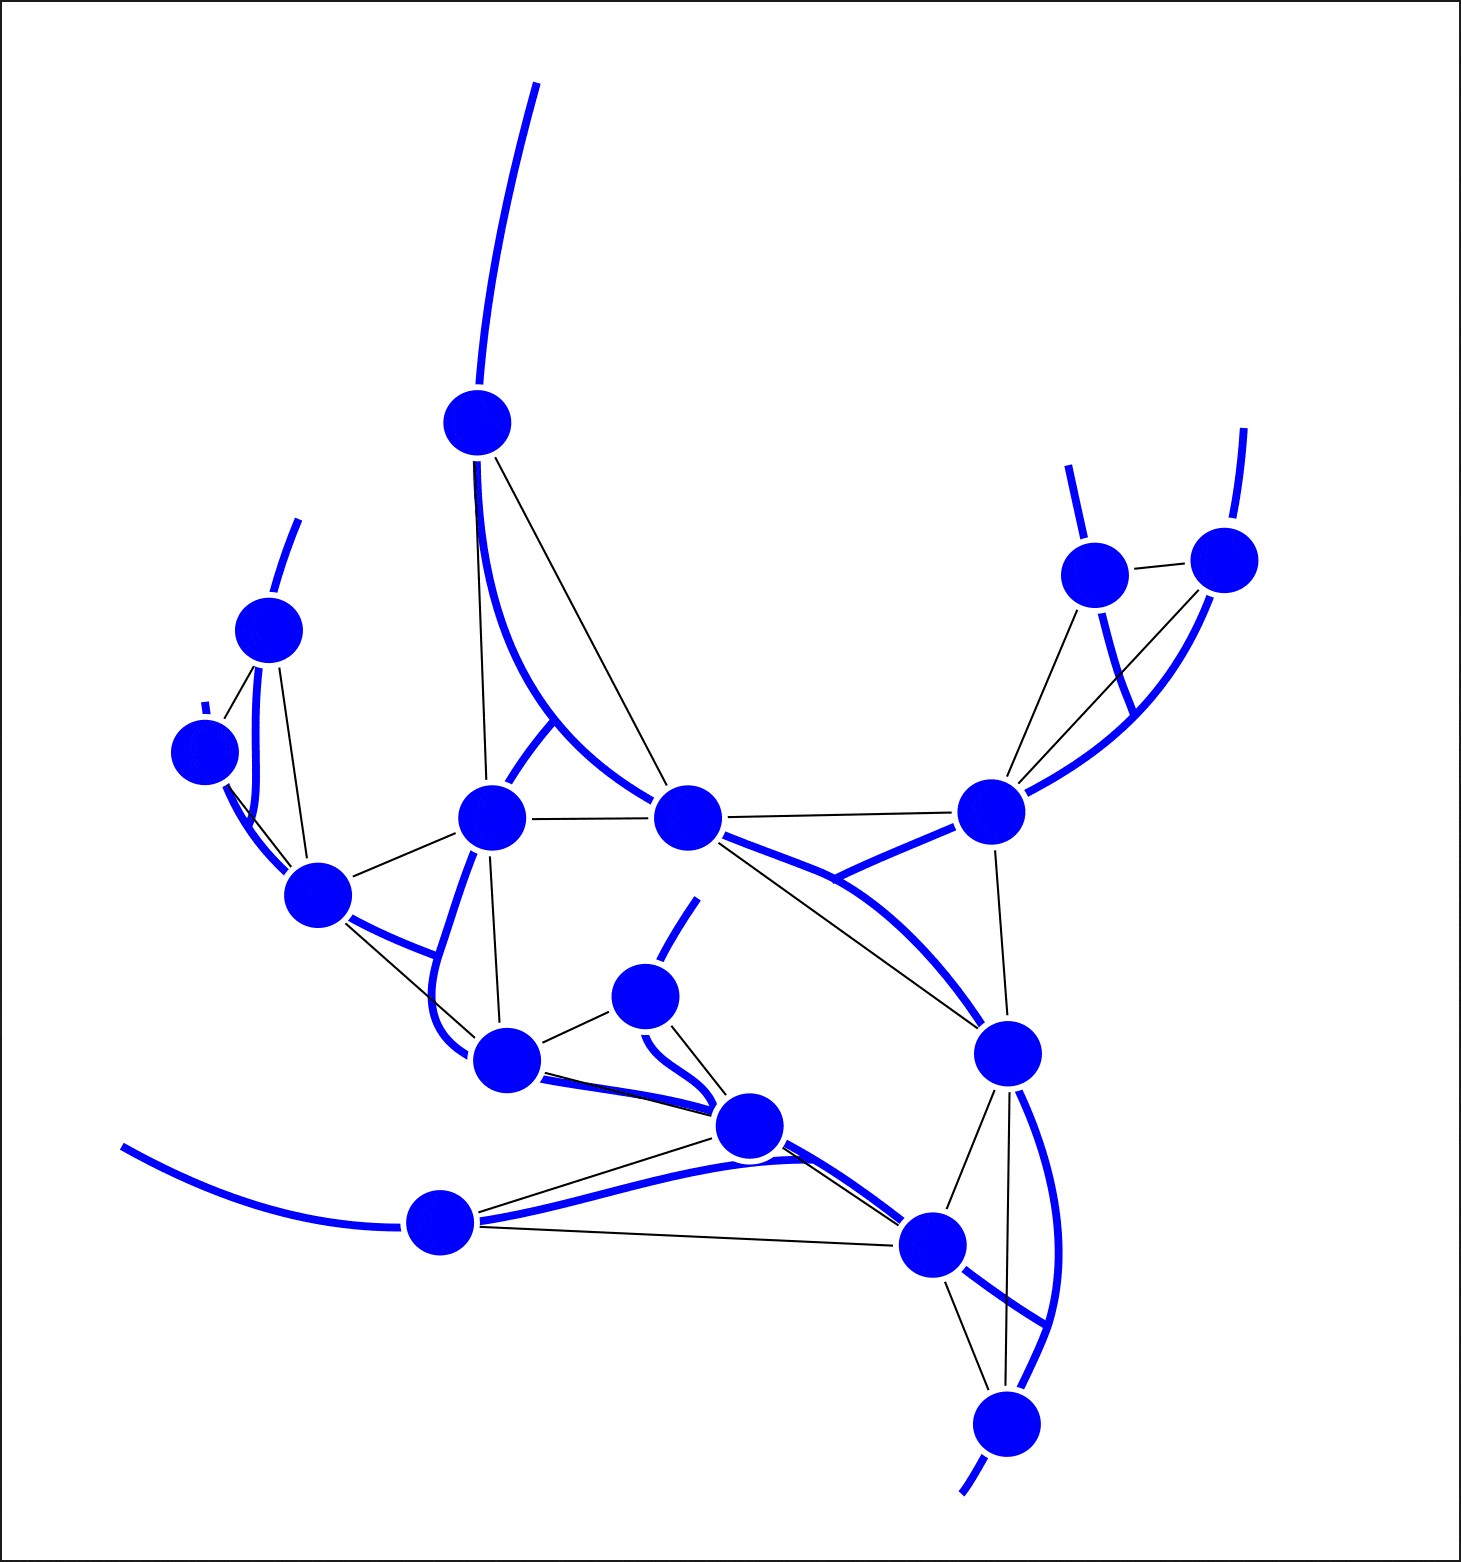
The preprocessing steps are shown in the following image (Fig. 5).
下圖顯示了預處理步驟(圖5)。
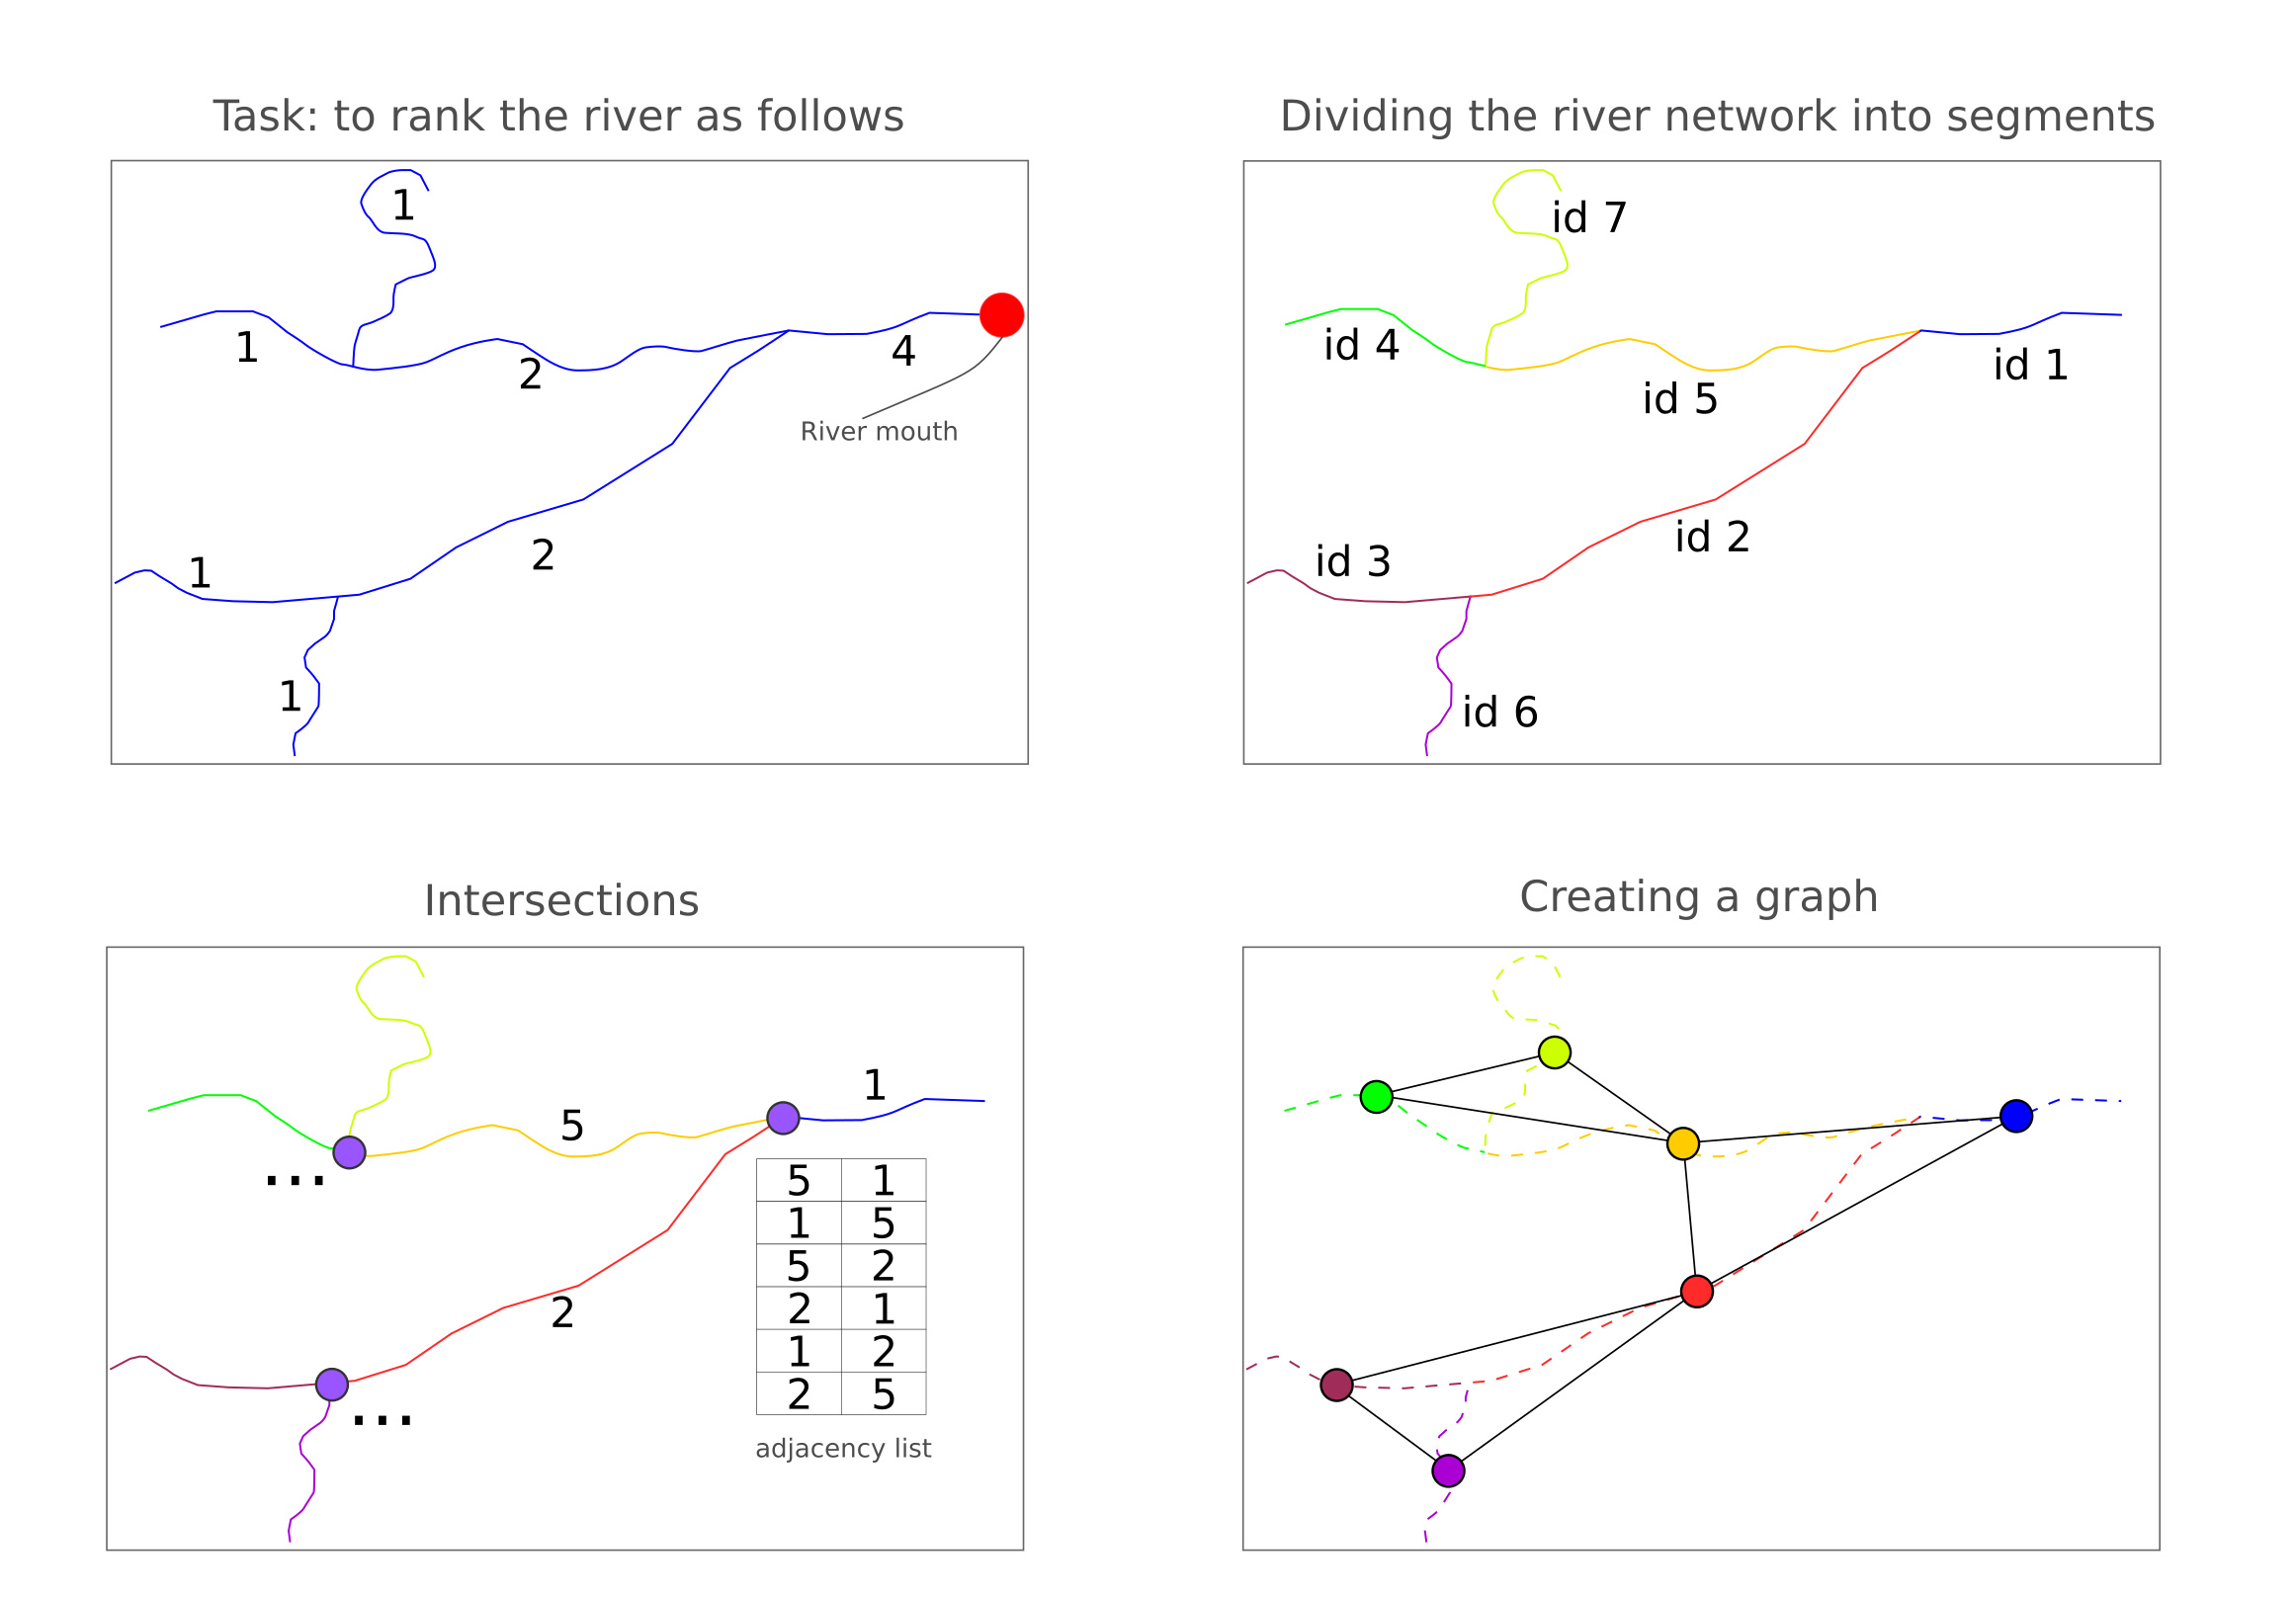
As a result of preprocessing, the graph is formed as a mathematical object of the networkx Python library. Thus, the river segments are vertices in the graph. If the segments are connected to each other (they have intersections), then there are edges between the graph vertices.
預處理的結果是,該圖被形成為networkx Python庫的數學對象。 因此,河段是圖中的頂點。 如果線段彼此連接(它們具有交點),則圖頂點之間將存在邊。
Algorithm for ranking linear objects
線性物體排序算法
After the graph is formed, we know which vertex to start the search from (the point where it flows from the main river into the lake or sea). Let’s call this vertex the closing one, since all other segments of the river network (vertexes) “flow” into it. We have divided the algorithm into several parts:
形成圖后,我們知道從哪個頂點開始搜索(從主要河流流入湖泊或海洋的點)。 我們將此頂點稱為閉合頂點,因為河網的所有其他部分(頂點)都“流入”其中。 我們將算法分為幾個部分:
- Ranking graph vertexes by distance from the closing segment, assigning the “rank” attribute (a measure of the segment’s distance) and the “offspring” attribute (the number of sections of the river network that flow directly into this segment); 根據與封閉路段的距離對圖頂點進行排名,并分配“等級”屬性(路段距離的度量)和“后代”屬性(直接流入該路段的河網路段數);
- Assigning the “value” attribute for the total number of tributaries flowing into a given section and the “distance” attribute (the distance of the segment’s extreme point from the mouth in meters). 為流入給定路段的支流總數分配“值”屬性,并為“距離”屬性(路段端點到口的距離,以米為單位)分配。
Both stages are divided into several blocks, but the main idea is a two-stage scheme for assigning attributes.
這兩個階段都分為幾個塊,但是主要思想是分配屬性的兩階段方案。
The assignment of the attributes “rank” and “offspring”
屬性“等級”和“后代”的分配
The first stage of graph traversal is to rank vertexes by the degree of distance from the closing one. We planned to carry out the assignment of the attribute “rank” with iterative breadth-first search (BFS). Thus, starting from the closing vertex, we would move further and further away at each step, and at the same time, we would assign an attribute “rank”. But in this case, the following conflict may occur (animation below).
圖遍歷的第一階段是按距封閉頂點的距離程度對頂點進行排名。 我們計劃使用迭代廣度優先搜索(BFS)來分配屬性“等級”。 因此,從閉合頂點開始,我們將在每一步上走得越來越遠,同時,我們將分配一個屬性“等級”。 但是在這種情況下,可能會發生以下沖突(以下動畫)。
And what rank should we assign to this segment? There may be other problems with this attribute assignment algorithm, but we have listed one of the most vital.
我們應該給這個細分市場分配什么等級? 此屬性分配算法可能還有其他問題,但我們列出了最重要的問題之一。
Suggested solution: we can determine the ranks for some part of the river network (the main river), and rank segments based on this information. This approach can be seen on the following picture (Fig. 6).
建議的解決方案:我們可以確定河網某些部分(主要河流)的等級,并根據此信息對路段進行等級劃分。 在下面的圖片中可以看到這種方法(圖6)。
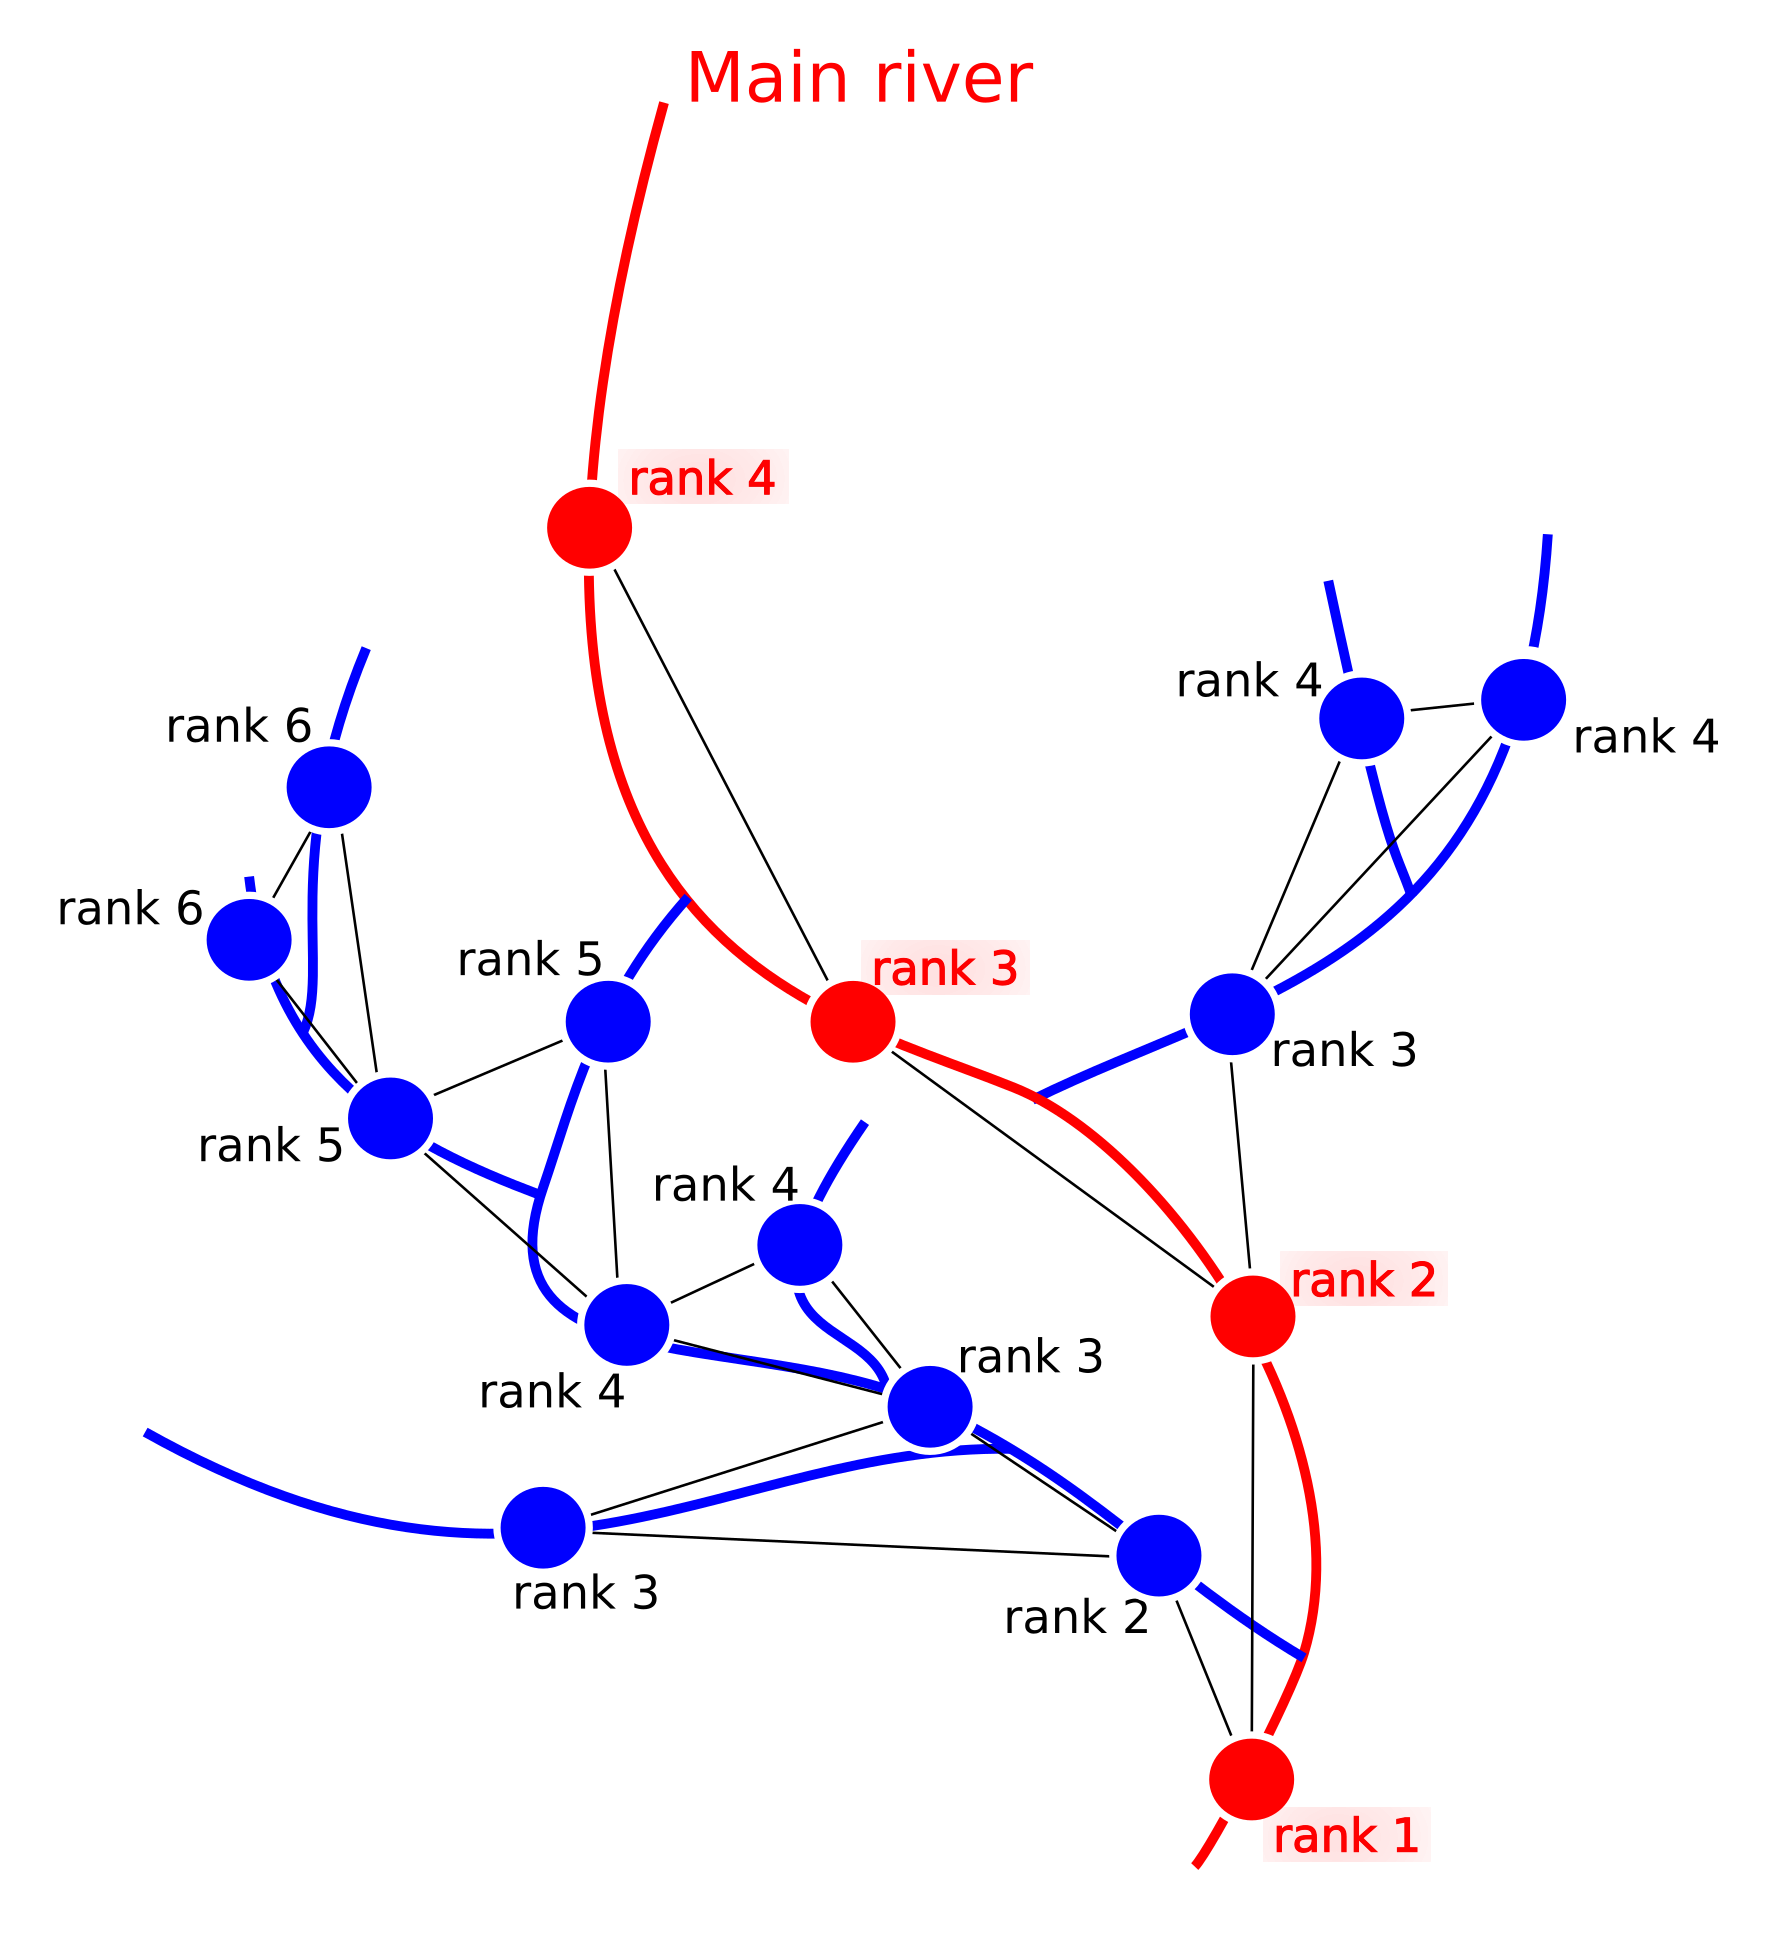
Thus, subgraphs can only join the reference route through 1 edge, and the other edges are excluded.
因此,子圖只能通過1條邊加入參考路徑,而其他邊則不包括在內。
This raises the following problem : how can we find such a route? — We will assume that the shortest route between the two most distant vertices in the graph, one of which is the closing one, is the reference route (we will soon add an update so that the user can set this route if they have knowledge of which river is the main one, but in the absence of such information, the reference route is determined by this way). This route can be obtained using the A* (A-star) algorithm, but this algorithm works with a weighted graph, and there are no weights on the edges of our graph yet. But we can set weights for the edges of the graph based on the segment lengths (we calculated them earlier).
這引起了以下問題:我們如何找到這樣的路線? —我們將假設圖中兩個最遠頂點之間的最短路徑是參考路徑(其中一個是閉合頂點)(我們將很快添加一個更新,以便用戶在了解以下情況時可以設置此路徑)哪條河流是主要河流,但是在沒有此類信息的情況下,參考路線是通過這種方式確定的。 可以使用A *(A-star)算法獲得此路線,但是該算法適用于加權圖,并且圖的邊緣上還沒有權重。 但是我們可以根據段的長度設置圖形邊緣的權重(我們之前已經對其進行了計算)。
- Assigning weights to the graph edges based on the lengths of segments. Simultaneously with this stage, one component is selected in the graph. The movement of the column is carried out using a breadth-first search. The assignment of weights can be demonstrated by the following figure (Fig. 7) 根據線段的長度為圖形邊緣分配權重。 在此階段的同時,圖中選擇了一個組件。 使用廣度優先搜索進行列的移動。 權重的分配可以通過下圖(圖7)進行演示。
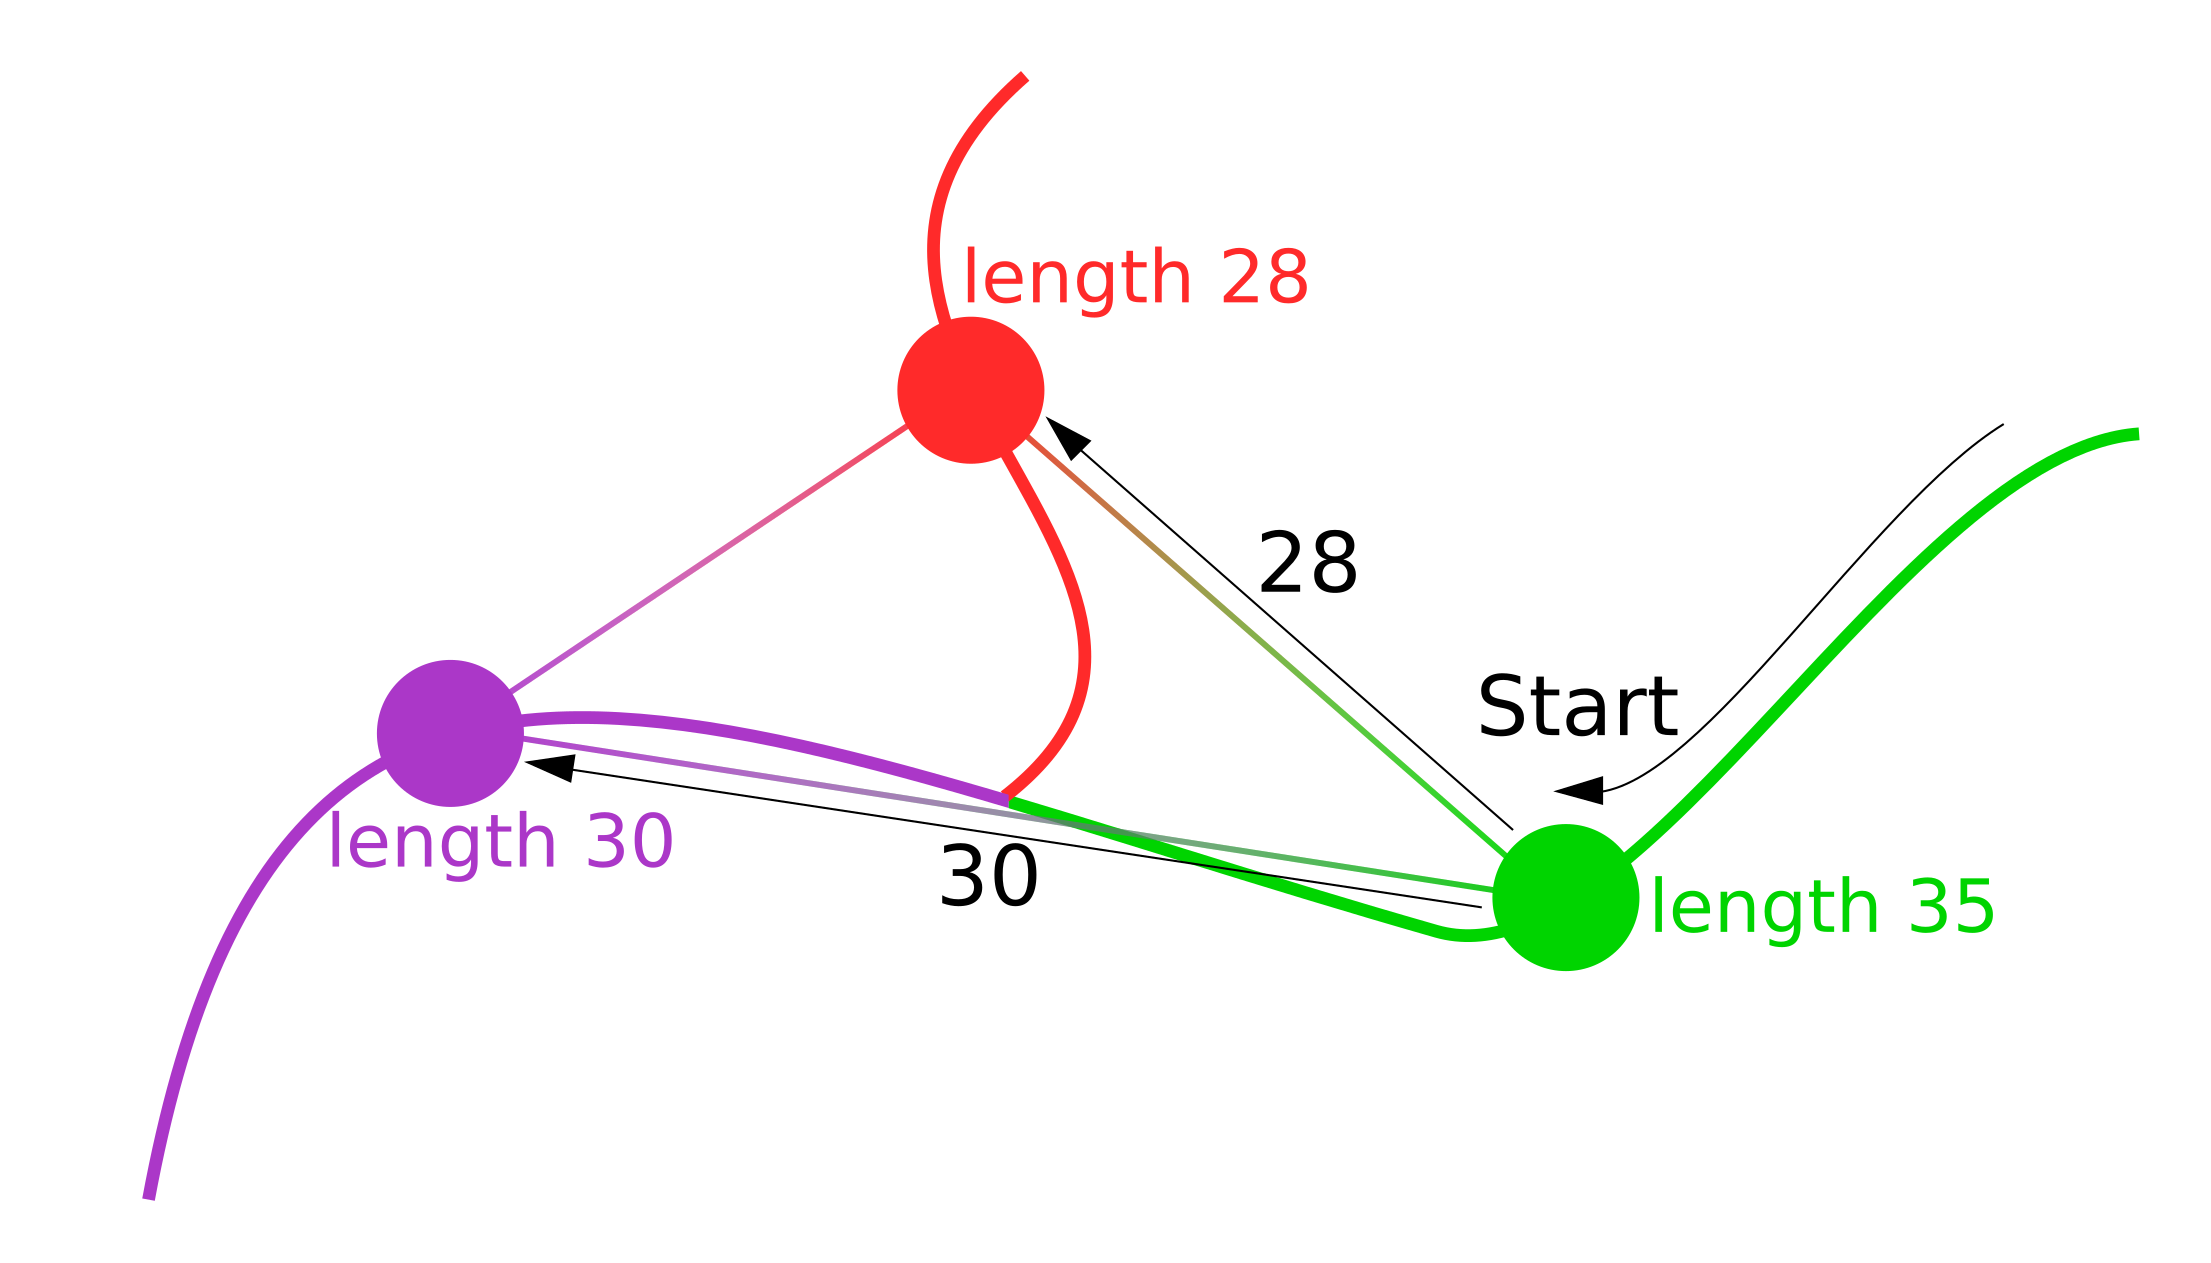
Thus, each vertex of the graph has the “length” attribute, which indicates the length of this segment of the river in meters. We also move attribute values from the graph vertices to the edges iteratively, starting to traverse the graph using BFS from the closing vertex.
因此,圖形的每個頂點都具有“長度”屬性,該屬性指示河流的這一段的長度(以米為單位)。 我們還將屬性值從圖頂點反復移動到邊,開始使用BFS從封閉頂點遍歷圖。
This task is performed by the following function, where are
此任務由以下功能執行,其中
- G — graph G —圖
- start — the vertex from which to start traversal start —從其開始遍歷的頂點
- dataframe — pandas dataframe with 2 columns: id_field (segment/vertex ID) and ‘length’ (the length of this segment) 數據框—具有2列的熊貓數據框:id_field(段/頂點ID)和“ length”(此段的長度)
- id_field — the field in the dataframe to use for mapping IDs to graph vertexes id_field —數據框中用于將ID映射到圖形頂點的字段
- main_id — index for the main river in the river network (default = None) main_id —河網中主要河流的索引(默認=無)
- A* (A-star) search for the shortest path on a weighted graph between the closing vertex and one of the most distant vertices (a segment in the river network). This shortest route between the two most distant vertices in the graph is called “reference route”; A *(A星)在權重圖上的最接近頂點和最遠頂點之一(河網中的一段)之間的最短路徑上搜索。 圖中兩個最遠頂點之間的最短路徑稱為“參考路徑”;
- Ranking by distance of all vertexes in the reference route. Vertex, from where we start the traversal, the value is assigned rank 1, the next vertex is 2, then — 3, etc. 按參考路徑中所有頂點的距離排序。 頂點,從此處開始遍歷,將值指定為等級1,下一個頂點為2,然后為3,依此類推。
- Iterative traversal of a graph with the beginning at the vertices of the reference route with isolation of the considered subgraphs. If one of the graph branches already has a connection to the vertices of the reference route, the edges that link the subgraph to other reference vertices are removed. 在參考路徑的頂點處開始且沒有考慮的子圖分離的情況下,迭代遍歷圖。 如果圖形分支之一已經與參考路徑的頂點建立了連接,則將子圖鏈接到其他參考頂點的邊將被刪除。
You can see the source code here
您可以在此處查看源代碼
- G — graph G —圖
- start — the vertex from which to start traversal start —從其開始遍歷的頂點
- last_vertex — one of the farthest vertices from the closing one in the graph last_vertex-距離圖中結束點最遠的頂點之一
You can see a demonstration of the described algorithm in the animation below.
您可以在下面的動畫中看到所描述算法的演示。
Thus, the reference route can be considered as the main river in the river network, when all other segments are tributaries to the main one.
因此,當所有其他路段均是主要路段的支流時,參考路線可被視為河網中的主要河段。
Moreover, this approach allows you to achieve good results when ranking rivers in “difficult” places, such as the mouth, where some branches first depart from the main river, and then, gaining new tributaries, flow into the main river again.
此外,當在“困難”的地方(例如河口)對河流進行排名時,這種方法可以使您獲得良好的效果,在這些地方,一些分支首先從主要河流中流出,然后獲得新的支流,再次流入主要河流。
Assigning the “value” and “distance” attributes
分配“值”和“距離”屬性
So, on the graph, all vertices are assigned the values of the “rank” and “offspring” attributes.
因此,在圖形上,所有頂點都被分配了“等級”和“后代”屬性的值。
If the vertex has no offspring, it means that no tributaries flow into this segment of the river network. Therefore, this vertex must be assigned the value “value” — 1. Then, for each node that has descendants (the rank of the descendants is always 1 less than the rank of the considering vertex) with the value “value” equal to 1, we need to count the number of descendants. The sum of “value” of all descendants of the considering vertex — the “ value” for considering vertex. Then, this procedure is repeated for other ranks.
如果頂點沒有后代,則意味著沒有支流流入河網的這一部分。 因此,必須為該頂點分配值“值” -1。然后,對于每個具有后代的節點(后代的等級始終比考慮的頂點的等級小1),其值“值”等于1 ,我們需要計算后代的數量。 考慮頂點的所有后代的“值”之和-考慮頂點的“值”。 然后,對其他等級重復此過程。
Thus, we iteratively move to the closing vertex.
因此,我們迭代地移至封閉頂點。
At the same time as assigning the “value” attribute to the graph vertices, the “distance” attribute is assigned, which characterizes the distance of segments from the mouth not by the number of segments that must be overcome to reach the closing one, but by the distance in meters that will need to be overcome to reach the river mouth.
在將“值”屬性分配給圖形頂點的同時,還分配了“距離”屬性,該屬性表示段到嘴的距離不是通過達到閉合點必須克服的段數來表征的,而是到達河口需要克服的距離(以米為單位)。
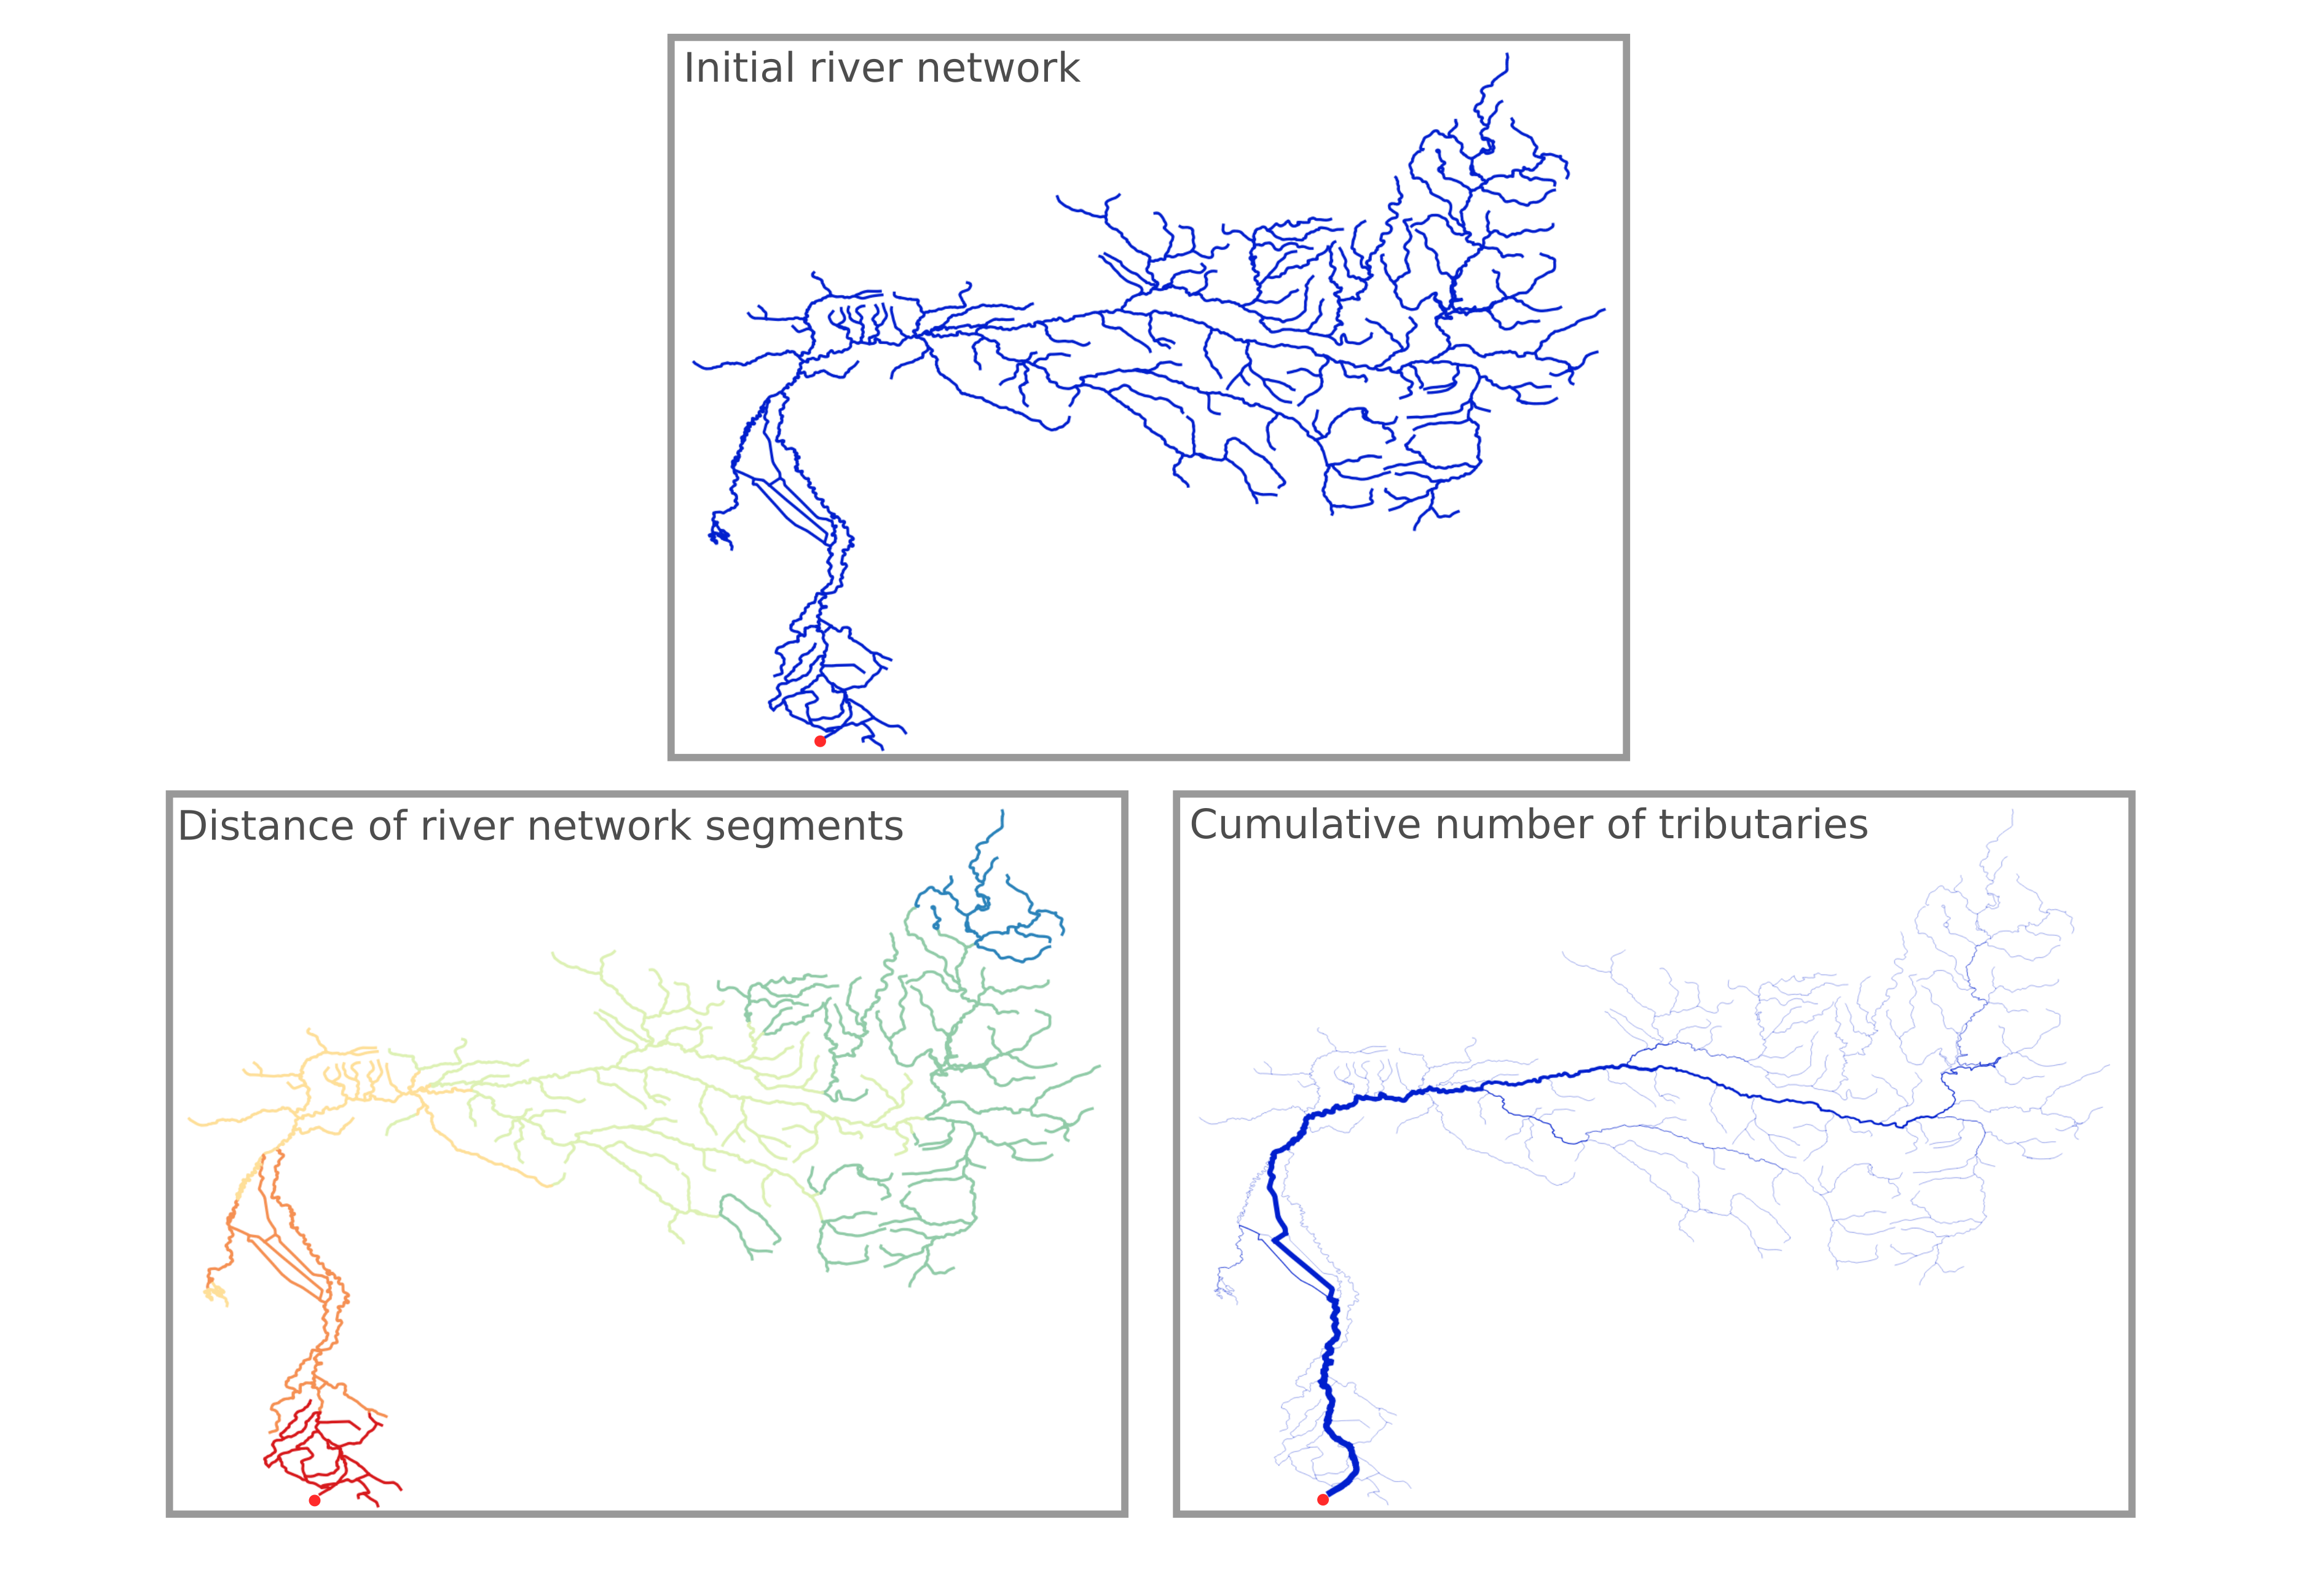
The result of using the algorithm can be seen in figure 8. the Distance of river network segments is shown based on the “rank” attribute and the total number of tributaries is shown based on the “value” attribute.
使用該算法的結果如圖8所示。河網段的距離基于“等級”屬性顯示,支流總數基于“值”屬性顯示。
結論 (Conclusion)
As you can see, the presented algorithm allows you to rank rivers without using additional information, such as digital elevation model. The obligatory input parameter, except for the main layer of the river network, is the position of the closing segment (where the river flows into the sea or lake), which can be specified as a point.
如您所見,該算法可以讓您對河流進行排名,而無需使用其他信息,例如數字高程模型。 除河網的主層外,強制性輸入參數是閉合線段的位置(河流流入大海或湖泊的位置),可以指定為一個點。
Thus, with the minimum amount of required input data, it is possible to obtain structured derived information that characterizes the elements of the river basin using the implemented algorithm.
因此,利用最少的所需輸入數據量,可以使用所實現的算法來獲得表征流域要素的結構化派生信息。
An open implementation of the algorithm in Python, as well as a plugin for QGIS, can be used by anyone. All processing is carried out by one thread, the user does not need to run all the functions separately.
任何人都可以使用Python中算法的開放式實現以及QGIS插件。 所有處理均由一個線程執行,用戶無需單獨運行所有功能。
We are glad to answer your questions and see your comments.
我們很高興回答您的問題并查看您的評論。
Repository with the code:
帶有代碼的存儲庫:
https://github.com/ChrisLisbon/QGIS_LinesRankingPlugin
https://github.com/ChrisLisbon/QGIS_LinesRankingPlugin
Feel free to contact us by e-mail:
隨時通過電子郵件與我們聯系:
mik_sar@mail.ru
mik_sar@mail.ru
翻譯自: https://medium.com/swlh/the-algorithm-for-ranking-the-segments-of-the-river-network-for-geographic-information-analysis-b25cffb0d167
水文分析提取河網
本文來自互聯網用戶投稿,該文觀點僅代表作者本人,不代表本站立場。本站僅提供信息存儲空間服務,不擁有所有權,不承擔相關法律責任。 如若轉載,請注明出處:http://www.pswp.cn/news/389172.shtml 繁體地址,請注明出處:http://hk.pswp.cn/news/389172.shtml 英文地址,請注明出處:http://en.pswp.cn/news/389172.shtml
如若內容造成侵權/違法違規/事實不符,請聯系多彩編程網進行投訴反饋email:809451989@qq.com,一經查實,立即刪除!相關文章

請不要更多的基本情節

Powershell-獲取DHCP地址租用信息

c# 對COM+對象反射調用時地址參數處理 c# 對COM+對象反射調用時地址參數處理

android觸摸消息的派發過程

python 交互式流程圖_使用Python創建漂亮的交互式和弦圖

機器學習解決什么問題_機器學習幫助解決水危機
)
遞歸原來可以so easy|-連載(3)

Viewport3D 類Viewport3D 類Viewport3D 類

升級android 6.0系統

AGC 022 B - GCD Sequence

最接近原點的 k 個點_第K個最接近原點的位置


讓自己的頭腦極度開放

簡介DOTNET 編譯原理 簡介DOTNET 編譯原理 簡介DOTNET 編譯原理

RecyclerView詳細了解

案例與案例之間的非常規排版

熊貓分發_熊貓新手:第二部分

淺析微信支付:申請退款、退款回調接口、查詢退款
)
view工作原理-計算視圖大小的過程(onMeasure)
![[轉載]使用.net 2003中的ngen.exe編譯.net程序](http://pic.xiahunao.cn/[轉載]使用.net 2003中的ngen.exe編譯.net程序)