在這次練習中將實現K-means 聚類算法并應用它壓縮圖片,第二部分,將使用主成分分析算法去找到一個臉部圖片的低維描述。
K-means Clustering
Implementing K-means
K-means算法是一種自動將相似的數據樣本聚在一起的方法,K-means背后的直觀是一個迭代過程,它從猜測初始的質心開始,然后通過重復地將示例分配到最接近的質心,然后根據分配重新計算質心,來細化這個猜測。
具體步驟:
- 隨機初始K個質心
- 開始迭代
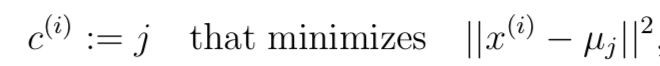
- 為每個樣本找到最近的質心
- 用分配給每個質心的點來計算每個質心的平均值,作為新的質心
- 回到三
- 收斂于最終的均值集
在實踐中,K-means算法通常使用不同的隨機初始化運行幾次。從不同的隨機初始化中選擇不同的解的一種方法是選擇成本函數值(失真)最低的解。
Finding closest centroids
Computing centroid means
for every centroid k we set
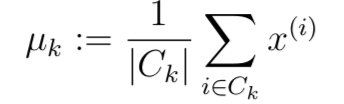
新的形心重置為所有聚集該形心和的平均值
K-means on example dataset
def find_closest_centroids(X, centroids):idx = np.zeros((len(X), 1))print(idx.shape)K = len(centroids)print(K)t = [0 for i in range(K)]print(t)for i in range(len(X)):for j in range(K):temp = centroids[j, :] - X[i, :]t[j] = temp.dot(temp.T)index = t.index(min(t)) + 1print(index)idx[i] = indexreturn np.array(idx)
mat = loadmat("ex7data2.mat")
X = mat['X']
init_centroids = np.array([[3, 3], [6, 2], [8, 5]])
idx = find_closest_centroids(X, init_centroids)
print(idx[0:3])
計算出聚集樣本的平均數,得到新的centroids
def compute_centroids(X, idx):centroids = []# print(idx)K = len(np.unique(idx))m, n = X.shapecentroids = np.zeros((K, n))temp = np.zeros((K, n))count = np.zeros((K, 1))print(temp.shape)print(count.shape)for i in range(m):for j in range(K):if idx[i] == j:temp[j, :] = temp[j, :] + X[i, :]count[j] = count[j] + 1centroids = temp/countreturn centroids
繪制聚類過程
def plotData(X, centroids, idx=None):"""可視化數據,并自動分開著色。idx: 最后一次迭代生成的idx向量,存儲每個樣本分配的簇中心點的值centroids: 包含每次中心點歷史記錄"""colors = ['b', 'g', 'gold', 'darkorange', 'salmon', 'olivedrab','maroon', 'navy', 'sienna', 'tomato', 'lightgray', 'gainsboro''coral', 'aliceblue', 'dimgray', 'mintcream','mintcream']assert len(centroids[0]) <= len(colors), 'colors not enough 'subX = []  # 分號類的樣本點if idx is not None:for i in range(centroids[0].shape[0]):x_i = X[idx[:, 0] == i]subX.append(x_i)else:subX = [X]  # 將X轉化為一個元素的列表,每個元素為每個簇的樣本集,方便下方繪圖# 分別畫出每個簇的點,并著不同的顏色plt.figure(figsize=(8, 5))for i in range(len(subX)):xx = subX[i]plt.scatter(xx[:, 0], xx[:, 1], c=colors[i], label='Cluster %d' % i)plt.legend()plt.grid(True)plt.xlabel('x1', fontsize=14)plt.ylabel('x2', fontsize=14)plt.title('Plot of X Points', fontsize=16)# 畫出簇中心點的移動軌跡xx, yy = [], []for centroid in centroids:xx.append(centroid[:, 0])yy.append(centroid[:, 1])plt.plot(xx, yy, 'rx--', markersize=8)plotData(X, [init_centroids])
plt.show()
def run_k_means(X, centroids, max_iters):K = len(centroids)centroids_all = []centroids_all.append(centroids)centroid_i = centroidsfor i in range(max_iters):idx = find_closest_centroids(X, centroid_i)centroid_i = compute_centroids(X, idx)centroids_all.append(centroid_i)return idx, centroids_allidx, centroids_all = run_k_means(X, init_centroids, 20)
plotData(X, centroids_all, idx)
plt.show()
Random initialization
- 洗牌所有數據
- 取前k個作為centroids
隨機選取K個樣本作為centroids
def initCentroids(X, K):m, n = X.shapeidx = np.random.choice(m, K)centroids = X[idx]return centroids
for i in range(K):centroids = initCentroids(X, K)idx, centroids_all = run_k_means(X, centroids, 10)plotData(X, centroids_all, idx)
Image compression with K-means
讀入圖片,128*128 RGB編碼圖片
from skimage import ioA = io.imread('bird_small.png')
print(A.shape)
plt.imshow(A)
A = A/255.
K-means on pixels
X = A.reshape(-1, 3)
K = 16
centroids = initCentroids(X, K)
idx, centroids_all = run_k_means(X, centroids, 10)img = np.zeros(X.shape)
centroids = centroids_all[-1]
for i in range(len(centroids)):img[idx == i] = centroids[i]img = img.reshape((128, 128, 3))fig, axes = plt.subplots(1, 2, figsize=(12, 6))
axes[0].imshow(A)
axes[1].imshow(img)
Principal Component Analysis
Example Dataset
mat = loadmat('ex7data1.mat')
X = mat['X']
print(X.shape)
plt.scatter(X[:,0], X[:,1], facecolors='none', edgecolors='b')
plt.show()
Implementing PCA
兩個步驟:
- 計算矩陣數據的協方差
- 使用SVD 方法得出特征向量
使用歸一化是每個特征在同一范圍內。
def feature_normalize(X):means = X.mean(axis=0)stds = X.std(axis=0, ddof=1)X_norm = (X - means) / stdsreturn X_norm, means, stds
def pca(X):sigma = (X.T @ X) / len(X)U, S, V = np.linalg.svd(sigma)return U, S, V
X_norm, means, stds = feature_normalize(X)
U, S, V = pca(X_norm)
print(U[:,0])
plt.figure(figsize=(7, 5))
plt.scatter(X[:,0], X[:,1], facecolors='none', edgecolors='b')plt.plot([means[0], means[0] + 1.5*S[0]*U[0,0]],[means[1], means[1] + 1.5*S[0]*U[0,1]],c='r', linewidth=3, label='First Principal Component')
plt.plot([means[0], means[0] + 1.5*S[1]*U[1,0]],[means[1], means[1] + 1.5*S[1]*U[1,1]],c='g', linewidth=3, label='Second Principal Component')
plt.grid()
plt.axis("equal")
plt.legend()
Dimensionality Reduction with PCA
Projecting the data onto the principal components
def project_data(X, U, K):Z = X @ U[:, :K]return Z
def recover_data(Z, U, K):X_rec = Z @ U[:, :K].Treturn X_rec
Reconstructing an approximation of the data
X_rec = recover_data(Z, U, 1)
X_rec[0]
Visualizing the projections
plt.figure(figsize=(7,5))
plt.axis("equal")
plot = plt.scatter(X_norm[:,0], X_norm[:,1], s=30, facecolors='none',edgecolors='b',label='Original Data Points')
plot = plt.scatter(X_rec[:,0], X_rec[:,1], s=30, facecolors='none',edgecolors='r',label='PCA Reduced Data Points')plt.title("Example Dataset: Reduced Dimension Points Shown",fontsize=14)
plt.xlabel('x1 [Feature Normalized]',fontsize=14)
plt.ylabel('x2 [Feature Normalized]',fontsize=14)
plt.grid(True)for x in range(X_norm.shape[0]):plt.plot([X_norm[x,0],X_rec[x,0]],[X_norm[x,1],X_rec[x,1]],'k--')# 輸入第一項全是X坐標,第二項都是Y坐標
plt.legend()
Face Image Dataset
mat = loadmat('ex7faces.mat')
X = mat['X']
print(X.shape)
def display_data(X, row, col):fig, axs = plt.subplots(row, col, figsize=(8, 8))for r in range(row):for c in range(col):axs[r][c].imshow(X[r * col + c].reshape(32, 32).T, cmap='Greys_r')axs[r][c].set_xticks([])axs[r][c].set_yticks([])display_data(X, 10, 10)
PCA on Faces
X_norm, means, stds = feature_normalize(X)
U, S, V = pca(X_norm)
display_data(U[:,:36].T, 6, 6)
Dimensionality Reduction
z = project_data(X_norm, U, K=36)
X_rec = recover_data(z, U, K=36)
display_data(X_rec, 10, 10)


![CODE[VS] 1621 混合牛奶 USACO](http://pic.xiahunao.cn/CODE[VS] 1621 混合牛奶 USACO)


![isql 測試mysql連接_[libco] 協程庫學習,測試連接 mysql](http://pic.xiahunao.cn/isql 測試mysql連接_[libco] 協程庫學習,測試連接 mysql)


