??新建了一個ASP.NET Core 5.0的Web API項目,當使用斷點調試Host.CreateDefaultBuilder(args)時,進入該函數后查看中間變量的值,報錯Evaluation is not allowed: The thread is not at a GC-safe point。在群里問了也沒人回應,可能沒有遇到過這個問題吧。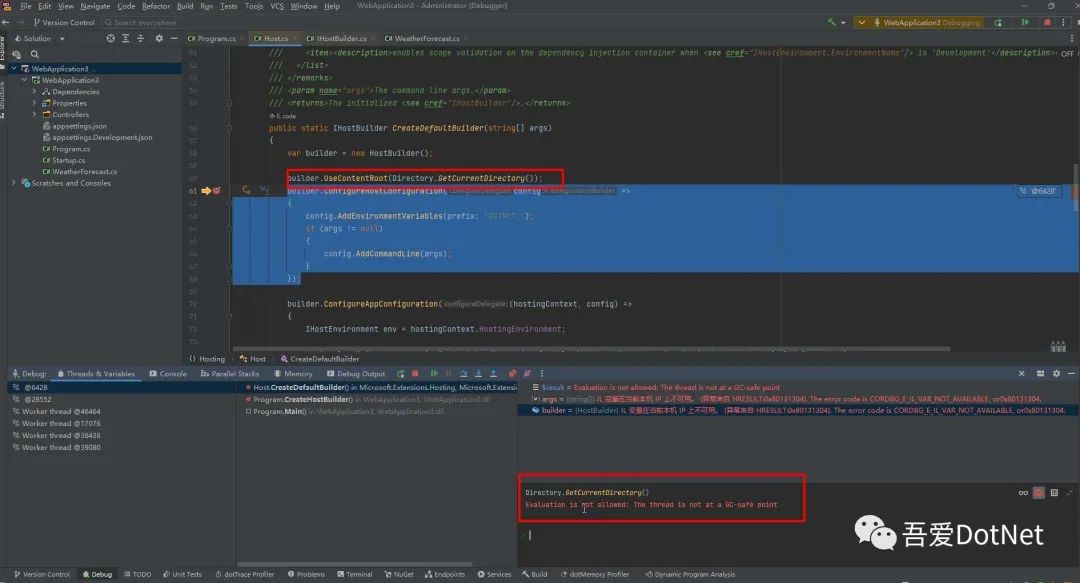
一.解決問題的過程
1.Visual Studio 2022調試
??首先想到的是可能Rider不行,換成Visual Studio 2022試試,所以就查到了文獻[1],發現需要pdb文件,還需要設置符號什么的,覺得太麻煩了。
2.Rider調試
??然后又換成了Rider,既然調試看不到中間變量的值,那就直接Console.WriteLine()出來,結果Console在當前上下文中根本就不存在,如下: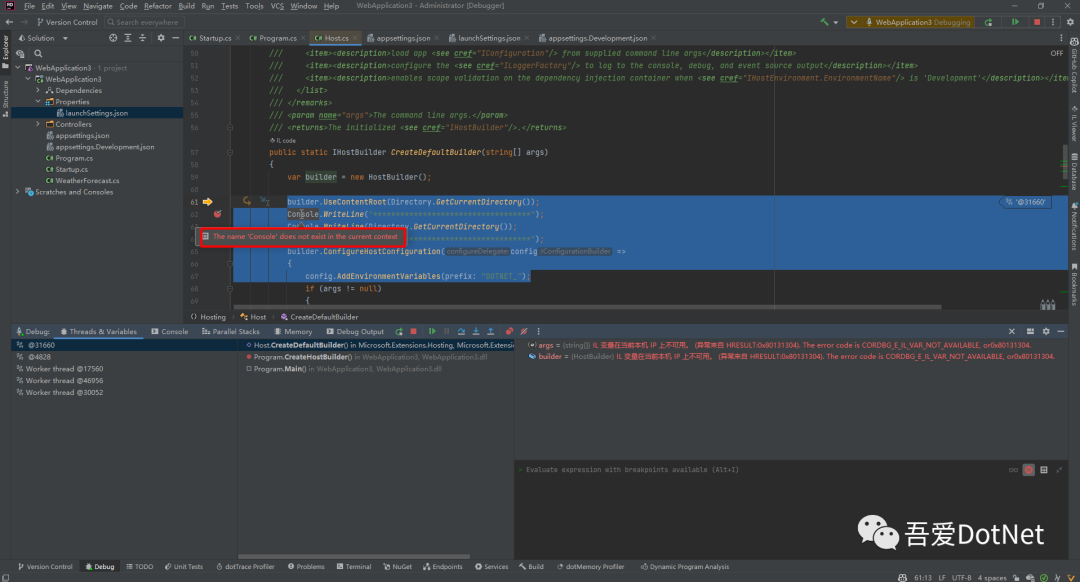
二.最終的解決方法
1.YouTrack上的解決方法
??繼續在網上查找,發現在JetBrains的官方YouTrack上[2][3],Evgeny Terekhin在2022年5月30日給出了一個解決方法:
SET COMPLUS_ZapDisable=1	NGen off (CLR)
SET COMPLUS_JitMinOpts=1	Disable as much JIT optimizations as possible (CoreCLR)
SET COMPlus_TieredCompilation=0	No tiered JIT, only do one pass (CoreCLR)
SET COMPLUS_ReadyToRun=0	Don't do netcore's analog to NGen (CoreCLR)
大概的意思是對CLR做了設置,先不管設置的什么了,抱著試試看的心態。配置launchSettings.json文件:
"environmentVariables": {"ASPNETCORE_ENVIRONMENT": "Development","COMPLUS_ZapDisable": "1","COMPLUS_JitMinOpts": "1","COMPlus_TieredCompilation": "0","COMPLUS_ReadyToRun": "0"
}
完成的配置文件如下所示: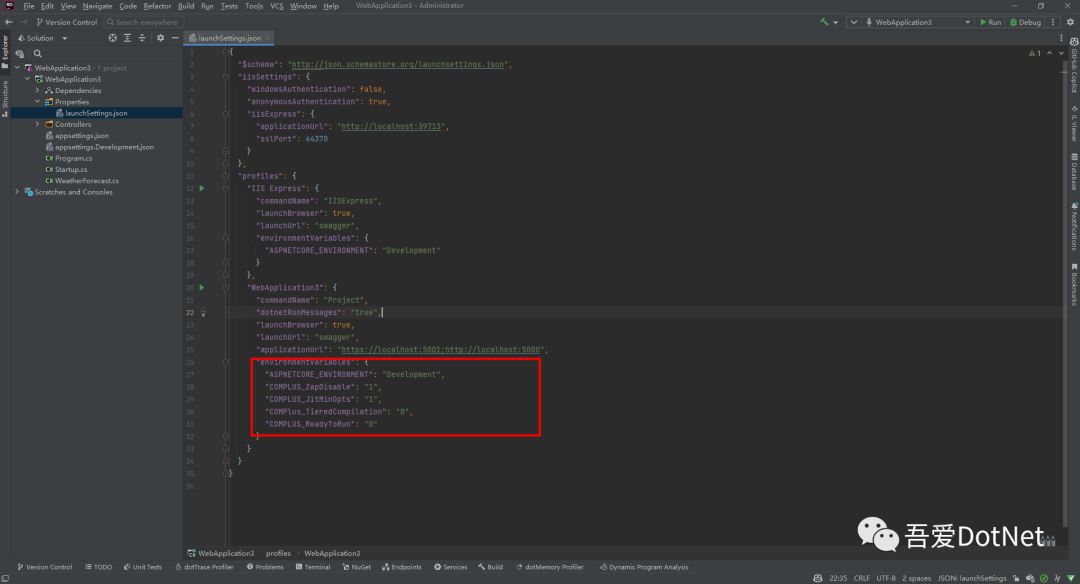
2.調試ASP.NET Core
??打上斷點啟動調試后,神奇般的發現也可以查看中間變量了。如下: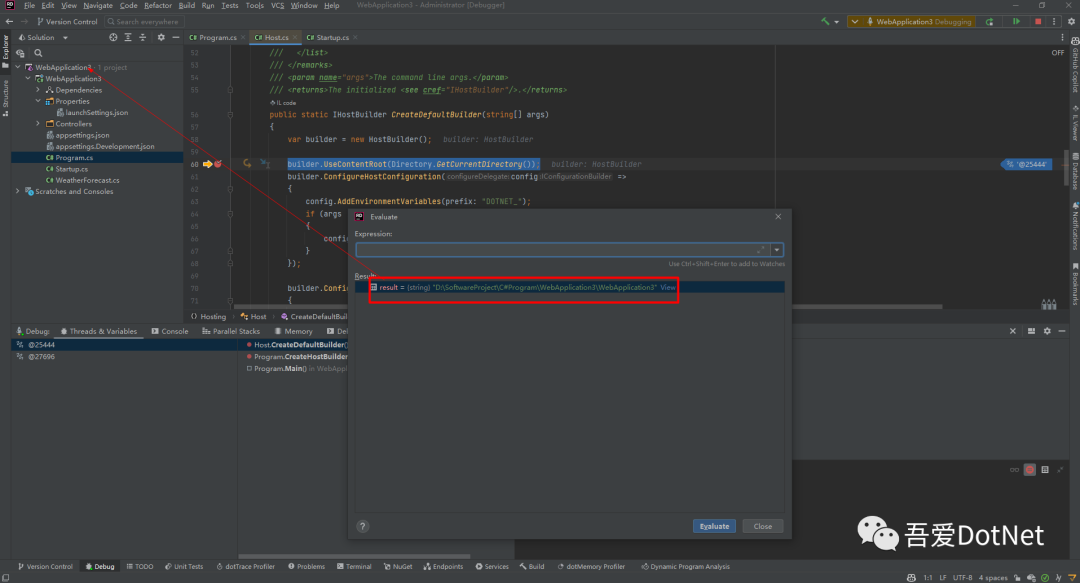 Rider調試源碼還是比Visual Studio方便很多,不需要pdb文件,也不需要設置什么符號,只需要進入要調試的函數中打上斷點,然后啟動調試即可。
參考文獻:
[1]Debugging External Sources with Visual Studio:https://devblogs.microsoft.com/visualstudio/debugging-external-sources-with-visual-studio/
[2]Debugger: Evaluation is not allowed: The thread is not at a GC-safe point:https://youtrack.jetbrains.com/issue/RIDER-40357
[3]When debugging, variables don't display all of their data, instead we get 'Evaluation is not allowed: The thread is not at a GC-safe point':https://youtrack.jetbrains.com/issue/RIDER-10885/When-debugging-variables-dont-display-all-of-their-data-instead-we-get-Evaluation-is-not-allowed-The-thread-is-not-at-a-GC-safe
) is too old to check APIs compiled with API 26;)


關于margin的一些想法2.0)


)


![[轉]以終為始,詳細分析高考志愿該怎么填](http://pic.xiahunao.cn/[轉]以終為始,詳細分析高考志愿該怎么填)


