最近客戶有個新需求,就是想查看網站的訪問情況,由于網站沒有做google的統計和百度的統計,所以訪問情況,只能通過日志查看,通過腳本的形式給客戶導出也不太實際,給客戶寫個簡單的頁面,咱也做不到
成熟的日志解決方案,那就是ELK,還有現在比較火的Loki,(當然還有很多其他解決方案,比如Splunk、Datadog等),那我們這個小網站,小體量,必然是選擇Loki來做。
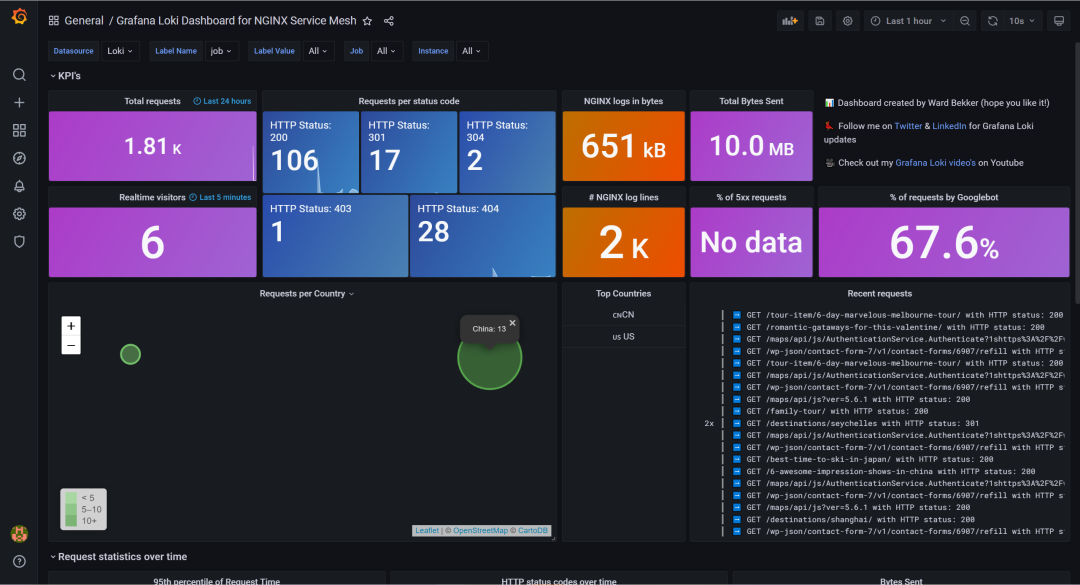
所以這次就采用 Nginx+Promtail+Loki+Grafana 來做一個簡單的Nginx日志展示
Nginx的安裝不多說,Promtail和Loki都選用二進制的方式進行安裝,直接下載對應版本的二進制文件,解壓后指定配置文件啟動即可。
其中promtail配置文件如下配置:
server:http_listen_port: 9080grpc_listen_port: 0positions:filename: /tmp/positions.yamlclients:- url: http://localhost:3100/loki/api/v1/pushscrape_configs:
- job_name: nginxpipeline_stages:- replace:expression: '(?:[0-9]{1,3}\.){3}([0-9]{1,3})'replace: '***'static_configs:- targets:- localhostlabels:job: nginx_access_loghost: expatsxxxxsagent: promtail__path__: /var/log/nginx/expatshxxxxs.access.log
日志收集工作完成后,在Nginx中,需要修改日志格式,修改Nginx的日志格式為Json格式,配置如下:
log_format json_analytics escape=json '{''"msec": "$msec", ' # request unixtime in seconds with a milliseconds resolution'"connection": "$connection", ' # connection serial number'"connection_requests": "$connection_requests", ' # number of requests made in connection'"pid": "$pid", ' # process pid'"request_id": "$request_id", ' # the unique request id'"request_length": "$request_length", ' # request length (including headers and body)'"remote_addr": "$remote_addr", ' # client IP'"remote_user": "$remote_user", ' # client HTTP username'"remote_port": "$remote_port", ' # client port


)


)


)