效果圖:
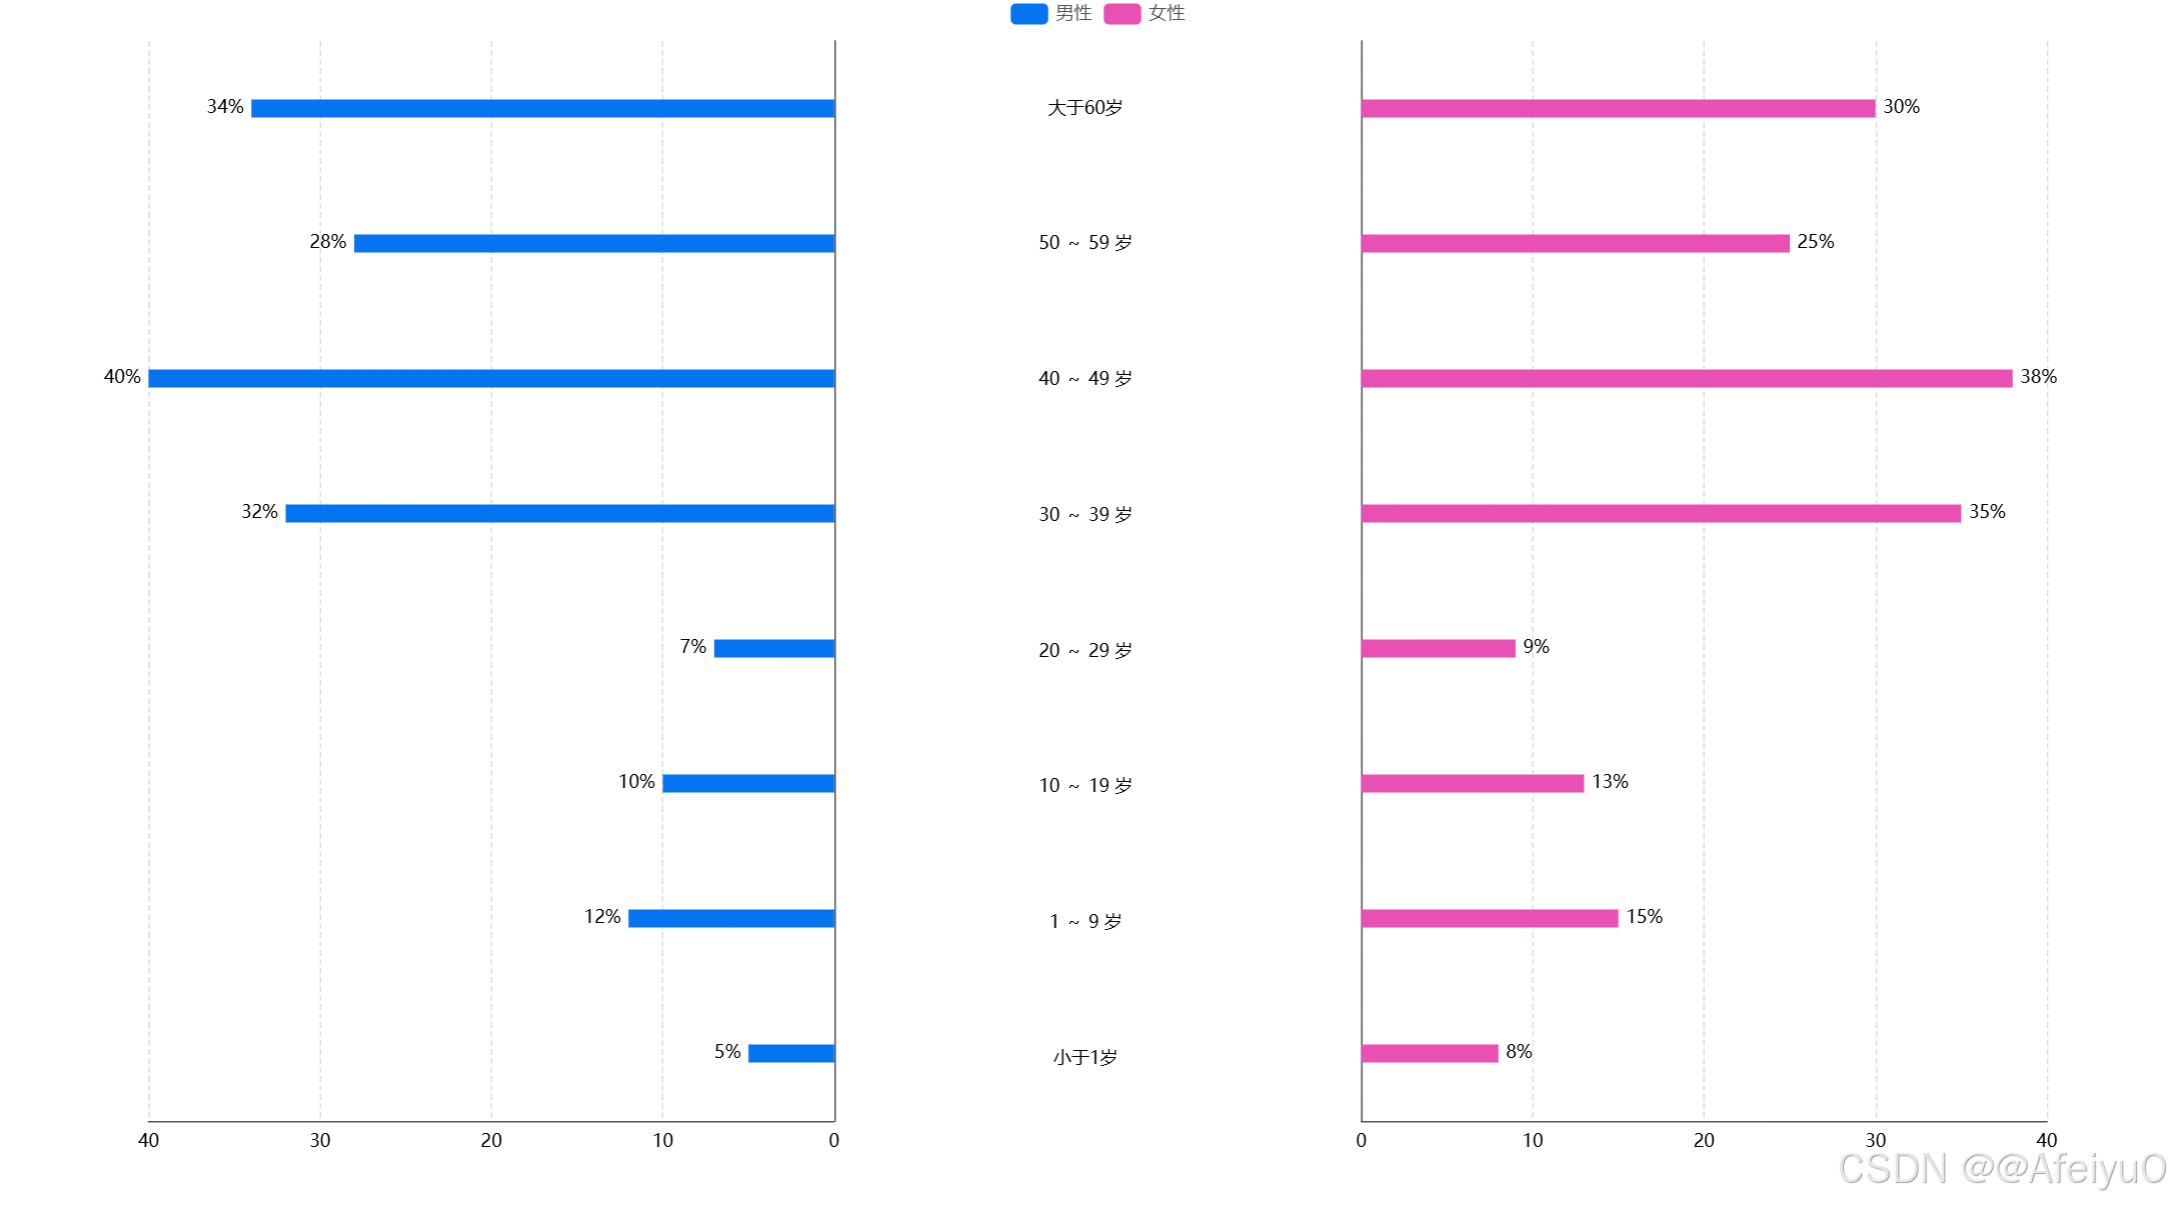
需求:男女年齡段占比
<template><div class="go-ClassifyBar01"><v-chartref="vChartRef":option="option"style="width: 100%; height: 800px"></v-chart></div>
</template><script setup lang="ts">
import { ref, reactive, watch, onMounted } from "vue";
import VChart from "vue-echarts";
import { use } from "echarts/core";
import { CanvasRenderer } from "echarts/renderers";
import { BarChart } from "echarts/charts";
import {GridComponent,TooltipComponent,LegendComponent,
} from "echarts/components";use([CanvasRenderer,BarChart,GridComponent,TooltipComponent,LegendComponent,
]);// 獲取圖表實例
const vChartRef = ref();// 定義數據類型
interface ChartDataItem {name: string;data: Array<{value: number;label: string;}>;
}// 模擬接口數據數組
const chartData = ref<ChartDataItem[]>([{name: "男性",data: [{ value: 5, label: "小于1歲" },{ value: 12, label: "1 ~ 9 歲" },{ value: 10, label: "10 ~ 19 歲" },{ value: 7, label: "20 ~ 29 歲" },{ value: 32, label: "30 ~ 39 歲" },{ value: 40, label: "40 ~ 49 歲" },{ value: 28, label: "50 ~ 59 歲" },{ value: 34, label: "大于60歲" },],},{name: "女性",data: [{ value: 8, label: "小于1歲" },{ value: 15, label: "1 ~ 9 歲" },{ value: 13, label: "10 ~ 19 歲" },{ value: 9, label: "20 ~ 29 歲" },{ value: 35, label: "30 ~ 39 歲" },{ value: 38, label: "40 ~ 49 歲" },{ value: 25, label: "50 ~ 59 歲" },{ value: 30, label: "大于60歲" },],},
]);const option = reactive({// 圖位置定制grid: [{left: "12%",width: "28%",containLabel: true,bottom: 30,top: 30,},{left: "50%",width: "0%",bottom: 46,top: 30,},{right: "12%",width: "28%",containLabel: true,bottom: 30,top: 30,},],legend: {show: true,left: "center",top: 0,data: <any>[],},xAxis: [{type: "value",inverse: true,axisLabel: {show: true,color: "#000",margin: 8,},axisLine: {show: true,},axisTick: {show: false,},splitLine: {show: true,lineStyle: {type: "dashed",},},},{gridIndex: 1,show: true,splitLine: {show: true,lineStyle: {type: "dashed",},},axisLabel: {show: true,color: "#000",margin: 0,},},{gridIndex: 2,type: "value",axisLabel: {show: true,color: "#000",margin: 8,},axisLine: {show: true,},axisTick: {show: false,},splitLine: {show: true,lineStyle: {type: "dashed",},},},],yAxis: [{type: "category",position: "right",inverse: false,axisLine: {show: true,},axisTick: {show: false,},axisLabel: {show: false,},data: <any>[],},{type: "category",inverse: false,gridIndex: 1,position: "center",axisLabel: {align: "center",padding: [8, 0, 0, 0],fontSize: 12,color: "#000",},axisLine: {show: false,},axisTick: {show: false,},data: <any>[],},{type: "category",inverse: false,gridIndex: 2,position: "left",axisLabel: {show: false,},axisLine: {show: true,},axisTick: {show: false,},data: <any>[],},],series: [] as any[],
});// 更新圖表數據
const updateChart = () => {if (!chartData.value.length) return;// 更新圖例數據option.legend.data = chartData.value.map((item) => item.name);// 提取y軸標簽(年齡段)const yAxisData = chartData.value[0].data.map((item) => item.label);// 更新y軸數據option.yAxis[0].data = yAxisData;option.yAxis[1].data = yAxisData;option.yAxis[2].data = yAxisData;// 動態生成系列數據option.series = chartData.value.map((item, index) => {if (index === 0) {return {type: "bar",name: item.name,barWidth: 12,label: {show: true,position: "left",color: "#000",fontWeight: "BoldMT",fontFamily: "Arial-BoldMT",fontSize: 14,formatter: "{c}%",},itemStyle: {color: "#0674F1FF",borderRadius: 0,},data: item.data.map((d) => d.value),};} else {return {xAxisIndex: 2,yAxisIndex: 2,type: "bar",name: item.name,barWidth: 12,label: {show: true,position: "right",color: "#000",fontWeight: "BoldMT",fontFamily: "Arial-BoldMT",fontSize: 14,formatter: "{c}%",},itemStyle: {color: "#E851B3FF",borderRadius: 0,},data: item.data.map((d) => d.value),};}});
};// 監聽數據變化
watch(chartData,() => {updateChart();},{ immediate: true }
);// 組件掛載后更新圖表
onMounted(() => {updateChart();
});
</script><style scoped>
.go-ClassifyBar01 {width: 100%;height: 100%;
}
</style>


:代價函數的意義)


變換記錄)