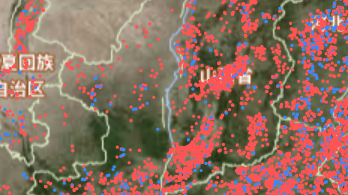
如圖所示,是全國的數據,截圖是部分數據
先安裝:
npm install leaflet
npm install leaflet.vectorgrid
如果是其余的框架直接用就行:
import * as L from 'leaflet';
import 'leaflet.vectorgrid';
我用的是angular,所以是ts中聲明:
declare module 'leaflet.vectorgrid' {export function protobuf(url: string, options?: any): any;
}
調用:
const vectorTileLayer = (L as any).vectorGrid.protobuf('http://你的服務地址/{z}/{x}/{y}.pbf', {vectorTileLayerStyles: {nf: {fill: true,fillColor: '#3388ff',fillOpacity: 0.6,color: 'red',weight: 2}},pane: 'overlayPane',interactive: true //這個必須寫才能點擊彈窗事件
});vectorTileLayer.addTo(map);
如果樣式需要動態設置顏色:
nf: (feature) => ({color: feature.properties.status === '未處理' ? '#ff0000' : '#00ff00',weight: 2})如果需要點擊彈窗:
vectorTileLayer.on('click', (event) => {// 獲取Leaflet點擊位置const latlng = event.latlng;const longitude = latlng.lng;const latitude = latlng.lat;// 創建Leaflet標記點this.point = L.marker([latitude, longitude], {icon: L.icon({iconUrl: 'assets/img/marker-icon.png',iconSize: [10, 10],iconAnchor: [5, 5]})}).addTo(this.markersLayer);//綁定彈窗事件this.point.bindPopup(`<div style="padding: 10px; border-radius: 6px; min-width: 250px; text-align: center;"><div style="color: #1890ff; margin-bottom: 8px;">加載中...</div><div style="font-size: 12px; color: #666;">正在獲取詳細信息</div></div>`);this.point.openPopup();
});處理)


)


)


)
