目錄
一.環境準備
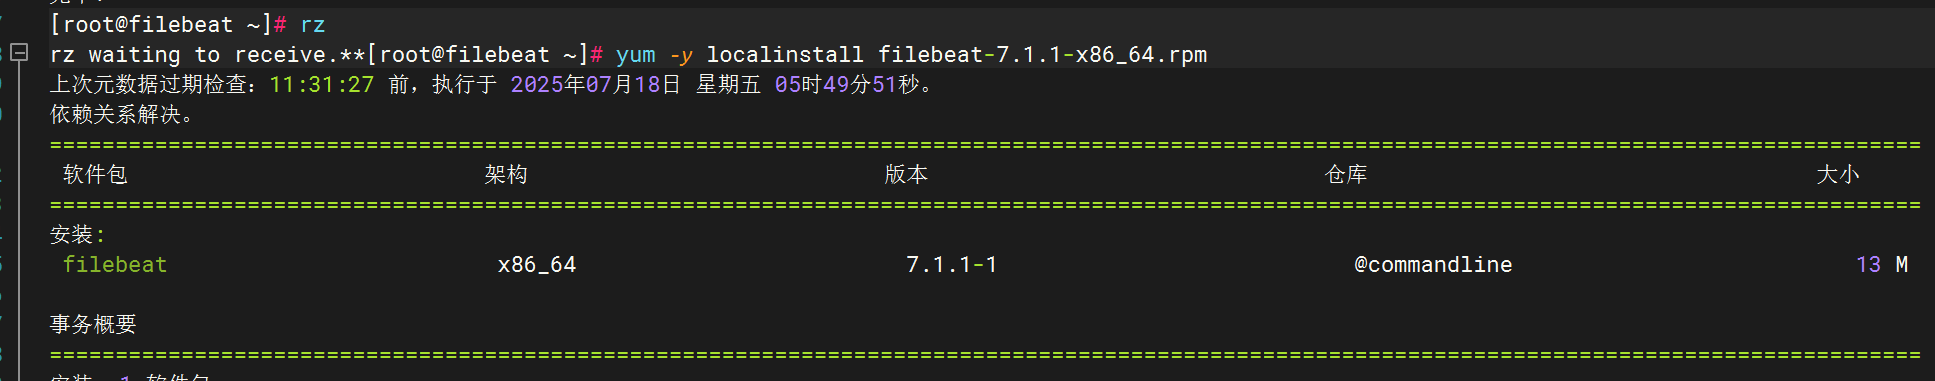
試驗機安裝
修改文件配置
二.收集測試機(test)日志
配置pipline文件
配置filebeat配置文件
三.收集測試機nginx日志
下載安裝nginx
修改filebeat文件
修改pipline文件
四.收集網絡服務模塊日志
1.DHCP
下載dhcp
修改配置文件?
修改dhcp配置文件
配置logstash文件?
配置filebeat文件?
重啟應用查看kibana
2.DNS
修改配置文件(/etc/named.conf)
創建日志目錄并賦權?
?編輯配置filebeat文件
?編輯?配置logstash文件
全部啟動后在kibana查看日志
3.SSH
配置文件
Filebeat配置
Logstash配置
重啟應用
檢查kibana
4.Rsync
配置rsync
Filebeat配置
logstash配置
五.收集Tomcat服務日志
1.安裝tomcat
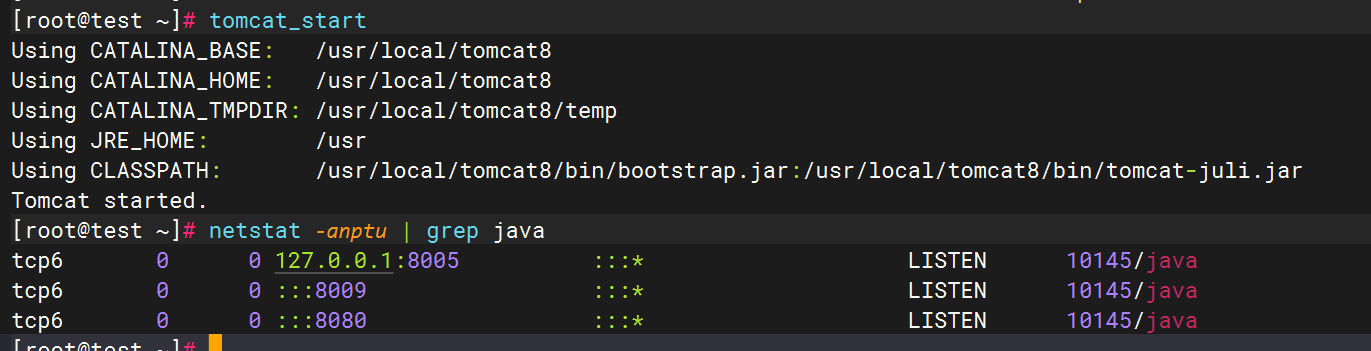
2.Tomcat啟動驗證
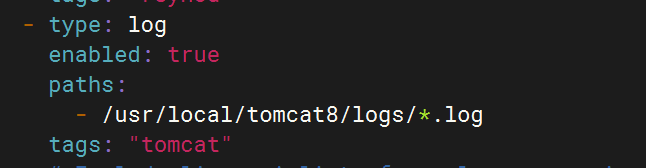
3.配置filebeat文件
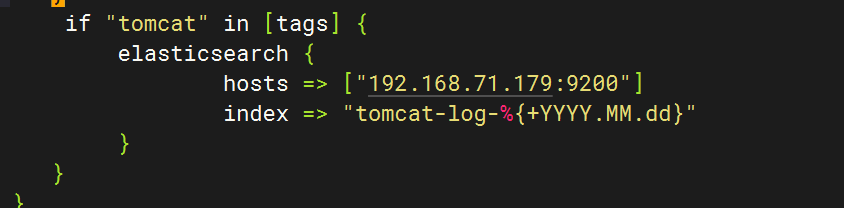
4.配置logstash文件
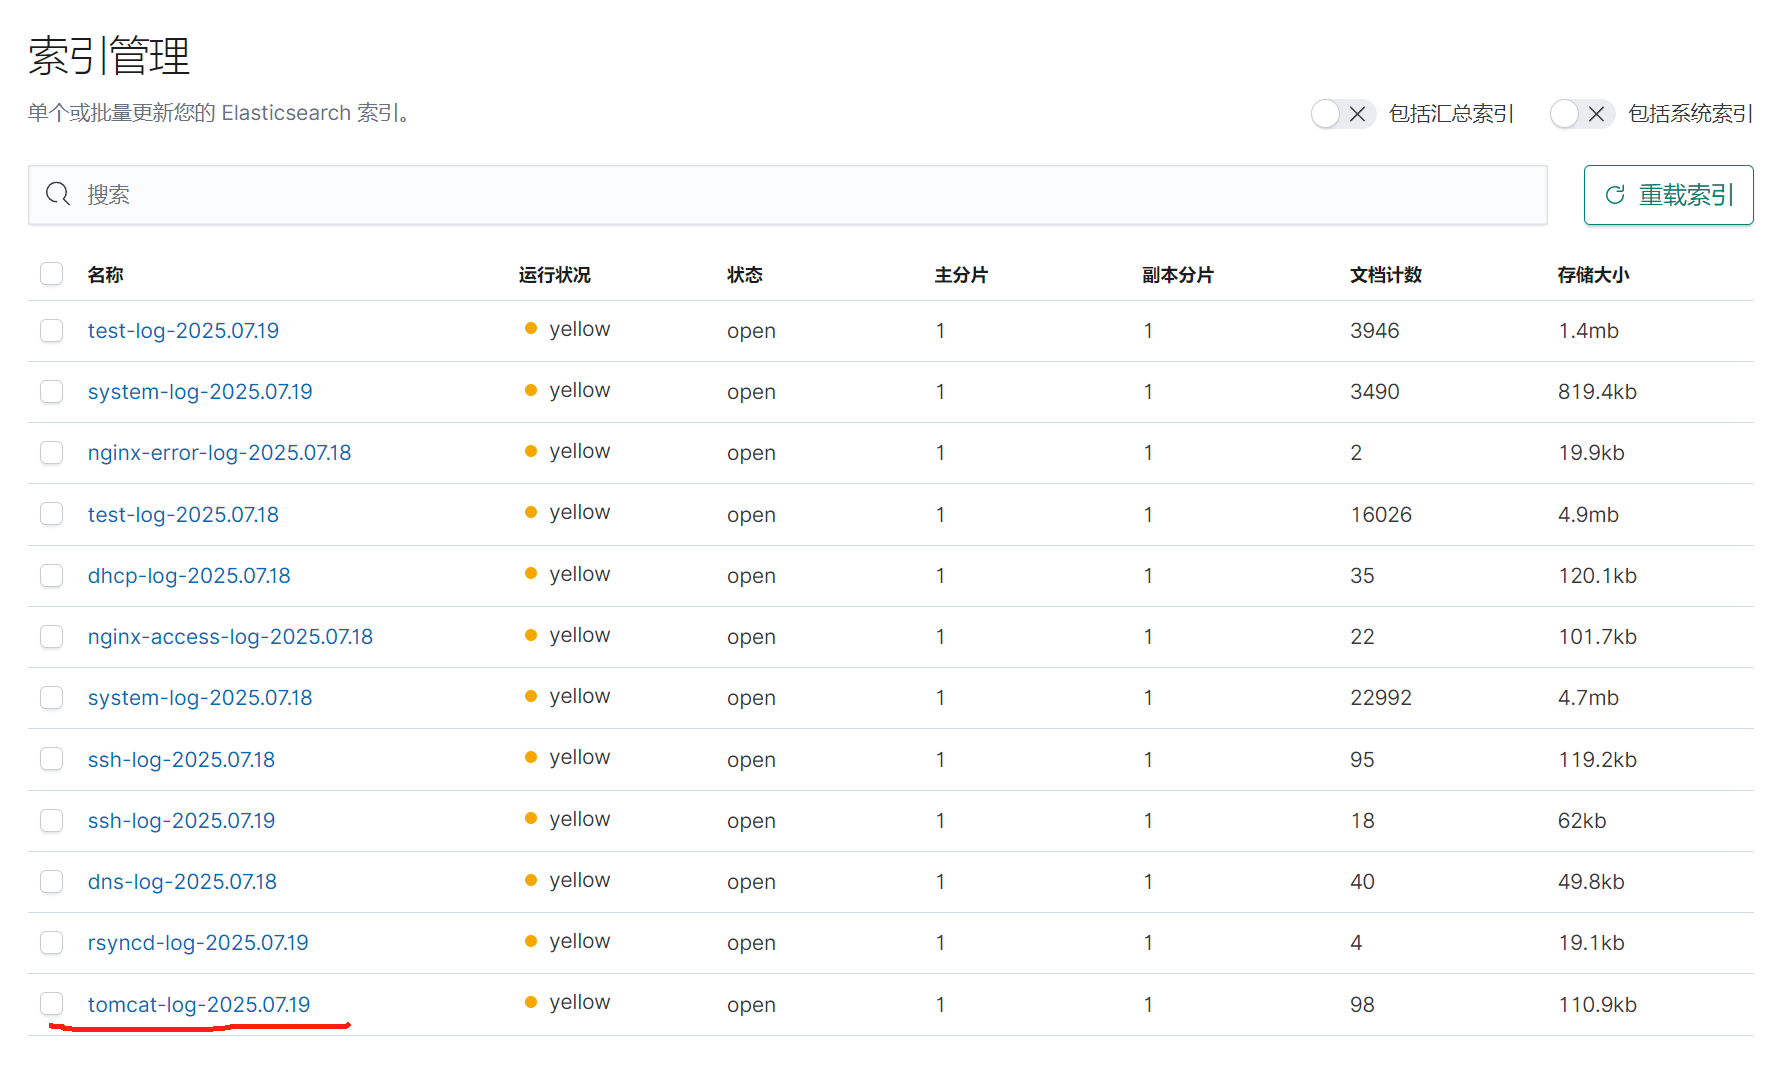
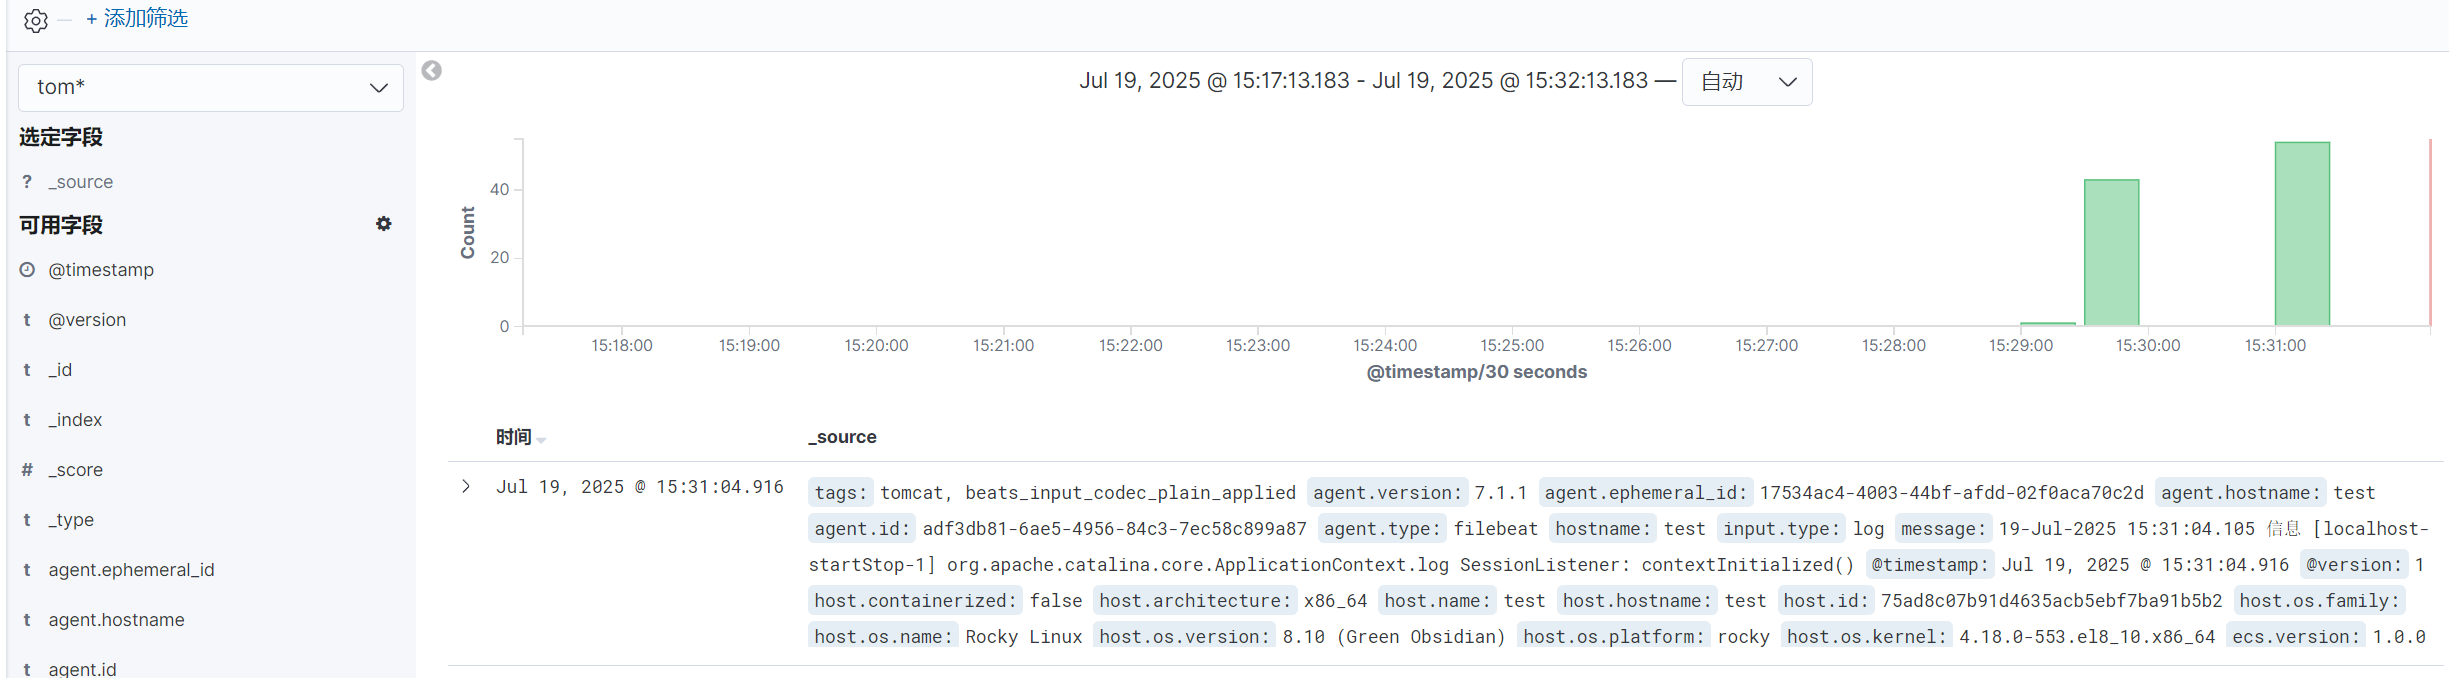
5.重啟服務查看kibana
六.MySQL數據庫日志收集
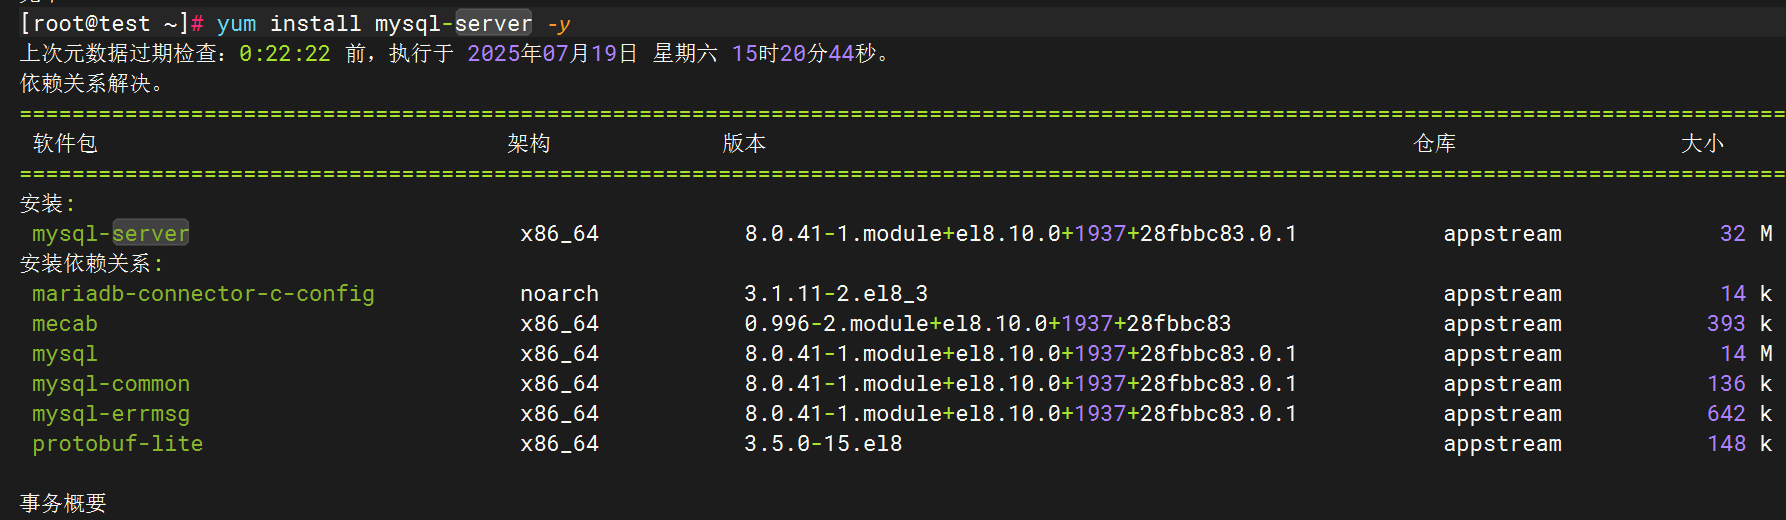
1.安裝MySQL
2.編輯MySQL日志生成配置
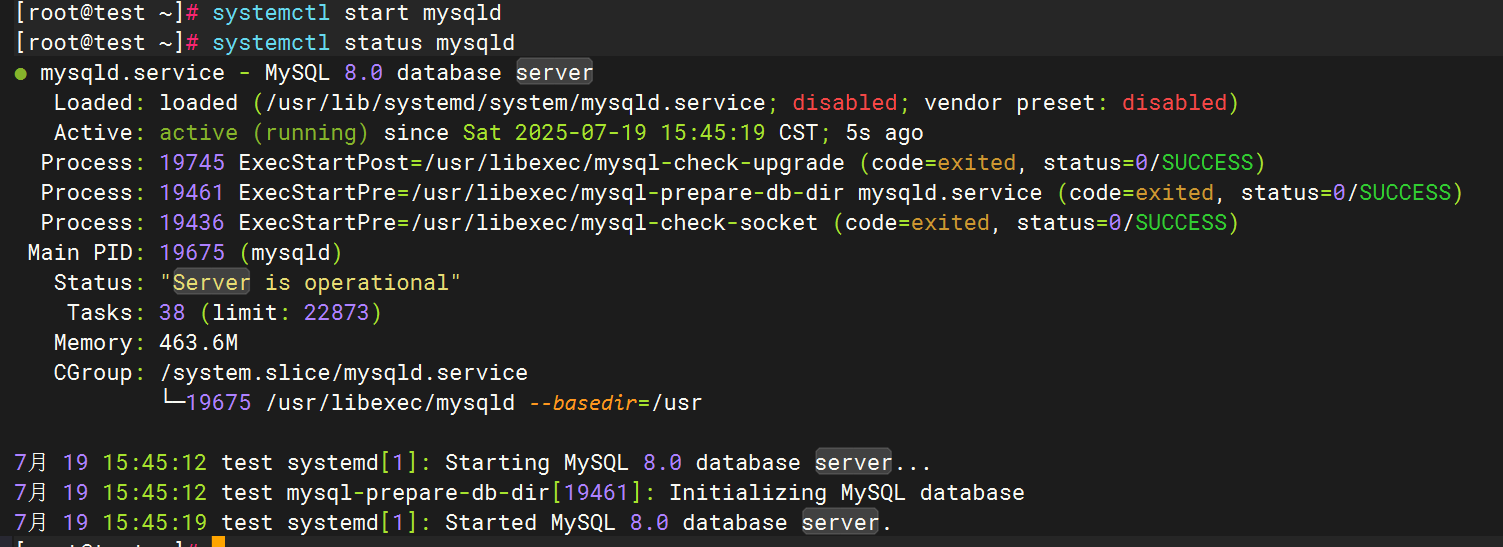
3.啟動mysql并驗證日志生成
4.配置filebeat文件
5.配置logstash文件
6.重啟服務查看kibana
七.NFS日志收集
1.安裝NFS
2.啟用NFS日志
驗證配置:
3.配置filebeat文件
4.配置logstash文件
5.重啟服務查看kibana
八.Redis數據庫日志收集
1.安裝redis數據庫
2.Redis日志生成配置
3.配置filebeat文件
4.配置logstash文件
5.重啟服務查看kibana
九.LVS日志收集
1.下載安裝ipvsadm
2.配置rsyslog文件
2.配置filebeat文件
3.配置logstash文件
十.Haproxy日志收集
1.安裝haproxy
2.配置haproxy文件
3.配置Rsyslog收集HAProxy日志
4.修改filebeat文件
5.修改logstash文件
6.重啟全部服務,登錄kibana查看日志
十一.Keepalived日志收集
1.安裝keepalived
2.配置keepalived日志輸出
3.測試日志生成
4.修改filebeat文件
5.修改logstash文件
6.重啟全部服務,檢查kibana
十二.匯總
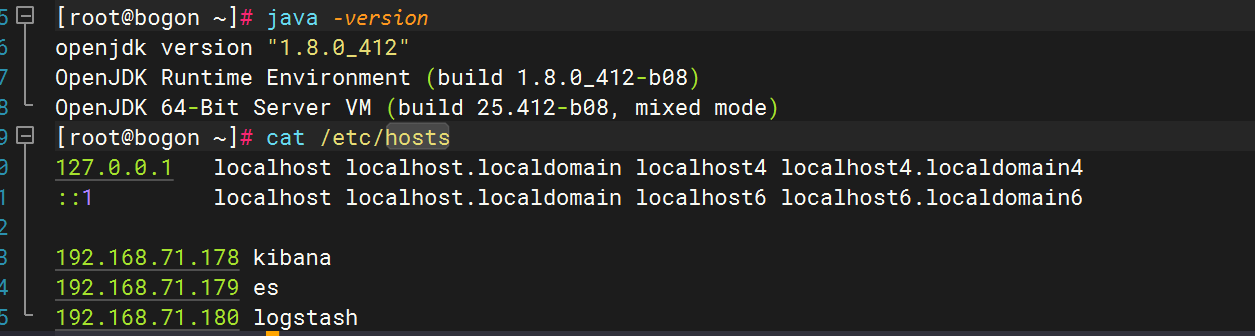
一.環境準備
| 角色 | 主機名 | IP地址 |
|---|---|---|
| 圖形展示 | kibana | 192.168.71.178 |
| 日志存儲 | es | 192.168.71.179 |
| 日志收集分析 | lostash | 192.168.71.180 |
| 日志采集 | test | 192.168.71.181 |
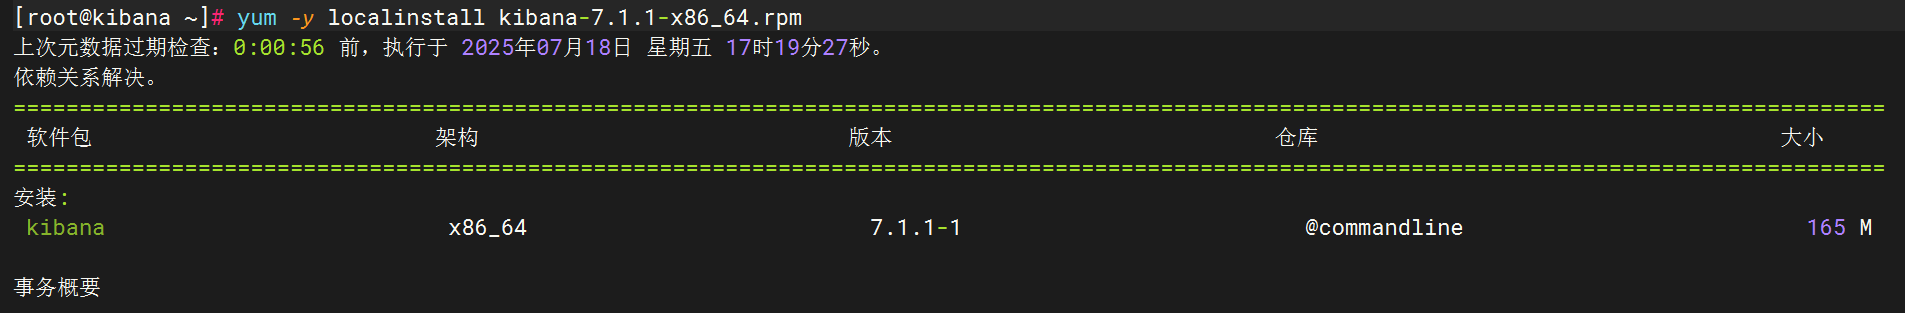
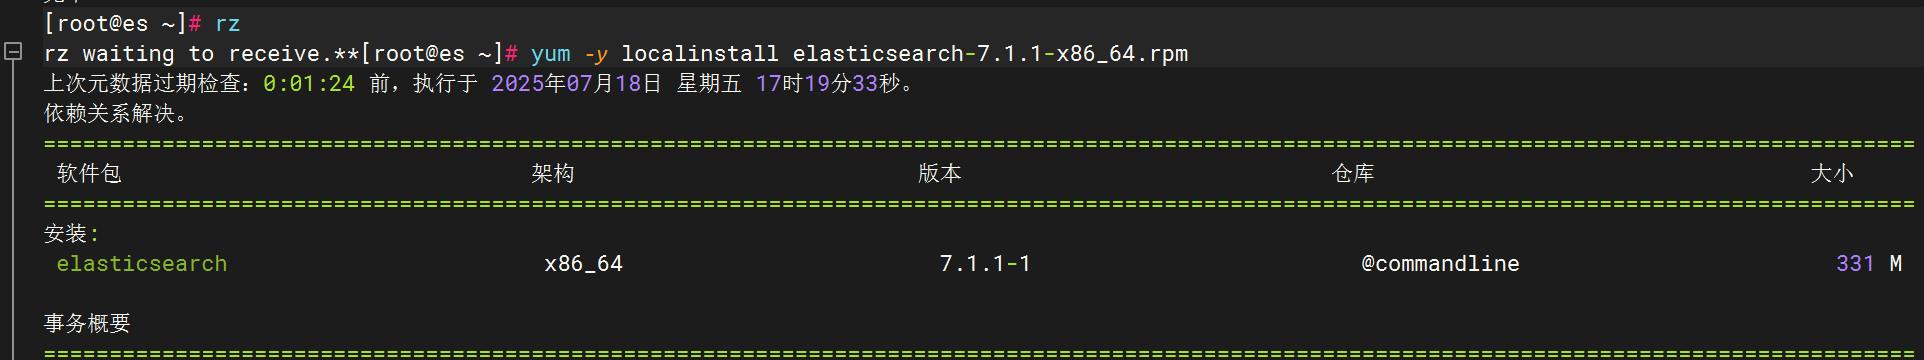
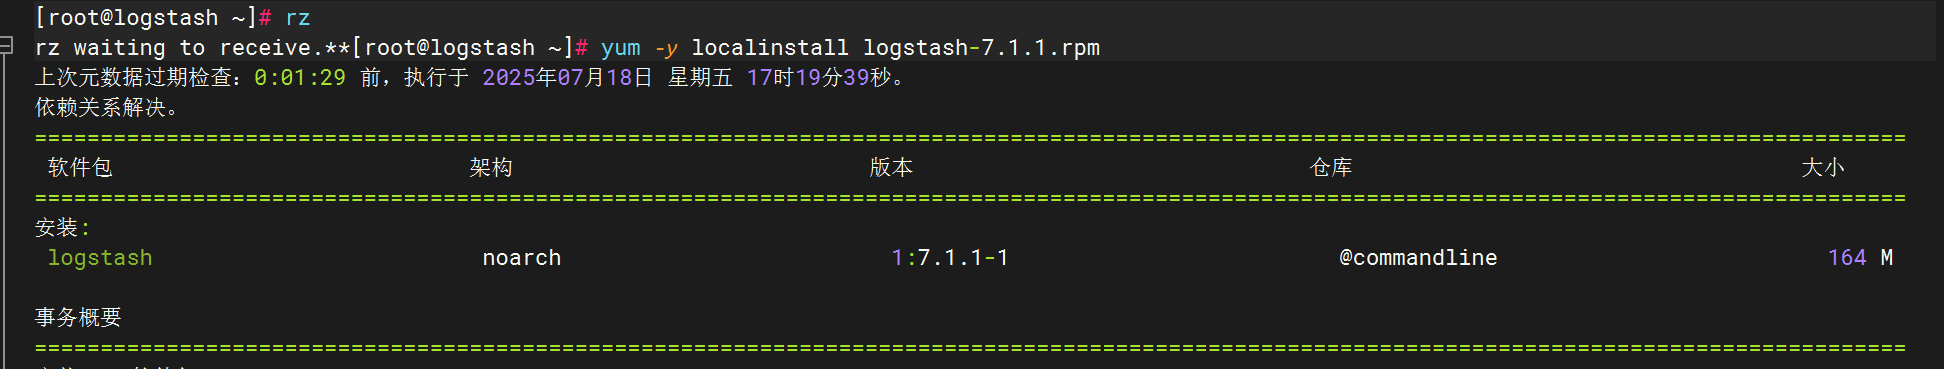
試驗機安裝
分別安裝elasticsearch,logstash,kibana,filebeat
優化logstash命令
ln -s /usr/share/logstash/bin/logstash /usr/local/bin/
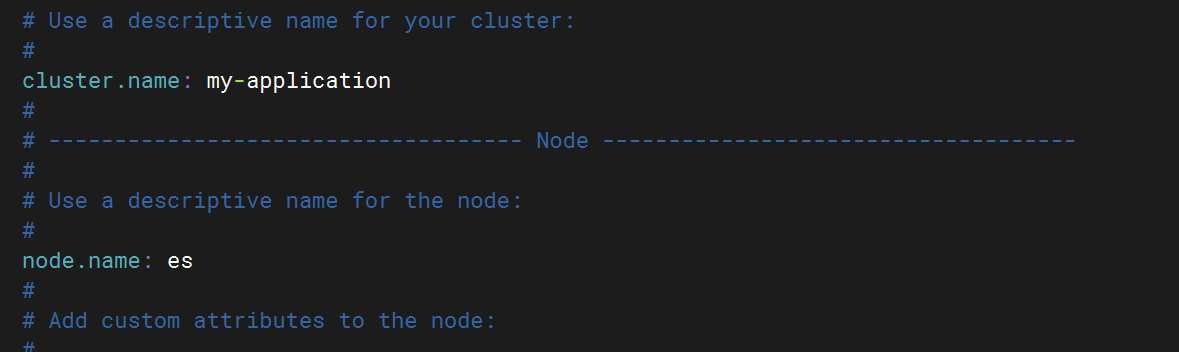
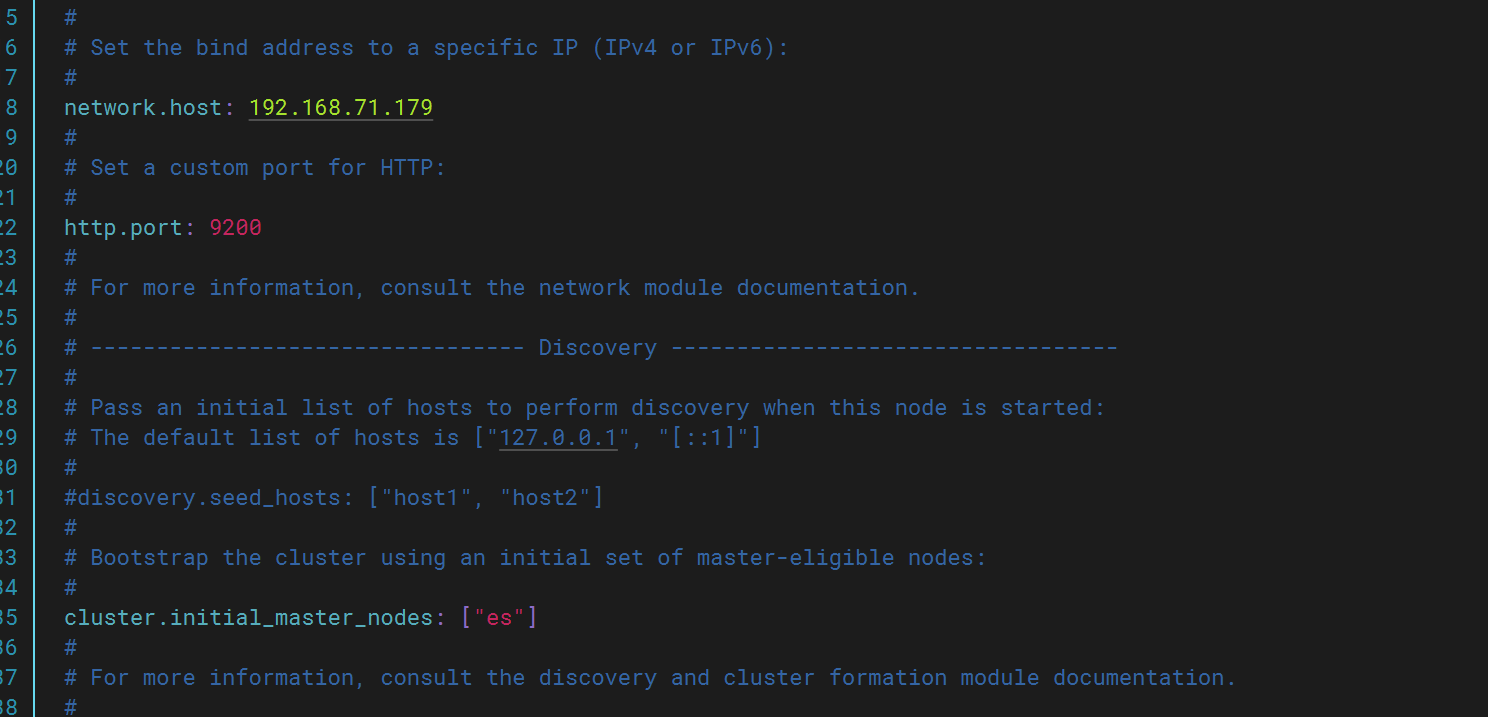
修改文件配置
elasticsearch:
kibana:
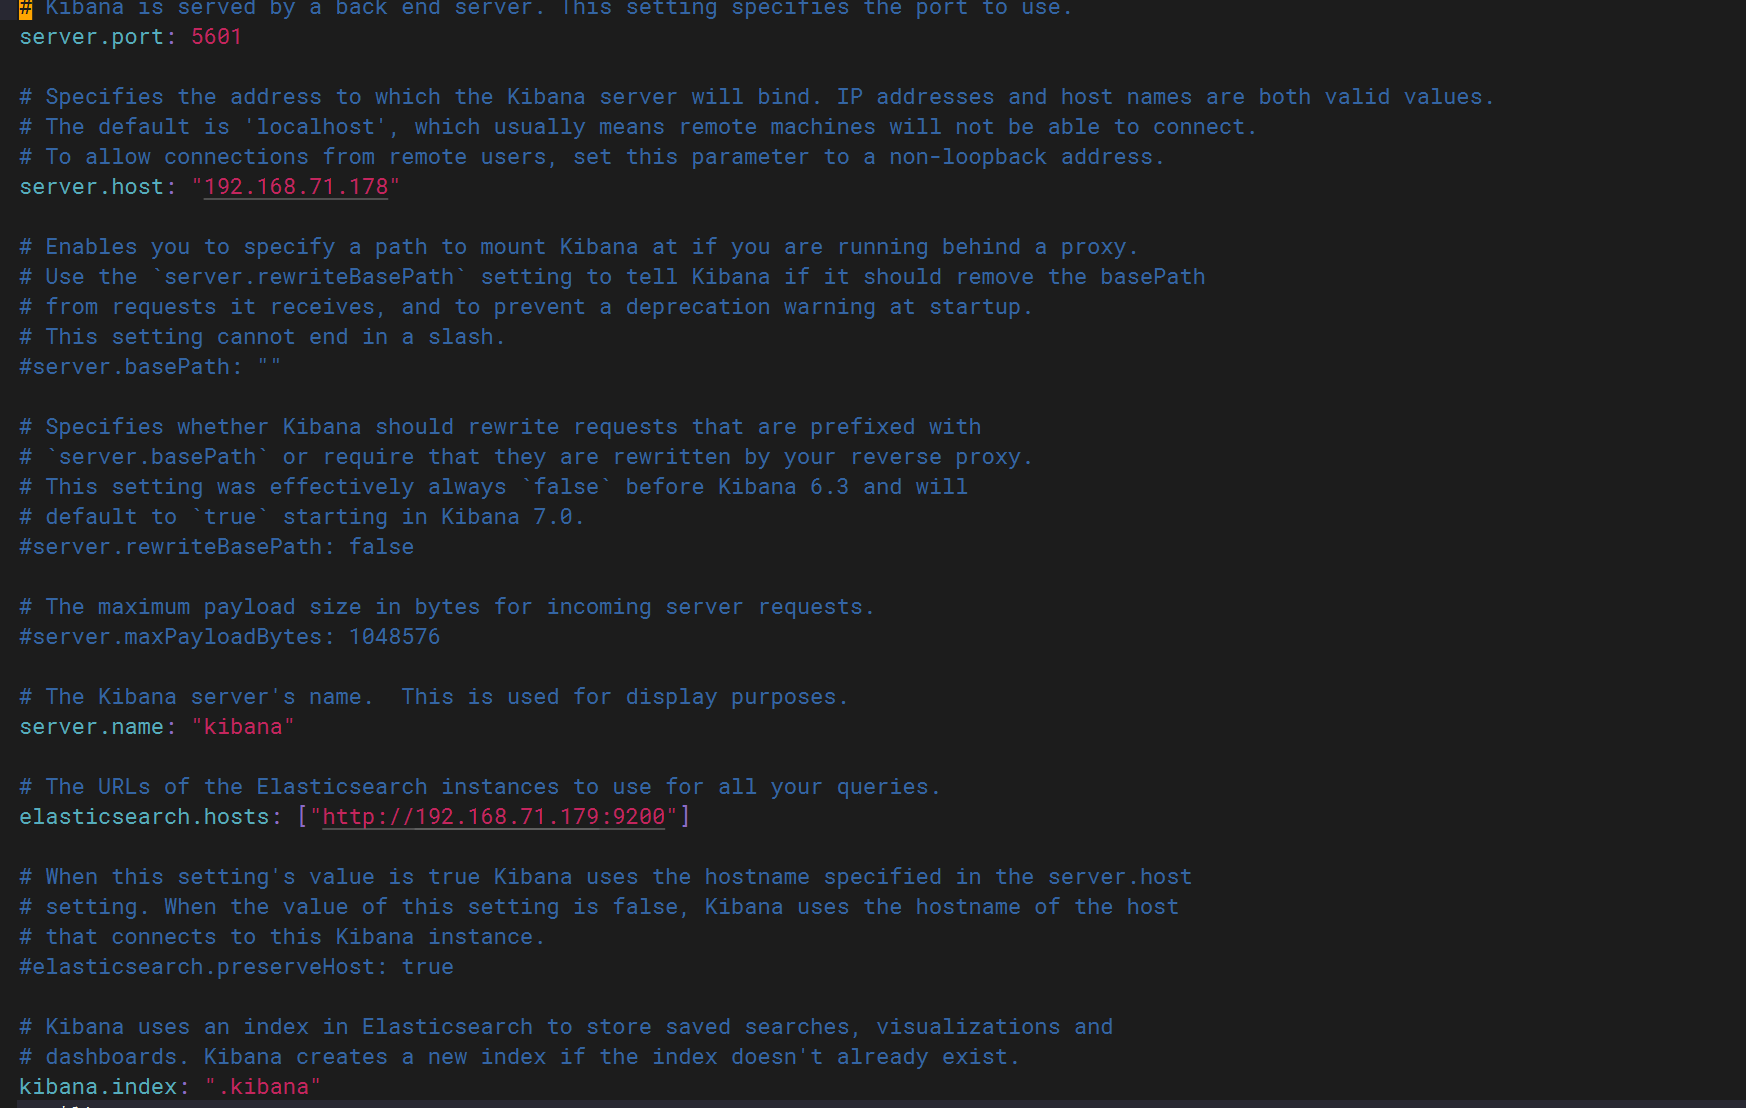

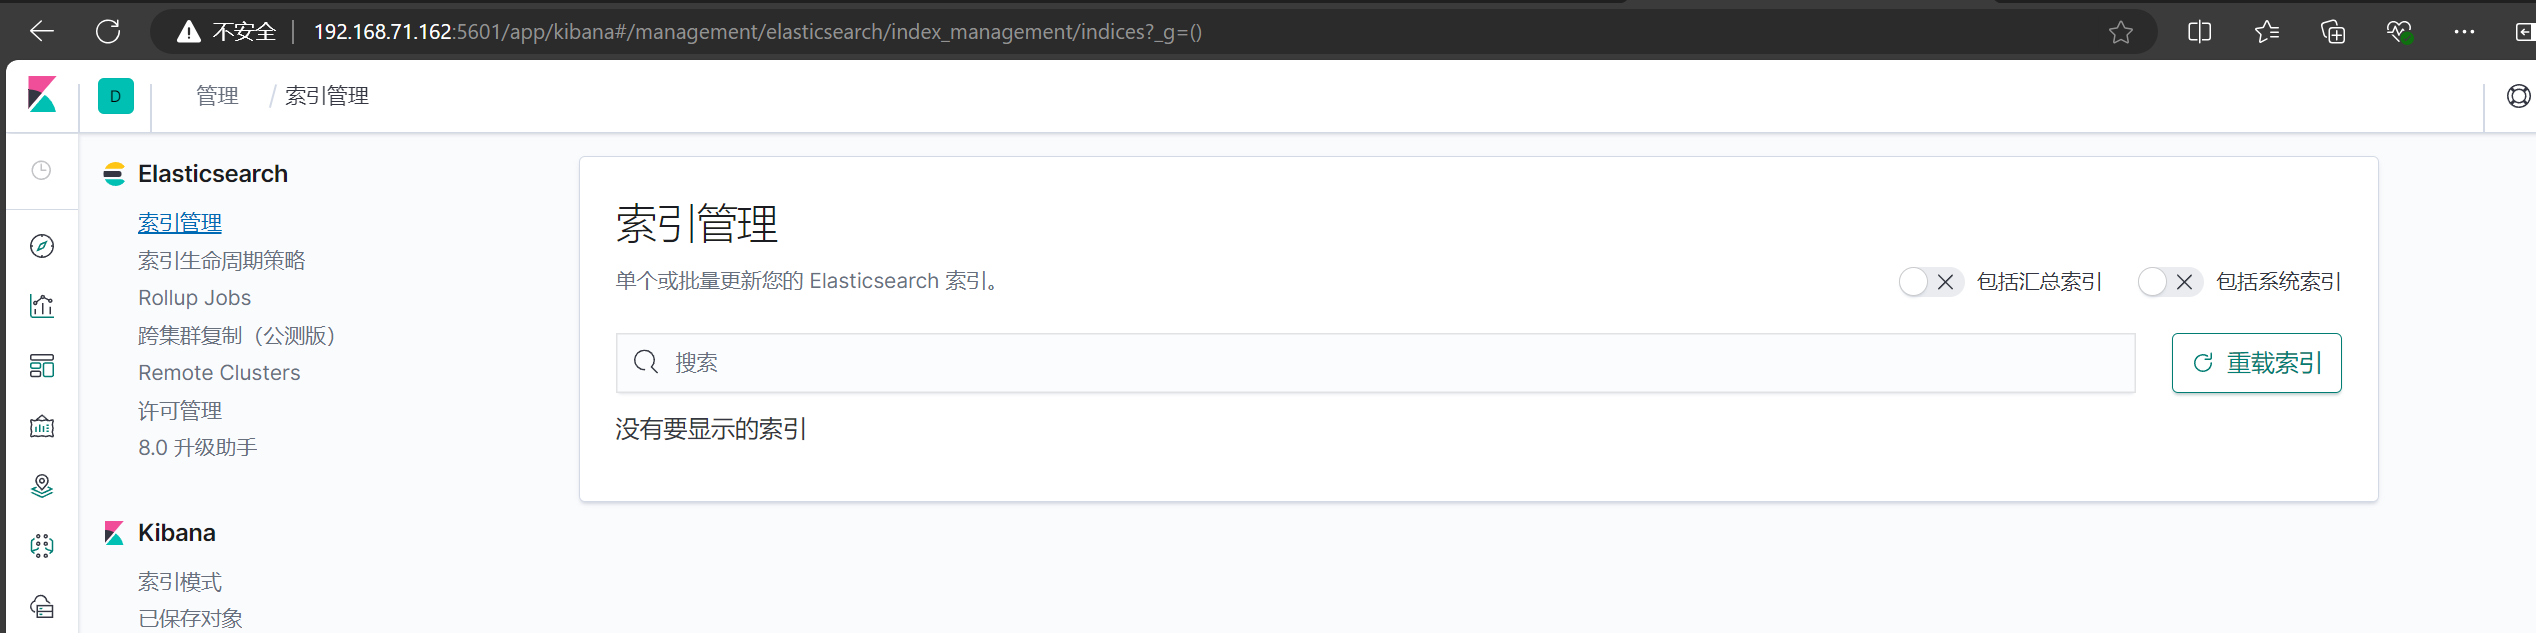
可以正常登錄5601端口?
編寫pipline文件
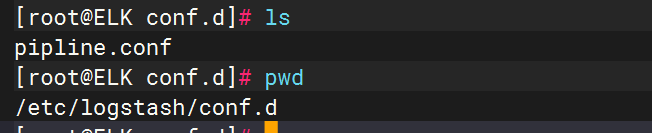
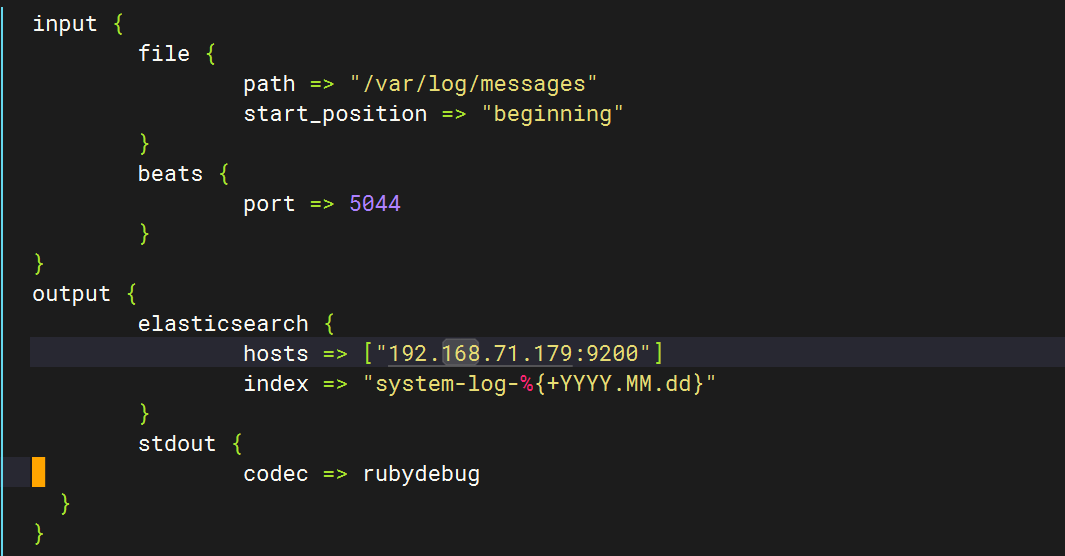
?初始文件內容
input {file {path => "/var/log/messages"start_position => "beginning"}
}
output {elasticsearch {hosts => ["http://192.168.71.179:9200"]index => "system-log-%{+YYYY.MM.dd}"}stdout {codec => rubydebug}
}
運行logstash獲取日志,并在kibana查看

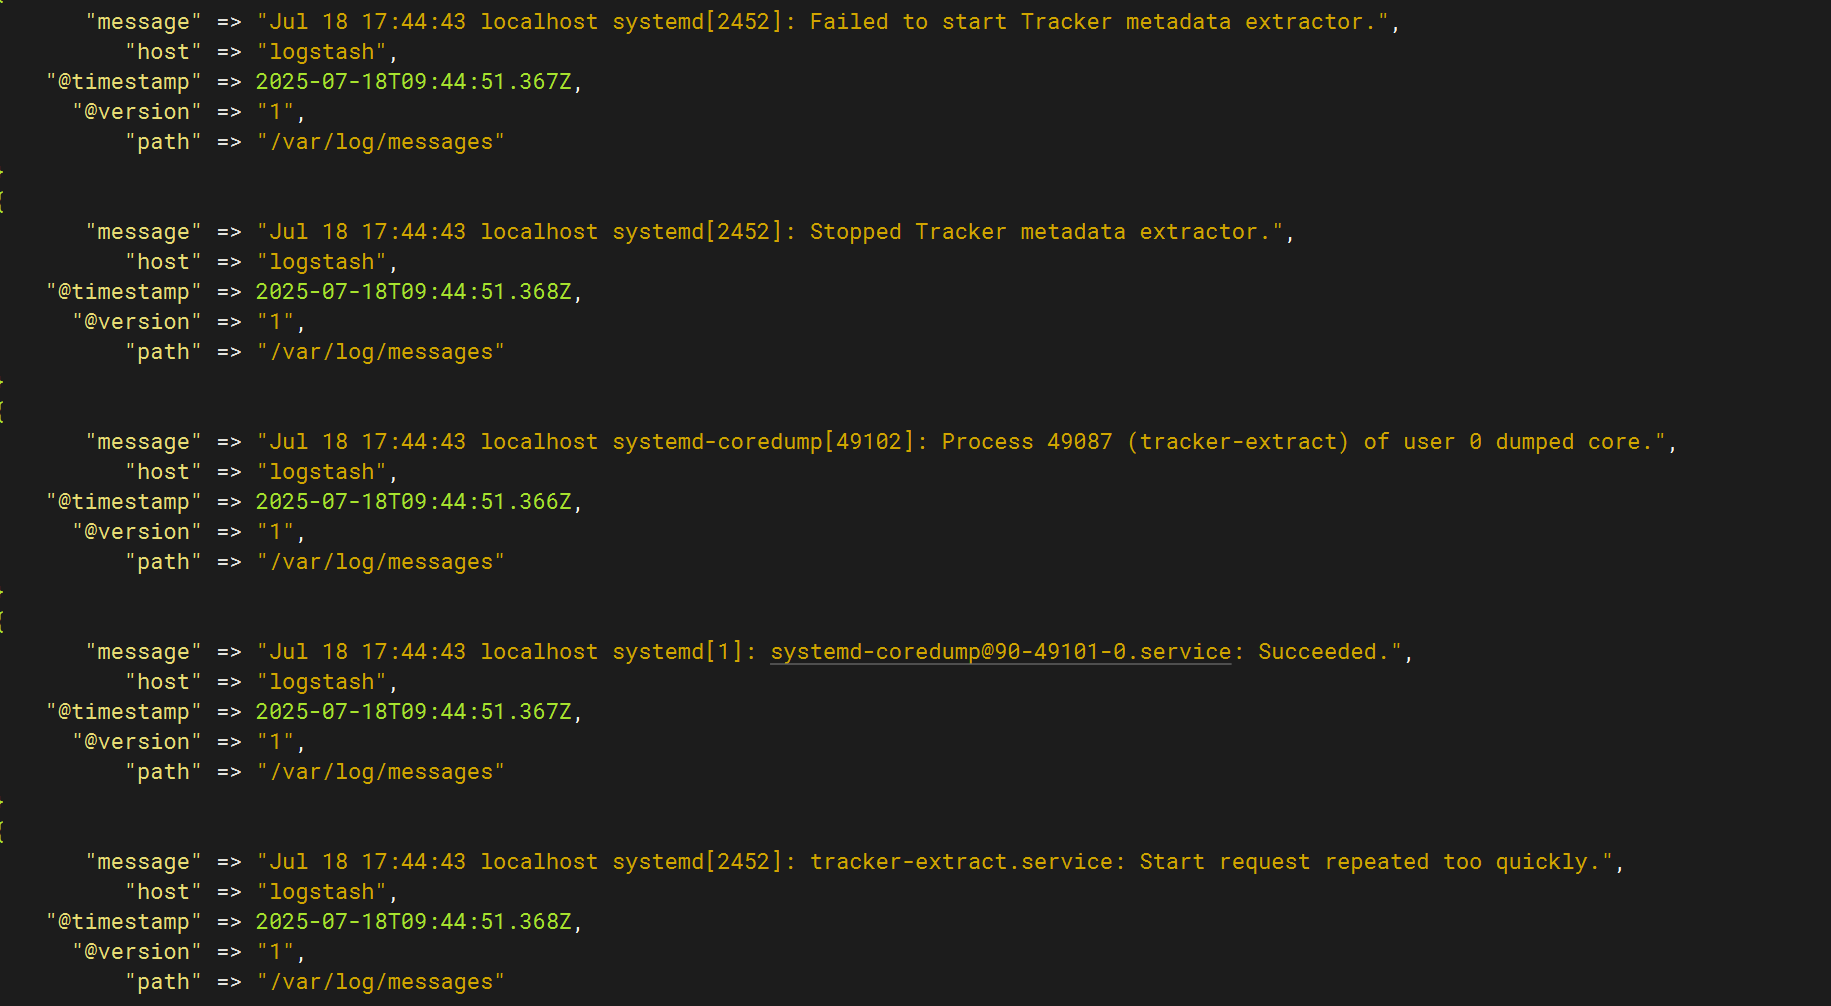
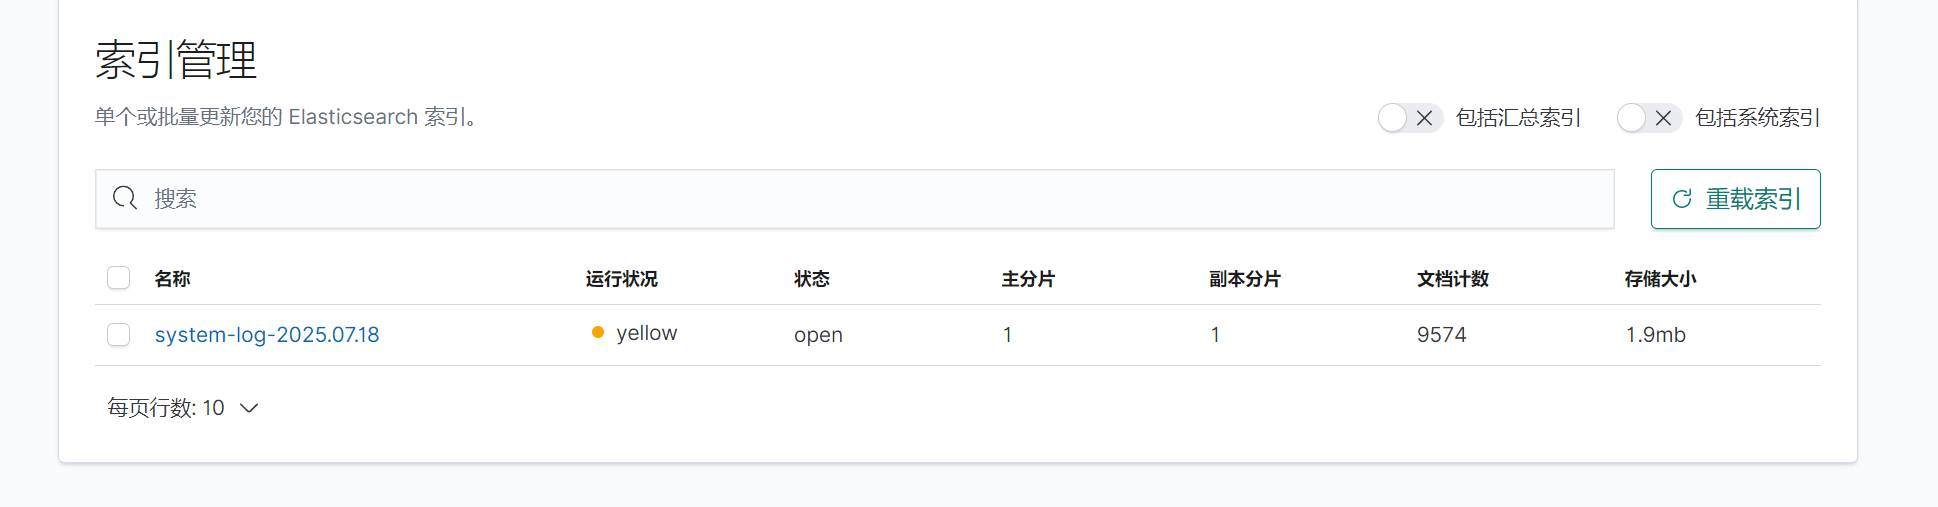
成功運行,并且成功獲取日志
二.收集測試機(test)日志
配置pipline文件
新加一個端口(未使用的都可以)
input {file {path => "/var/log/messages"start_position => "beginning"}beats {port => 5044}
}
filter {if [host][name] {mutate { add_field => { "hostname" => "%{[host][name]}" } }}else if [agent][hostname] {mutate { add_field => { "hostname" => "%{[agent][hostname]}" } }}else {mutate { add_field => { "hostname" => "%{host}" } }}
}
output {if [hostname] == "logstash" {elasticsearch {hosts => ["192.168.71.179:9200"]index => "system-log-%{+YYYY.MM.dd}"}
}else if [hostname] == "test" {elasticsearch {hosts => ["192.168.71.179:9200"]index => "test-log-%{+YYYY.MM.dd}"}
}stdout {codec => rubydebug}
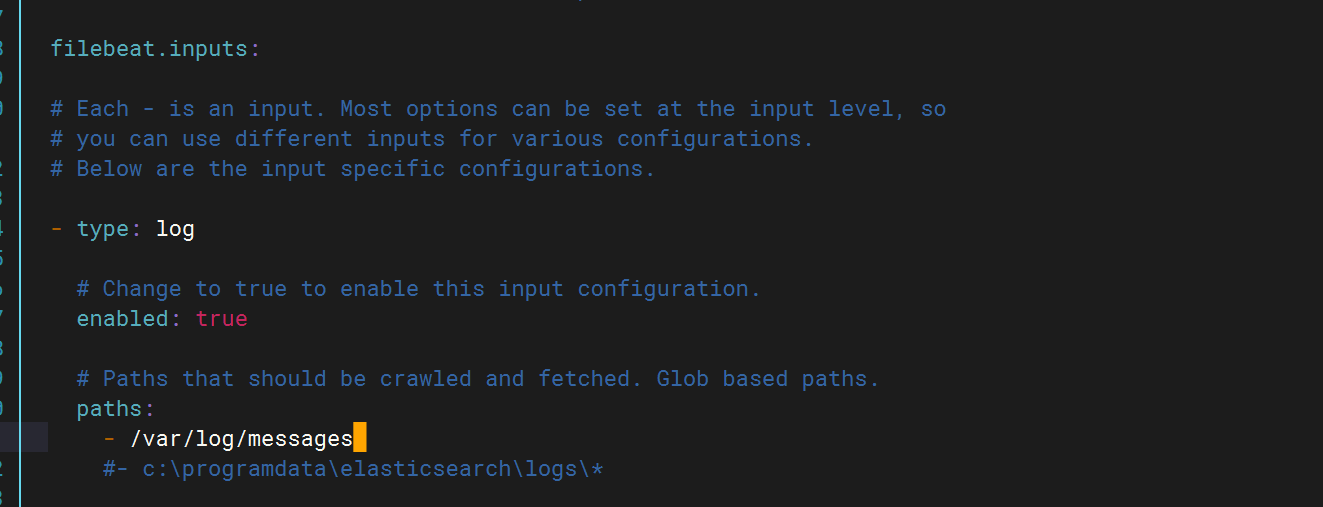
}配置filebeat配置文件
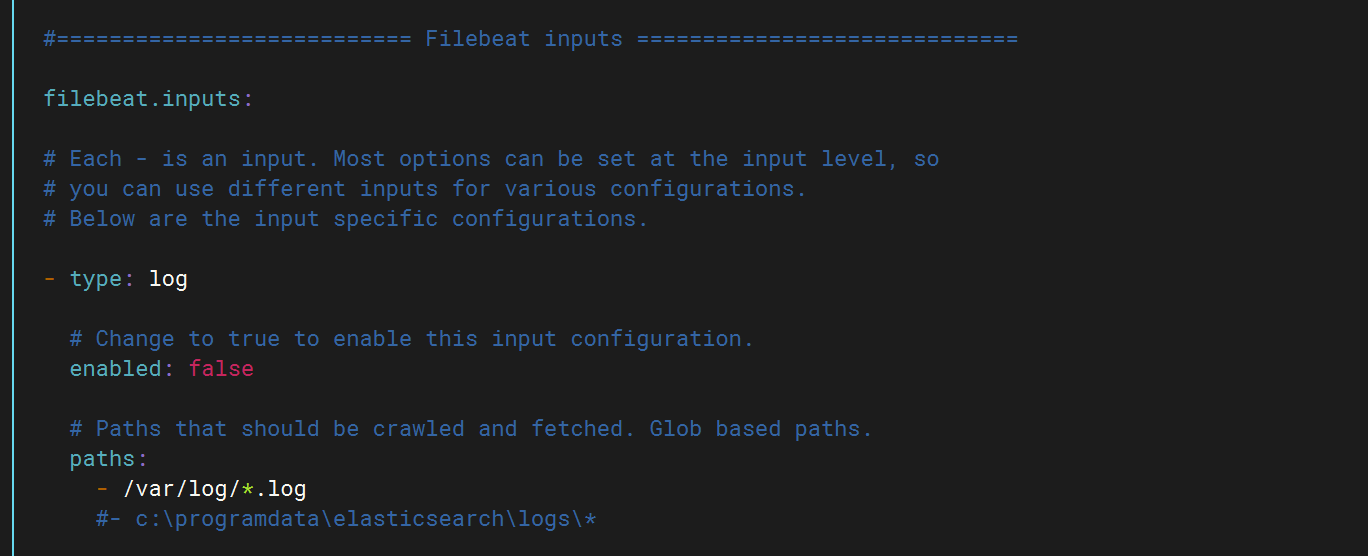
將false改為ture打開該功能,然后填寫日志路徑
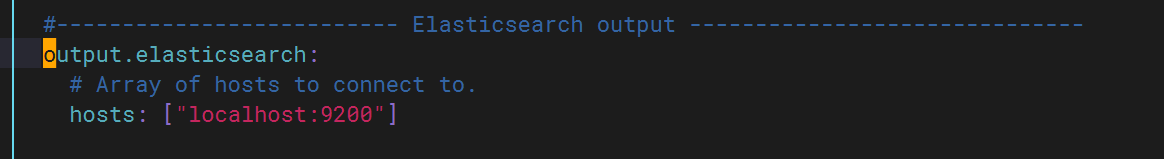
將ES注釋掉并打開logstash
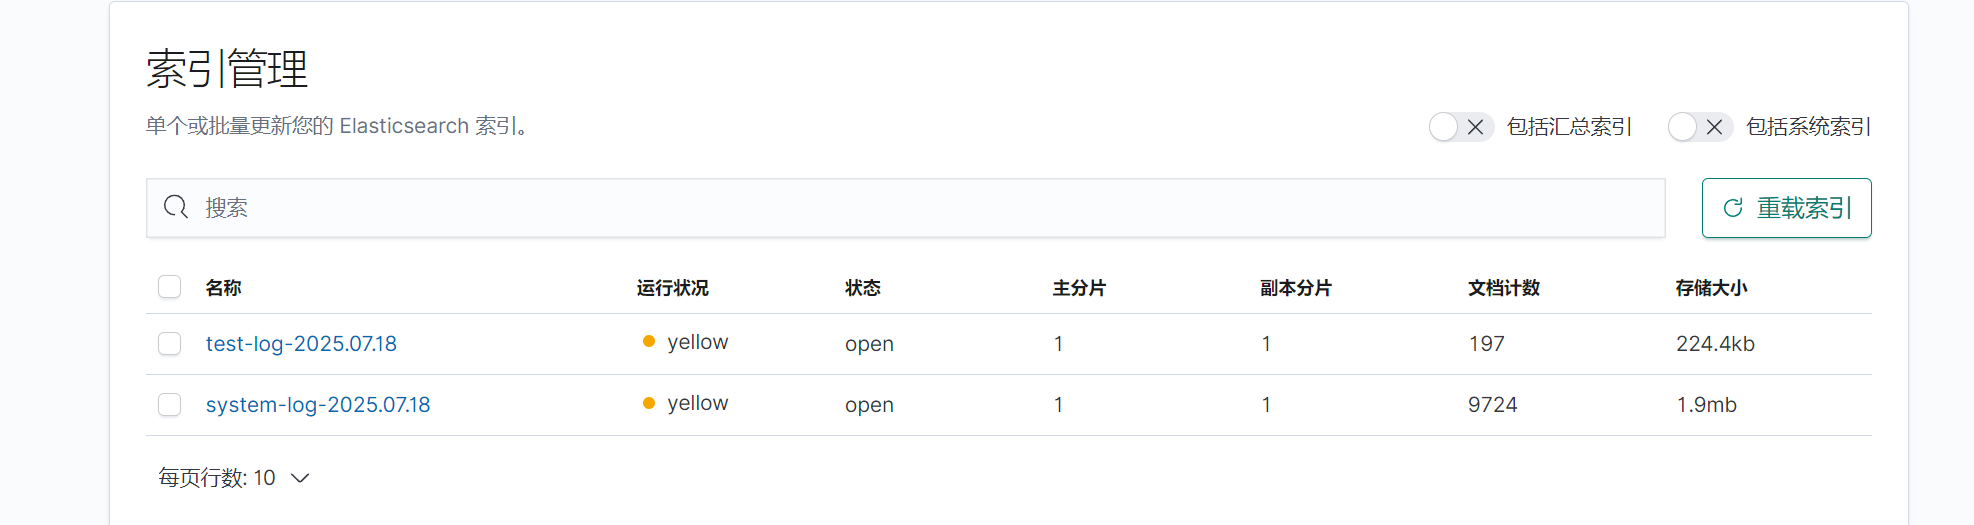
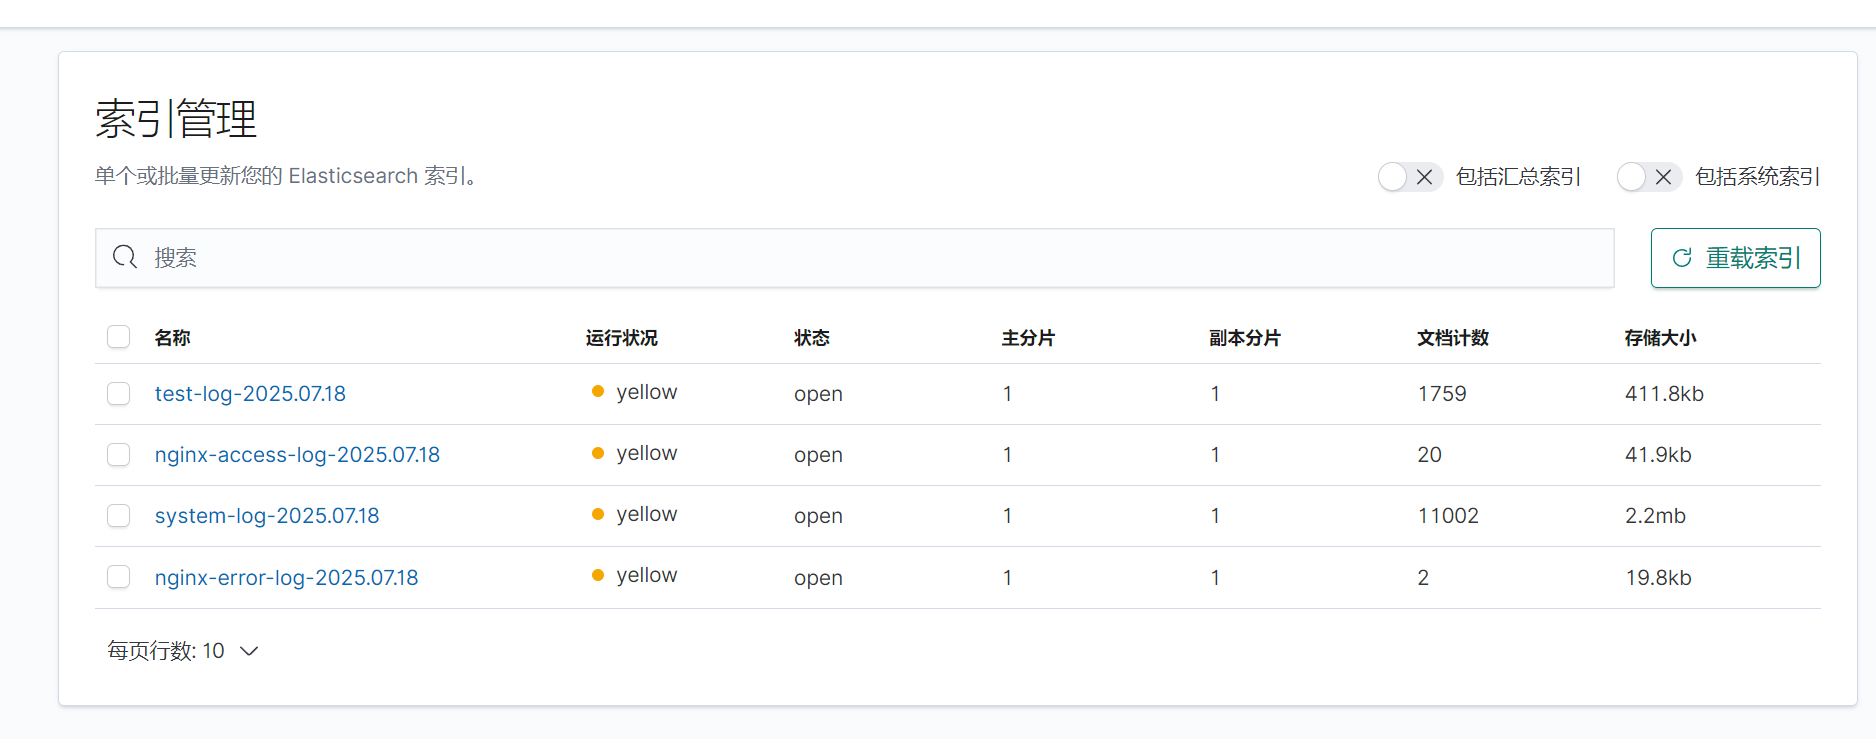
修改完成后啟動logstash,此時再次查看kibana發現多出test上的日志文件。
三.收集測試機nginx日志
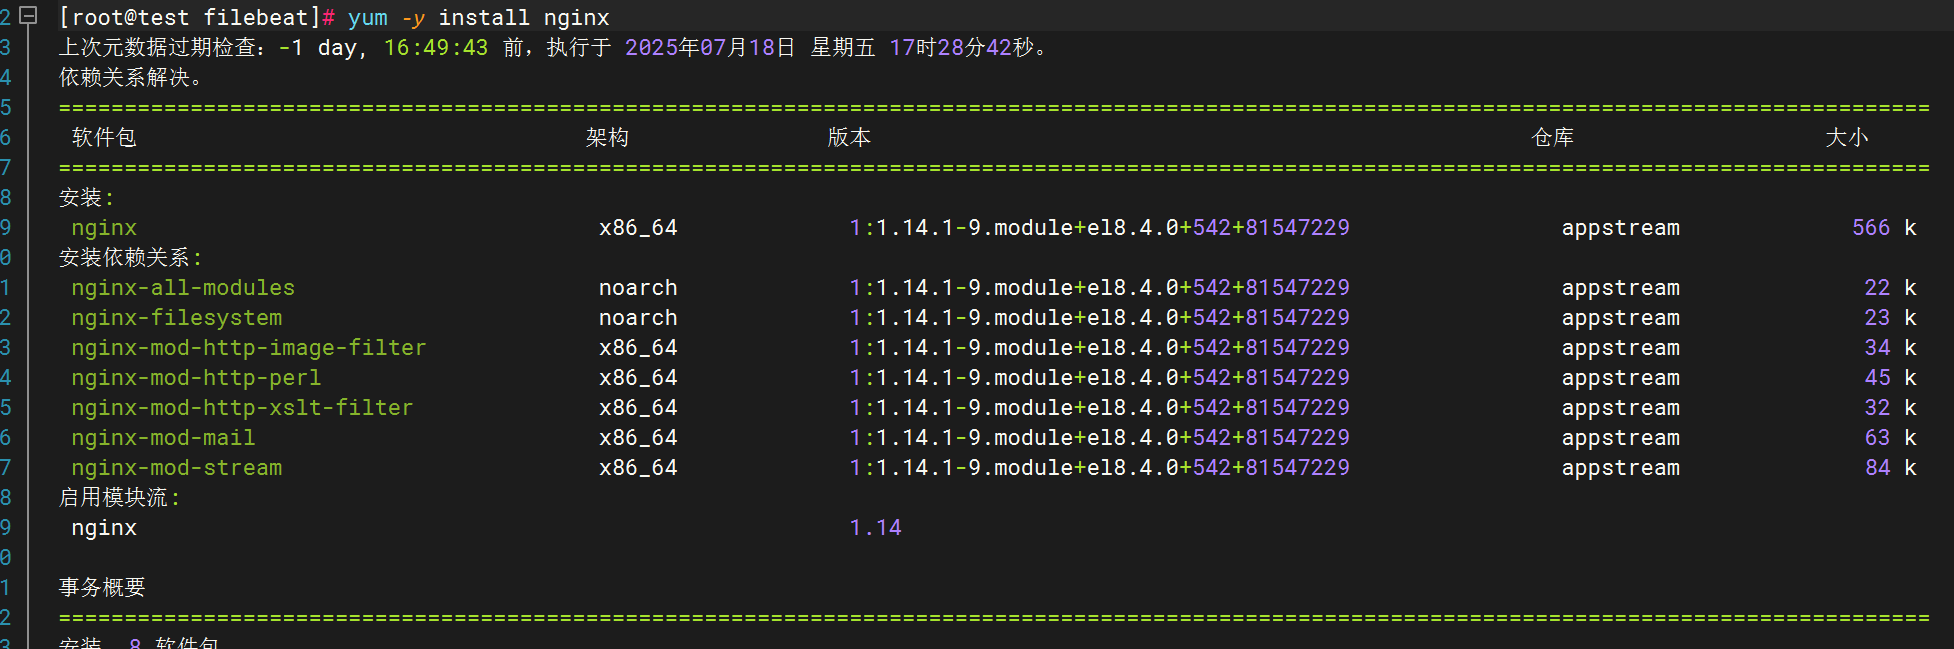
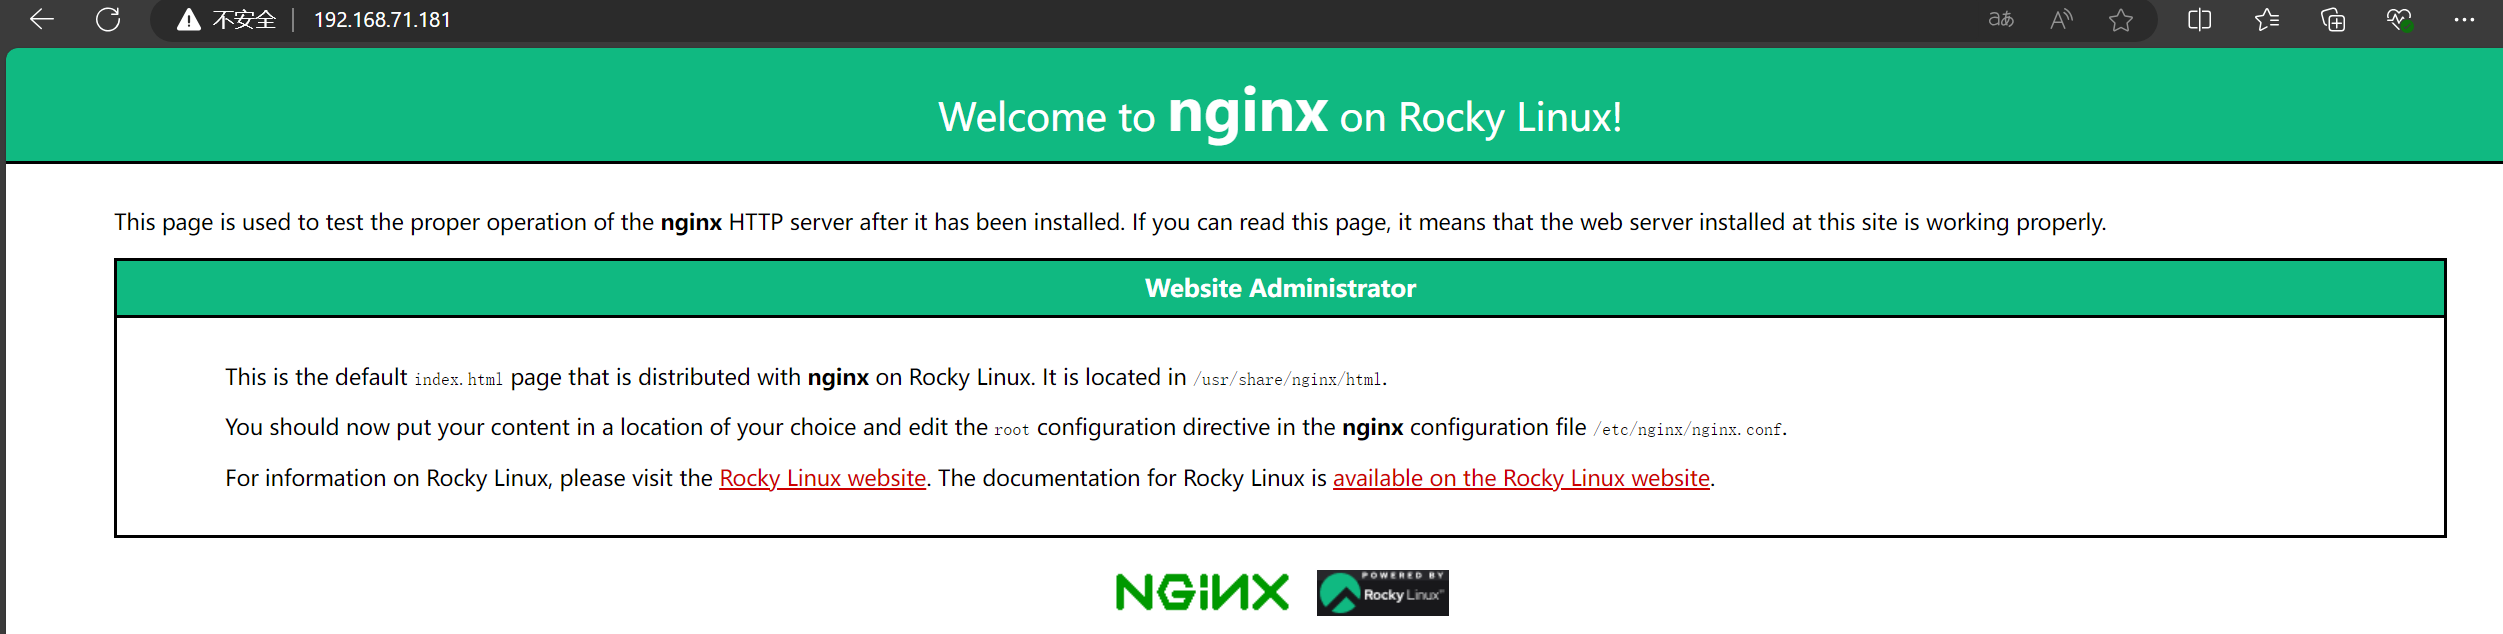
下載安裝nginx
修改filebeat文件
修改pipline文件
在test下新增如下內容
登錄nginx(不改主頁會有一個錯誤日志)
登錄查看kibana,生成日志文件
四.收集網絡服務模塊日志
1.DHCP
下載dhcp
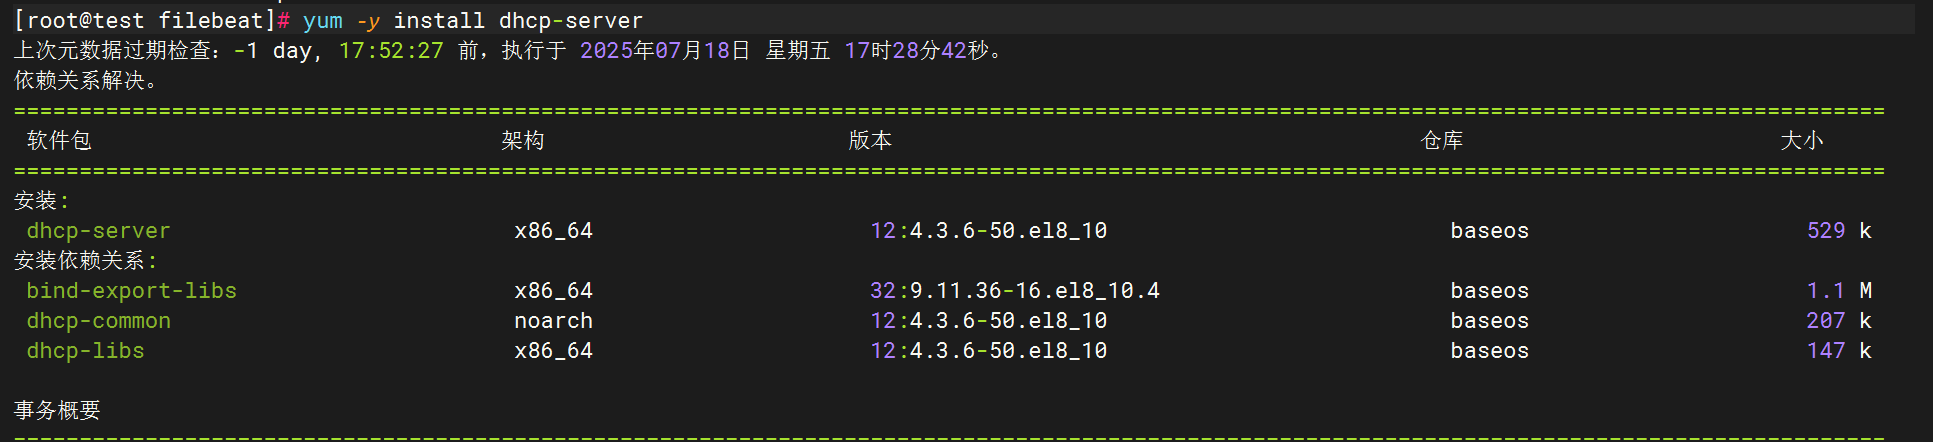
將完整dhcpd.conf文件復制過來
![]()

修改配置文件?
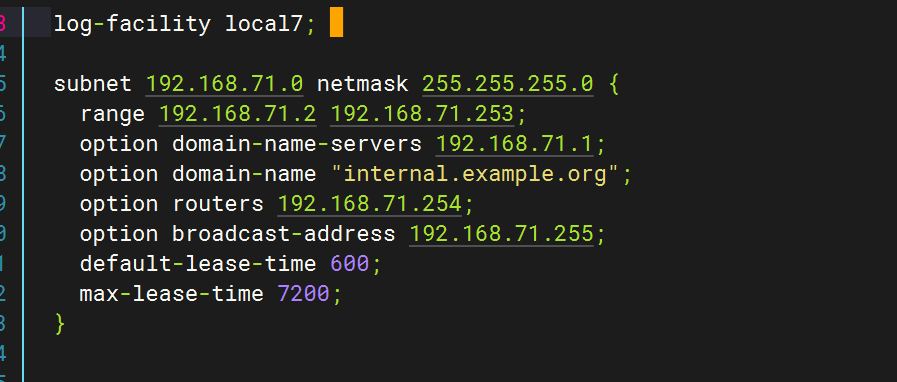
修改dhcp配置文件
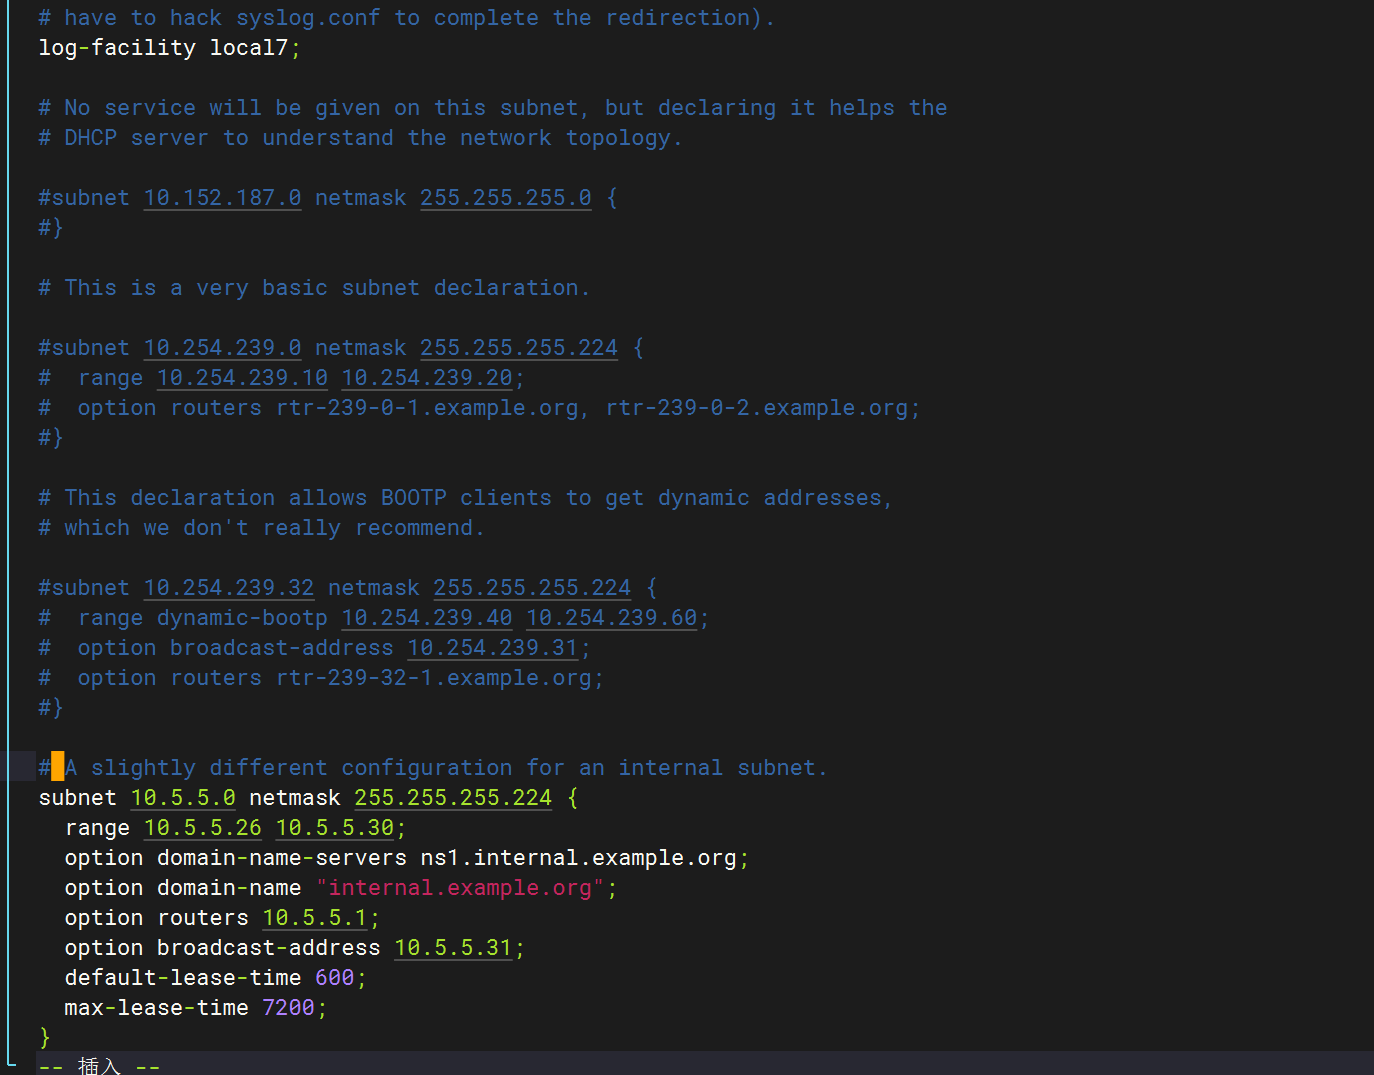
全部刪除,只保留以下字段?
修改/etc/rsyslog.conf,指向dhcpd.log(日志文件)

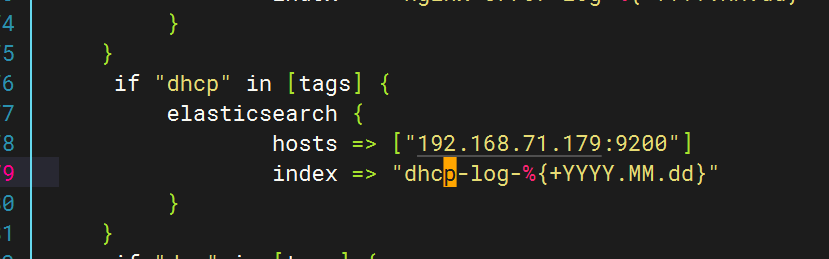
配置logstash文件?
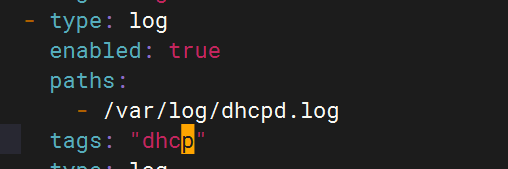
配置filebeat文件?
重啟應用查看kibana
2.DNS
下載DNS(bind)
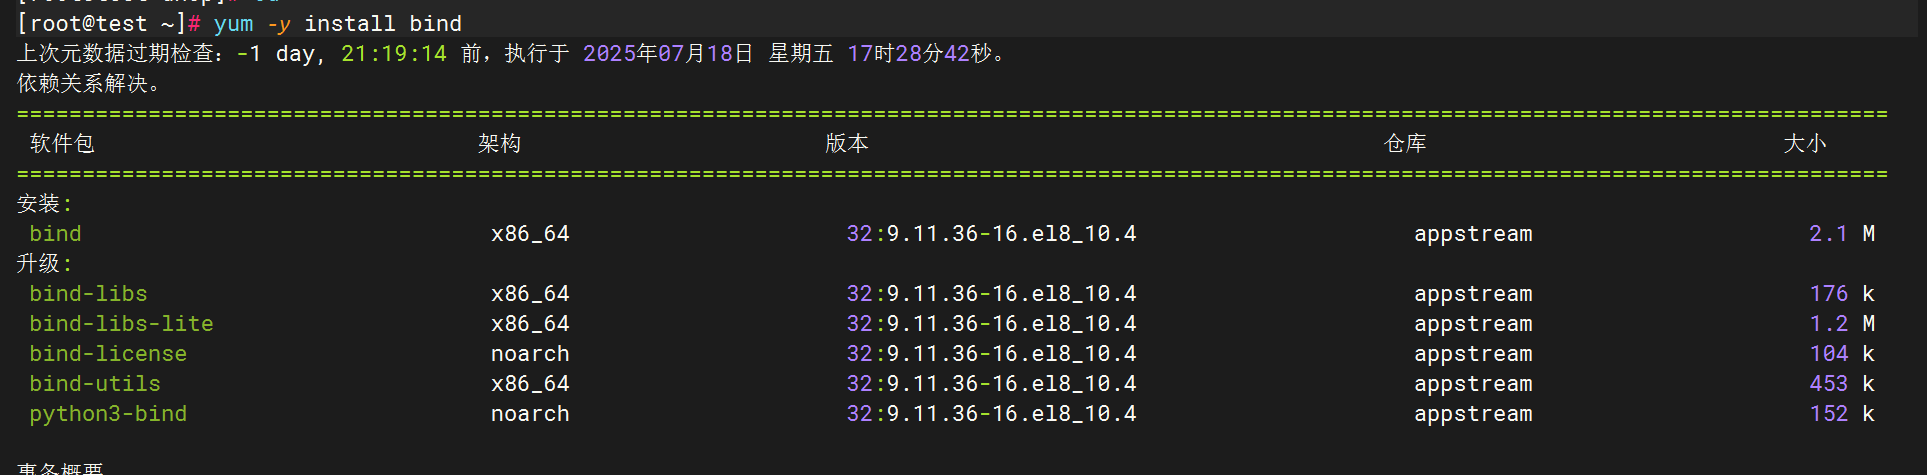
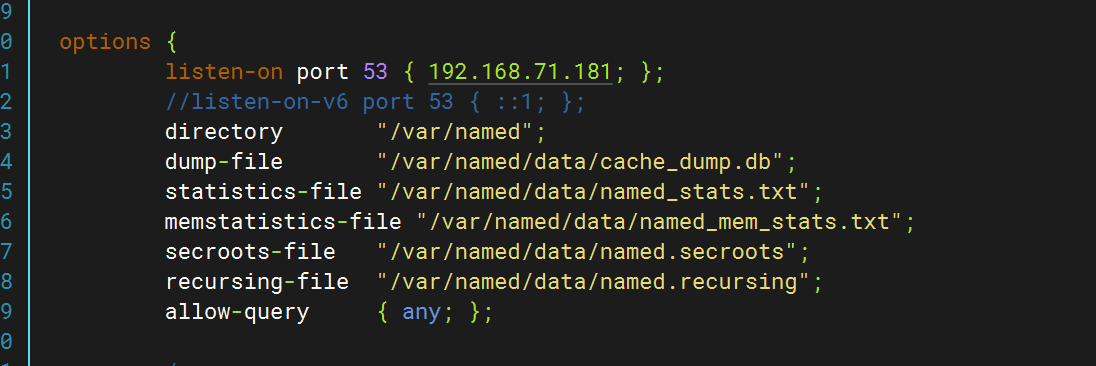
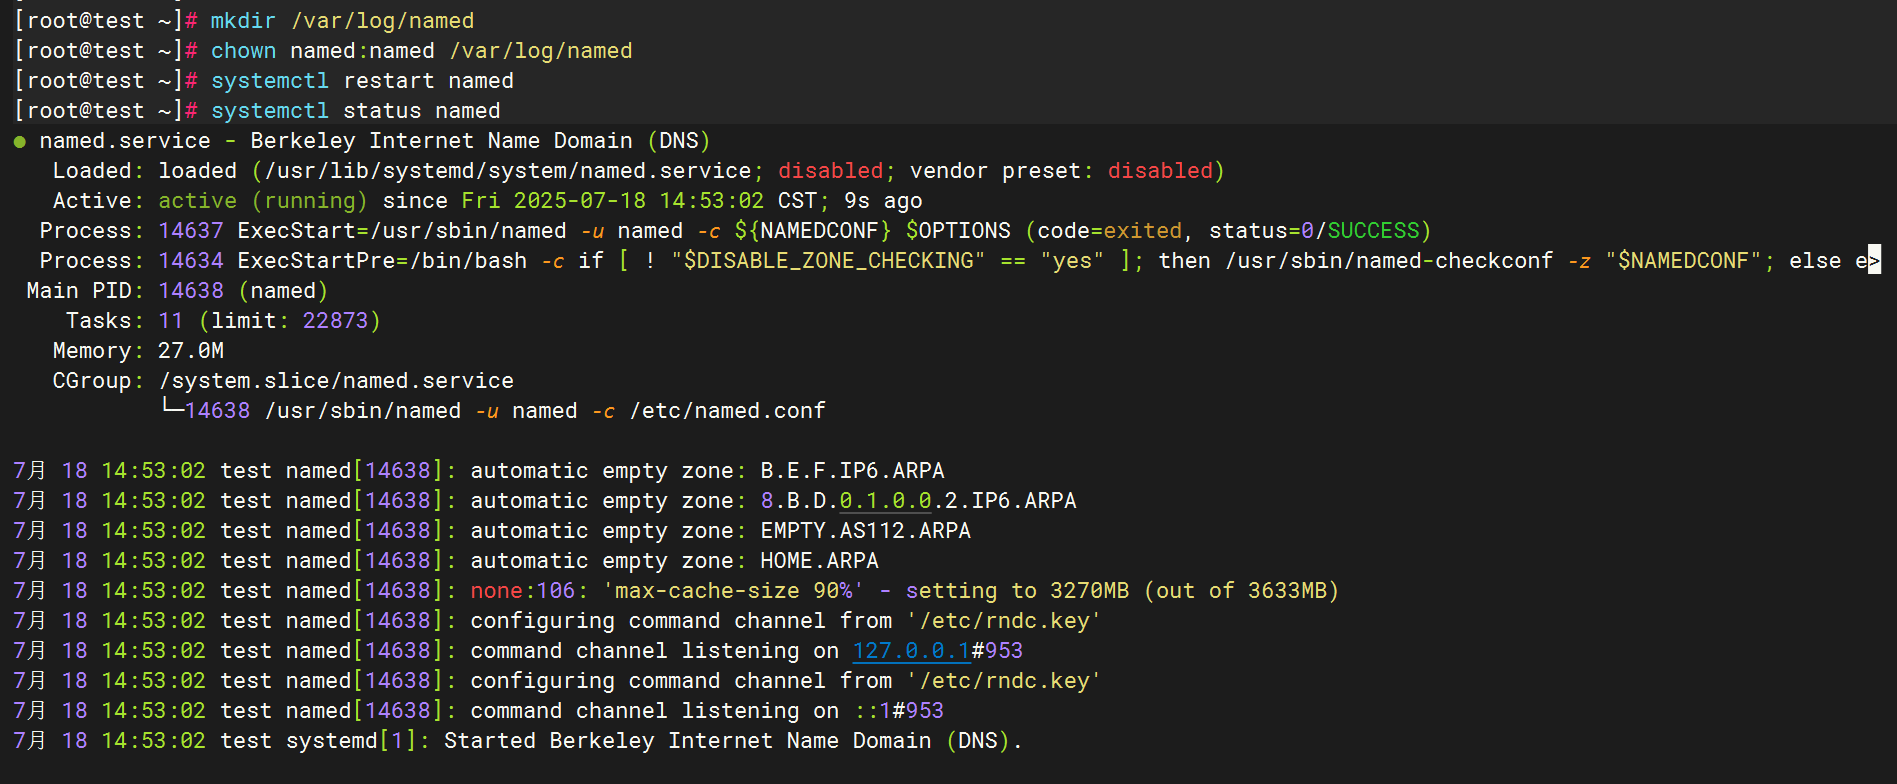
修改配置文件(/etc/named.conf)
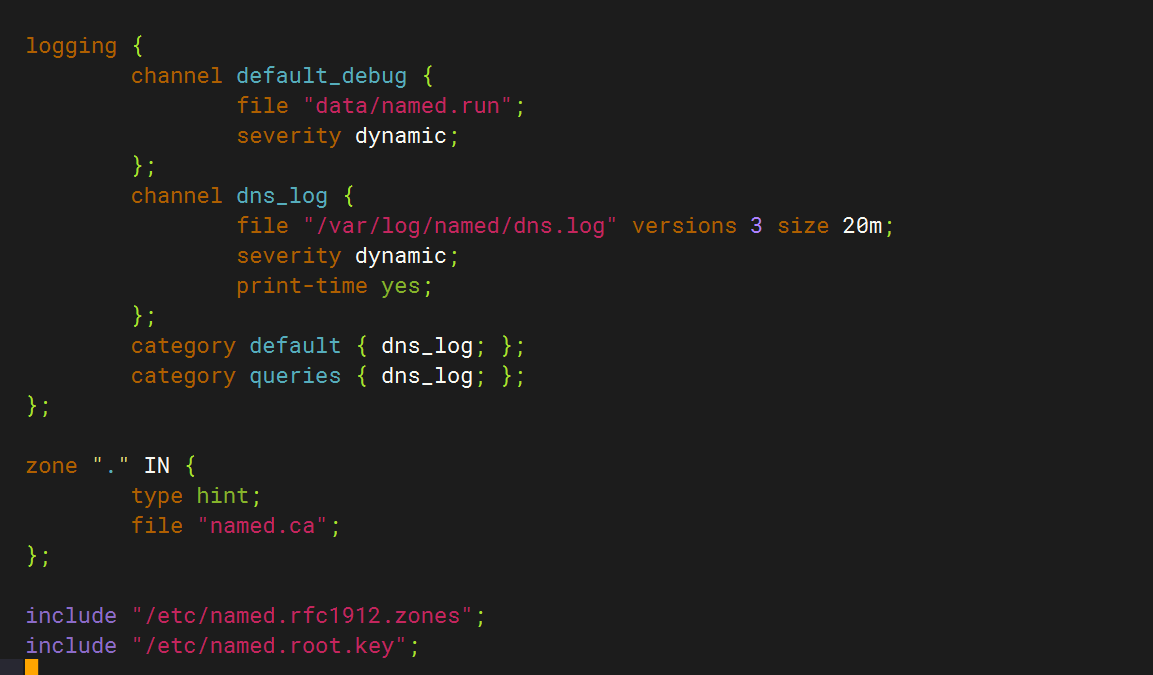
logging {channel default_debug {file "data/named.run";severity dynamic;};channel dns_log {file "/var/log/named/dns.log" versions 3 size 20m;severity dynamic;print-time yes;};category default { dns_log; };category queries { dns_log; };
};
創建日志目錄并賦權?
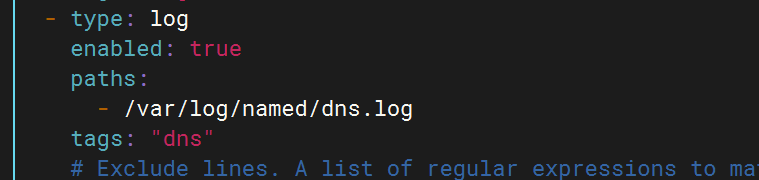
 配置filebeat文件
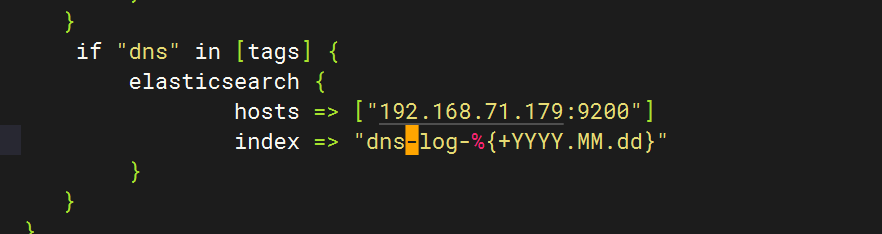
 ?配置logstash文件
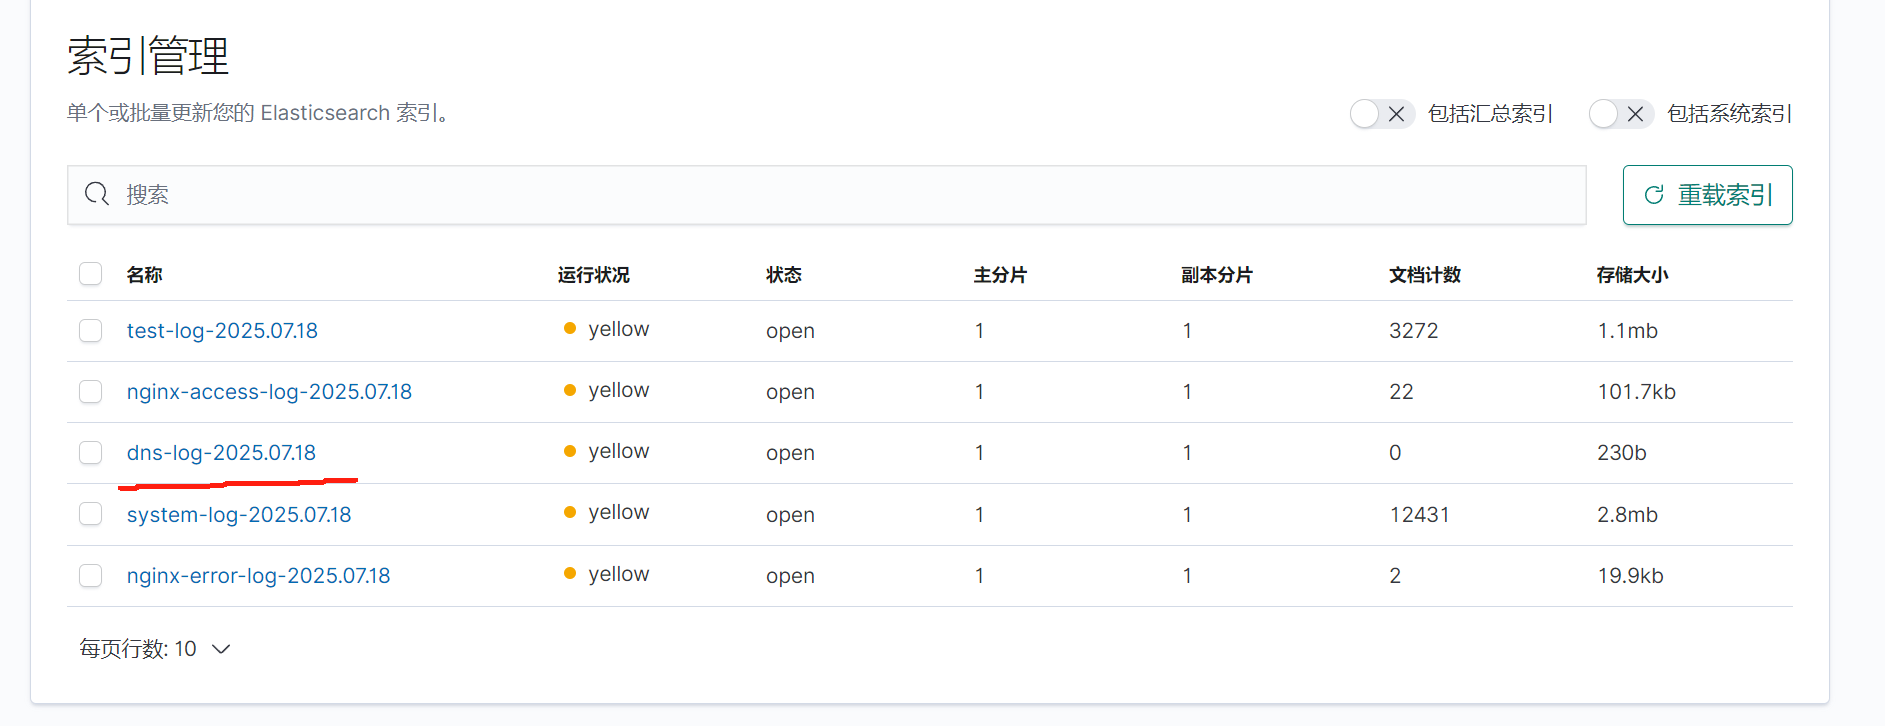
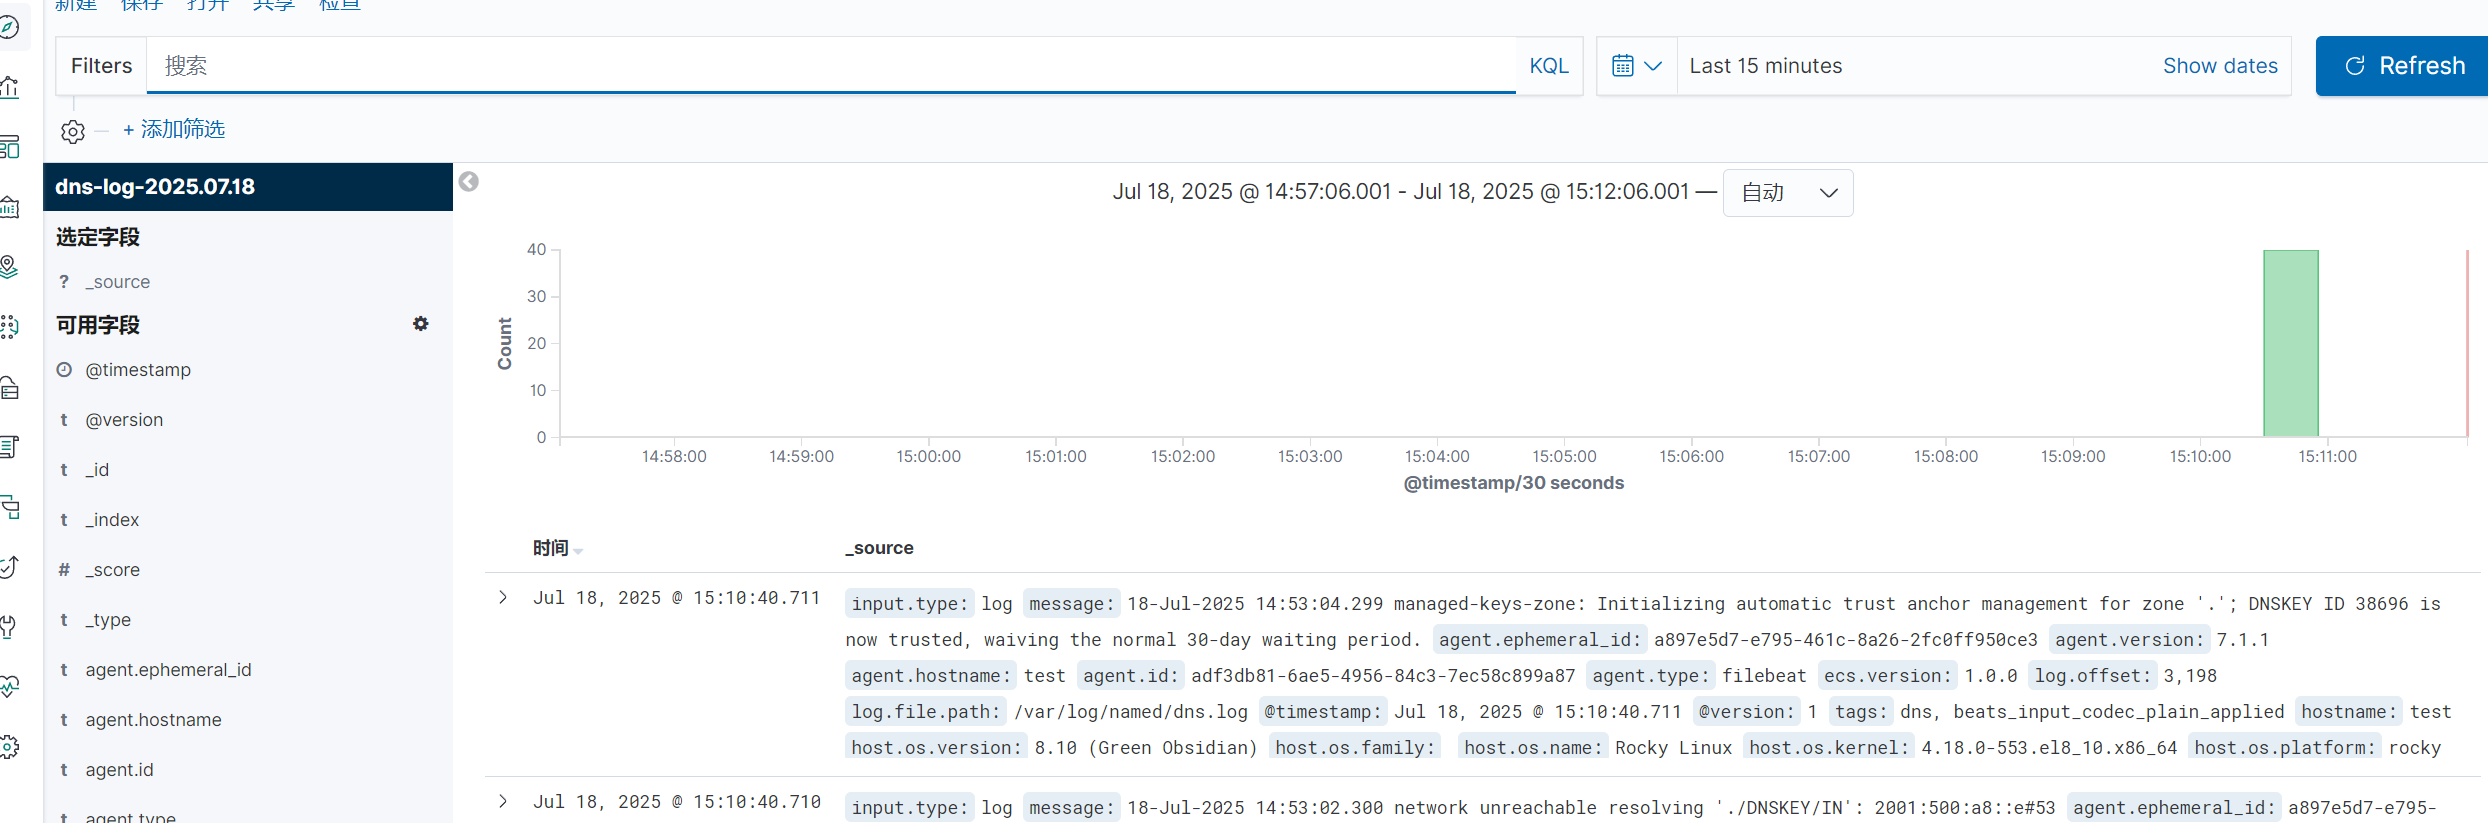
全部啟動后在kibana查看日志
3.SSH
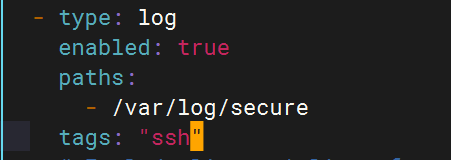
ssh的日志文件路徑為/var/log/secure
配置文件
Filebeat配置
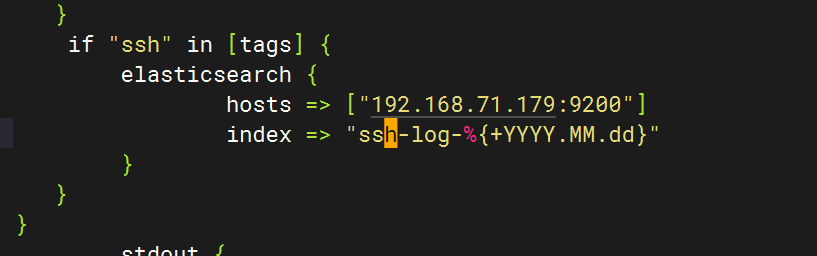
Logstash配置
重啟應用

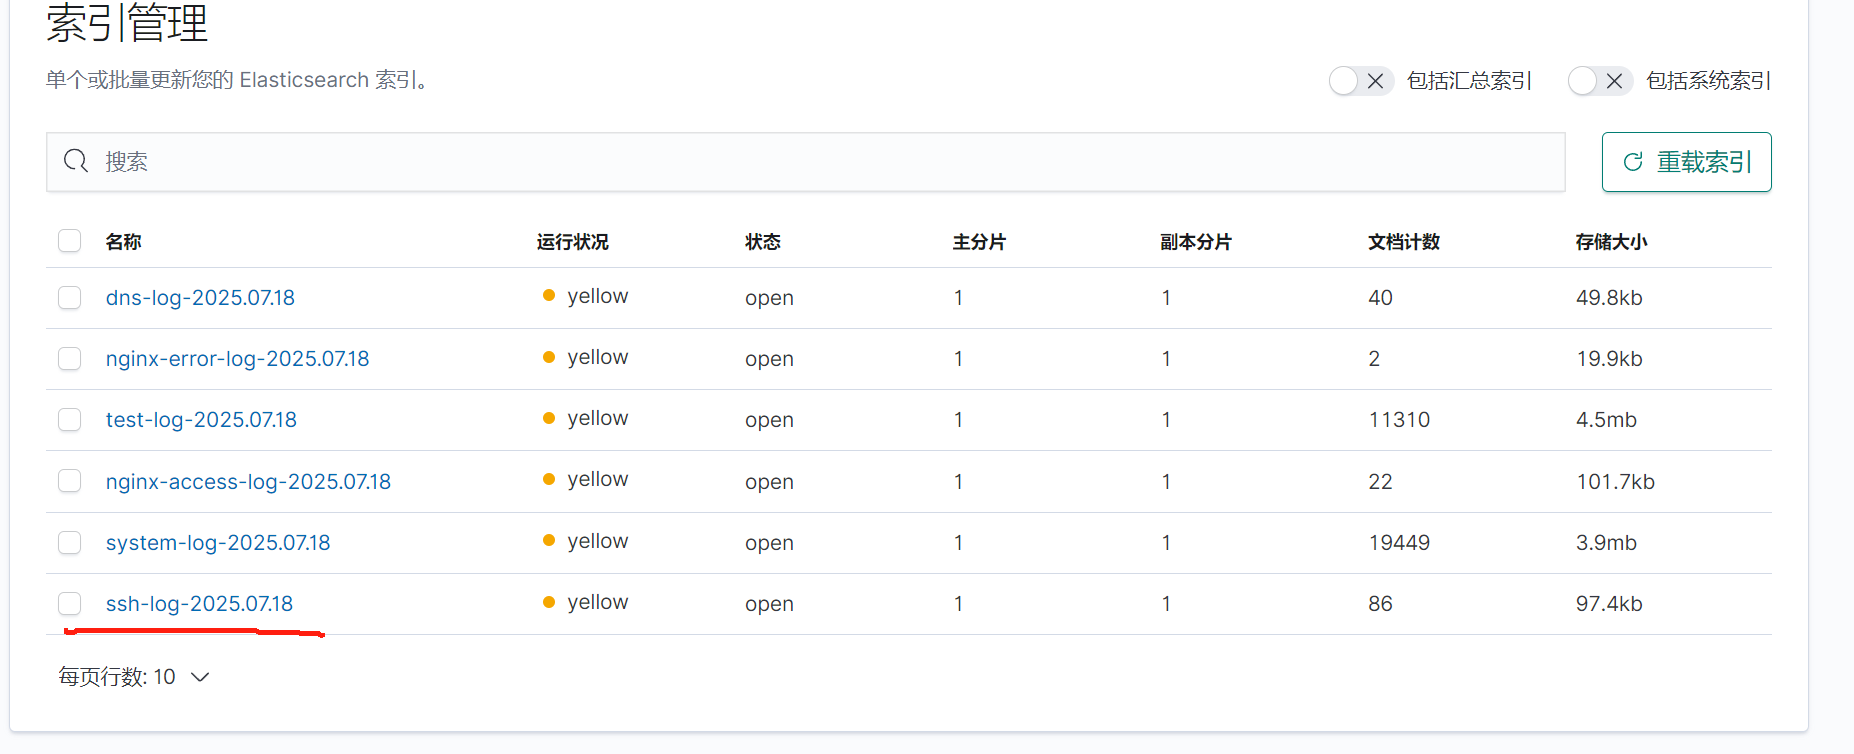
檢查kibana
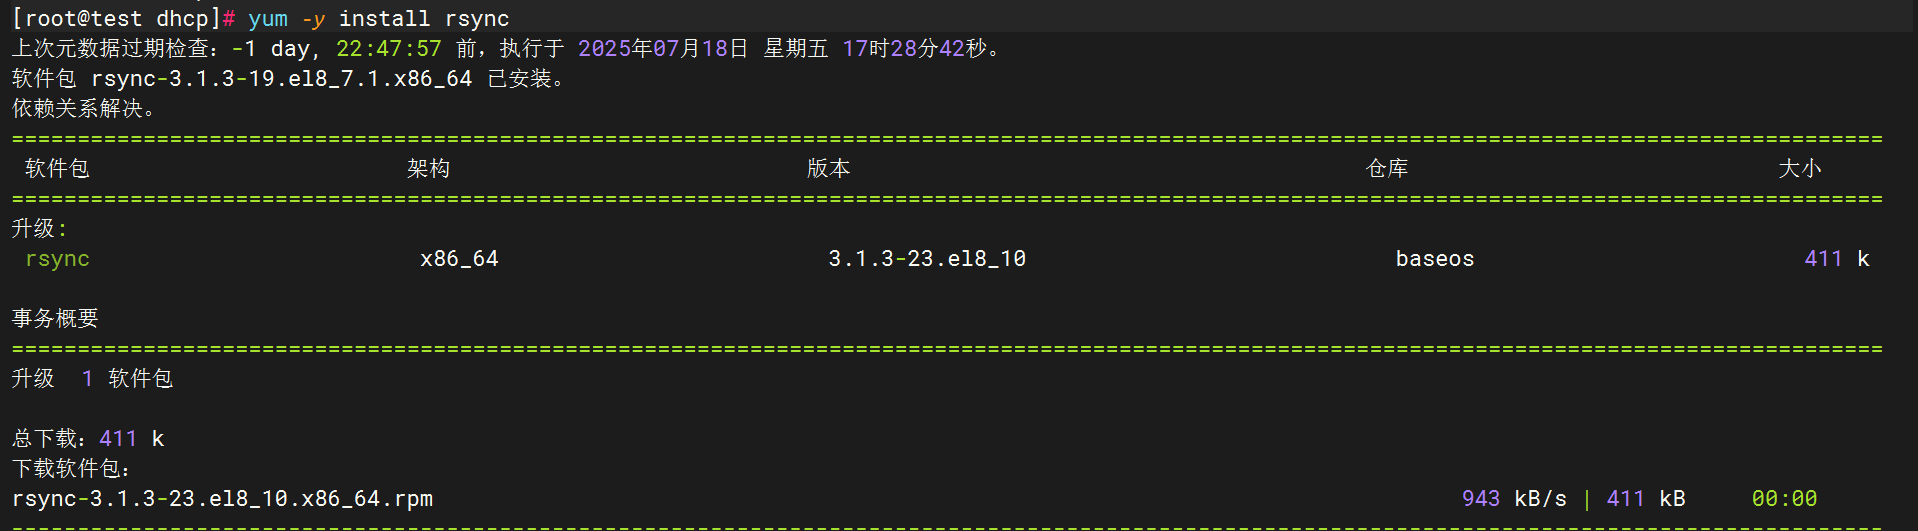
4.Rsync
配置rsync
下載rsync
創建服務配置文件
sudo tee /usr/lib/systemd/system/rsyncd.service <<'EOF'
[Unit]
Description=fast remote file copy program daemon
Documentation=man:rsyncd(8)
After=network.target[Service]
EnvironmentFile=/etc/sysconfig/rsyncd
ExecStart=/usr/bin/rsync --daemon --no-detach $OPTIONS[Install]
WantedBy=multi-user.target
EOF
創建環境配置文件
sudo tee /etc/sysconfig/rsyncd <<'EOF'
# Options for rsync daemon
OPTIONS=""
EOF
創建主配置文件
sudo tee /etc/rsyncd.conf <<'EOF'
# 最小化配置示例
uid = root
gid = root
use chroot = yes
max connections = 4
pid file = /var/run/rsyncd.pid# 示例模塊
[backup]path = /tmp/backupcomment = Backup Arearead only = no
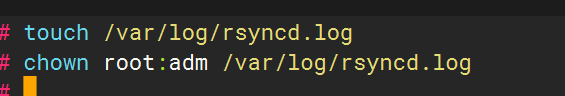
EOF創建日志文件并賦權:
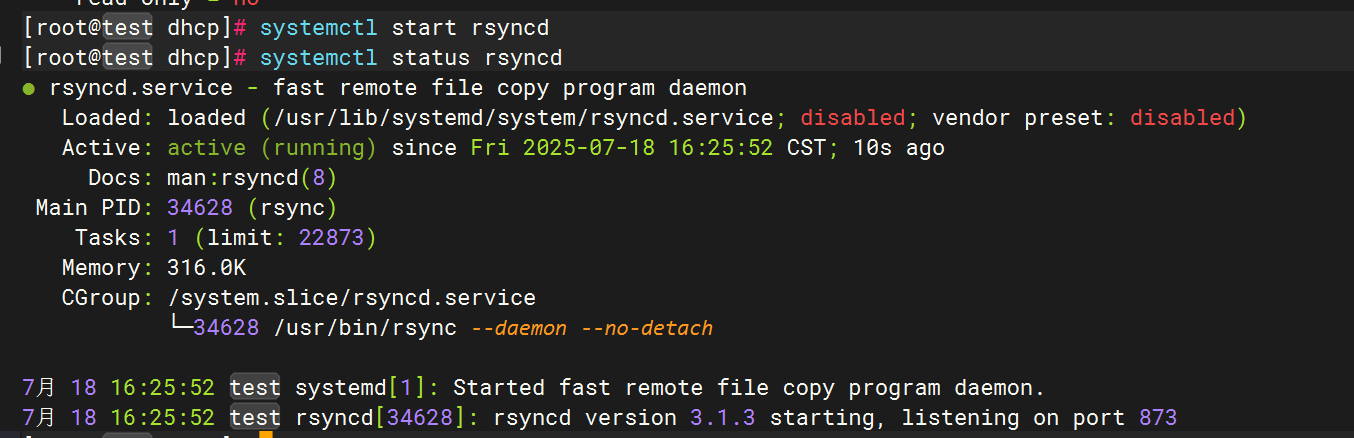
啟動服務
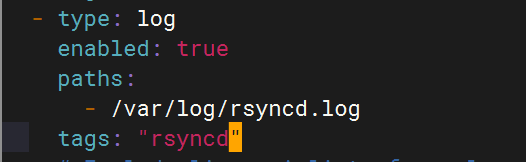
Filebeat配置
logstash配置
重啟服務,使用rsync命令向目標主機傳輸文件以生成日志
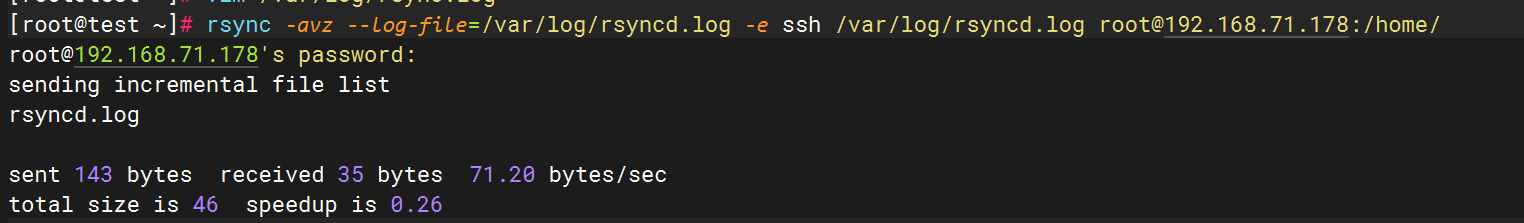
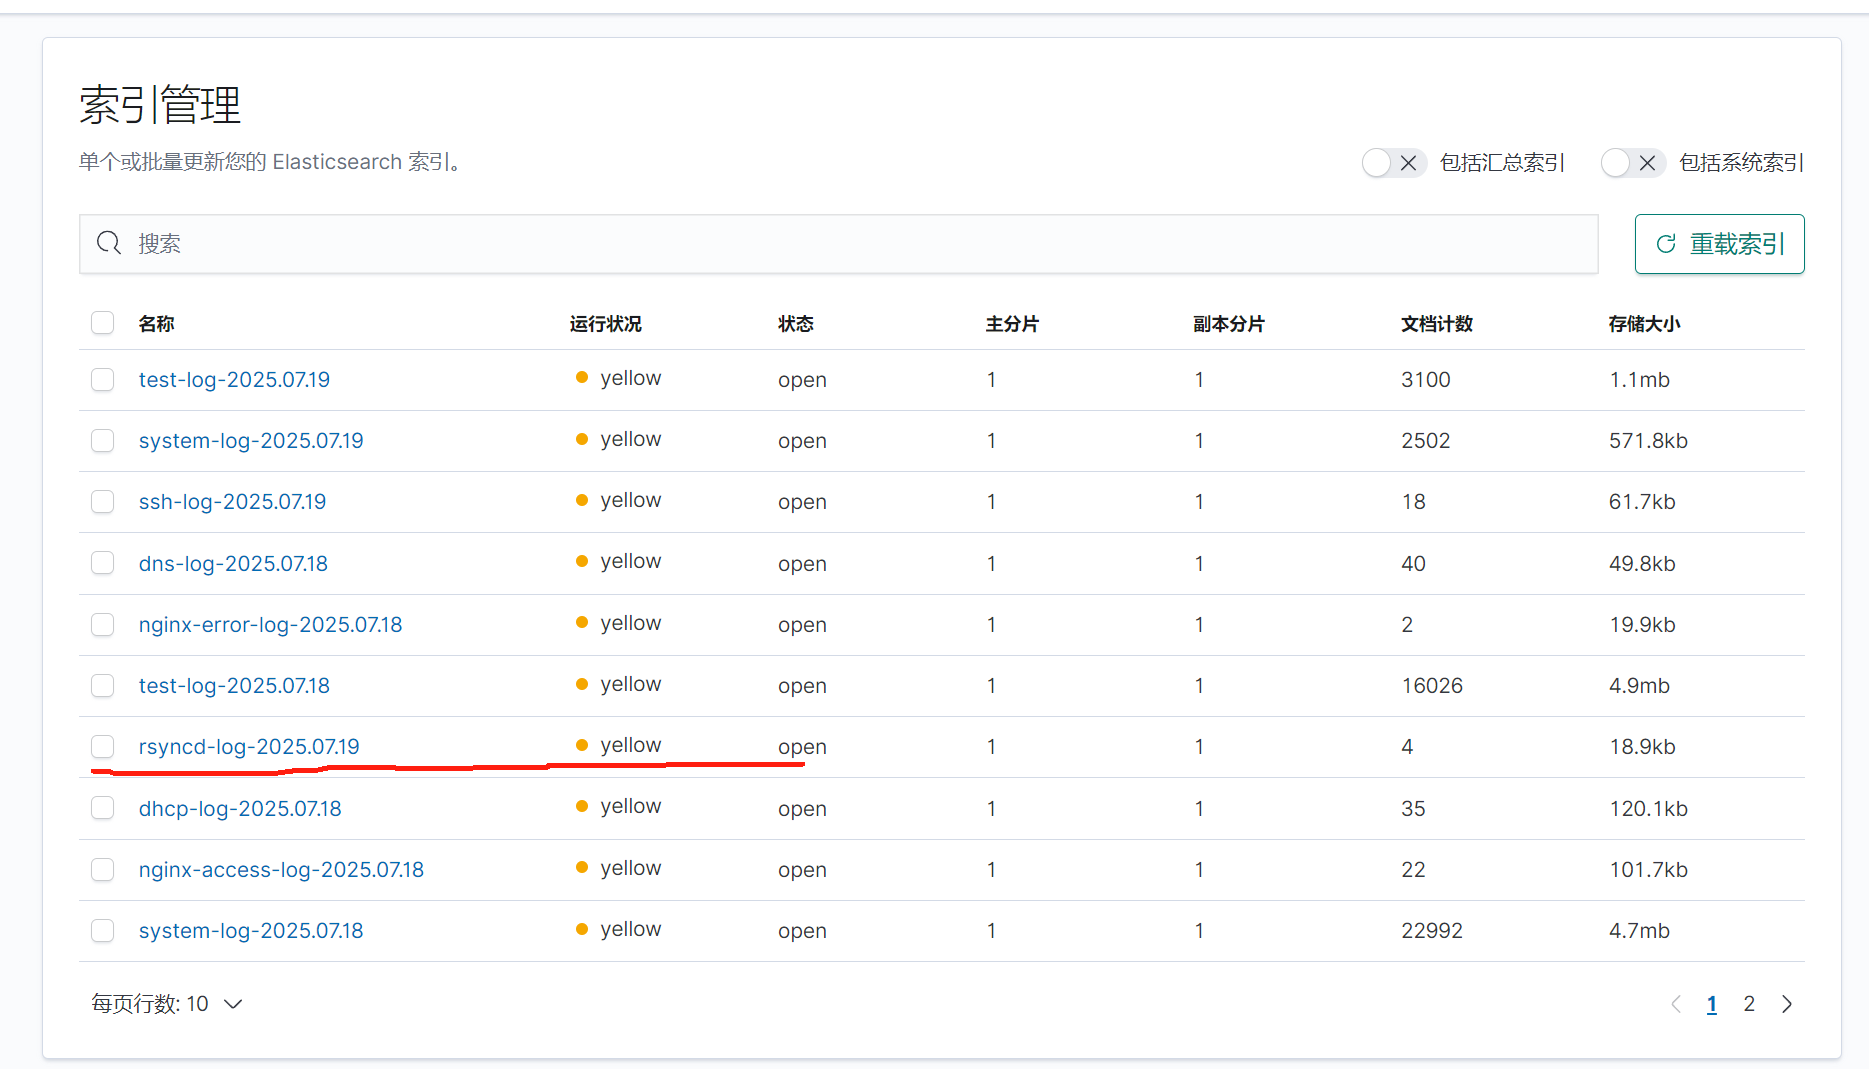
在kibana上查看
五.收集Tomcat服務日志
1.安裝tomcat
解壓安裝包
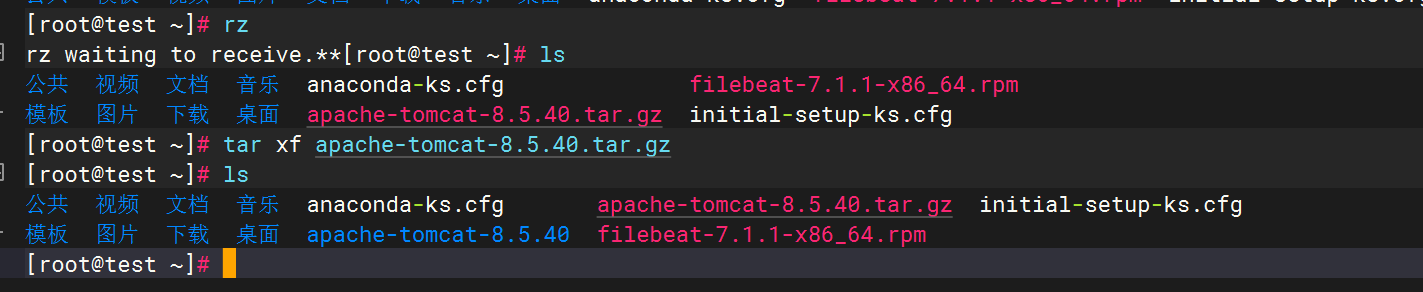
Tomcat安裝
![]()
優化啟動和關閉命令

2.Tomcat啟動驗證
3.配置filebeat文件
4.配置logstash文件
5.重啟服務查看kibana
六.MySQL數據庫日志收集
1.安裝MySQL
2.編輯MySQL日志生成配置
編輯MySQL配置文件(/etc/my.cnf或/etc/mysql/mysql.conf.d/mysqld.cnf
[mysqld]
general_log = 1
general_log_file = /var/log/mysql/general.log
slow_query_log = 1
slow_query_log_file = /var/log/mysql/slow.log
long_query_time = 2  # 慢查詢閾值(秒)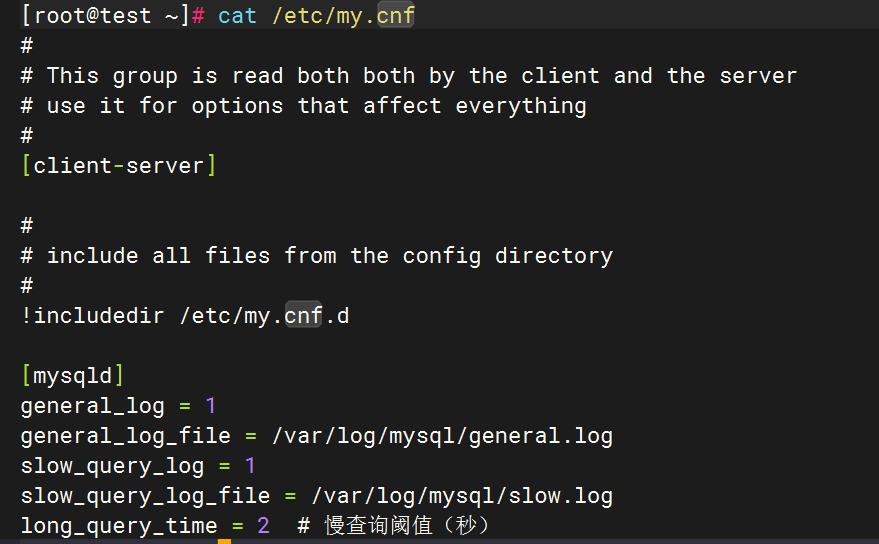
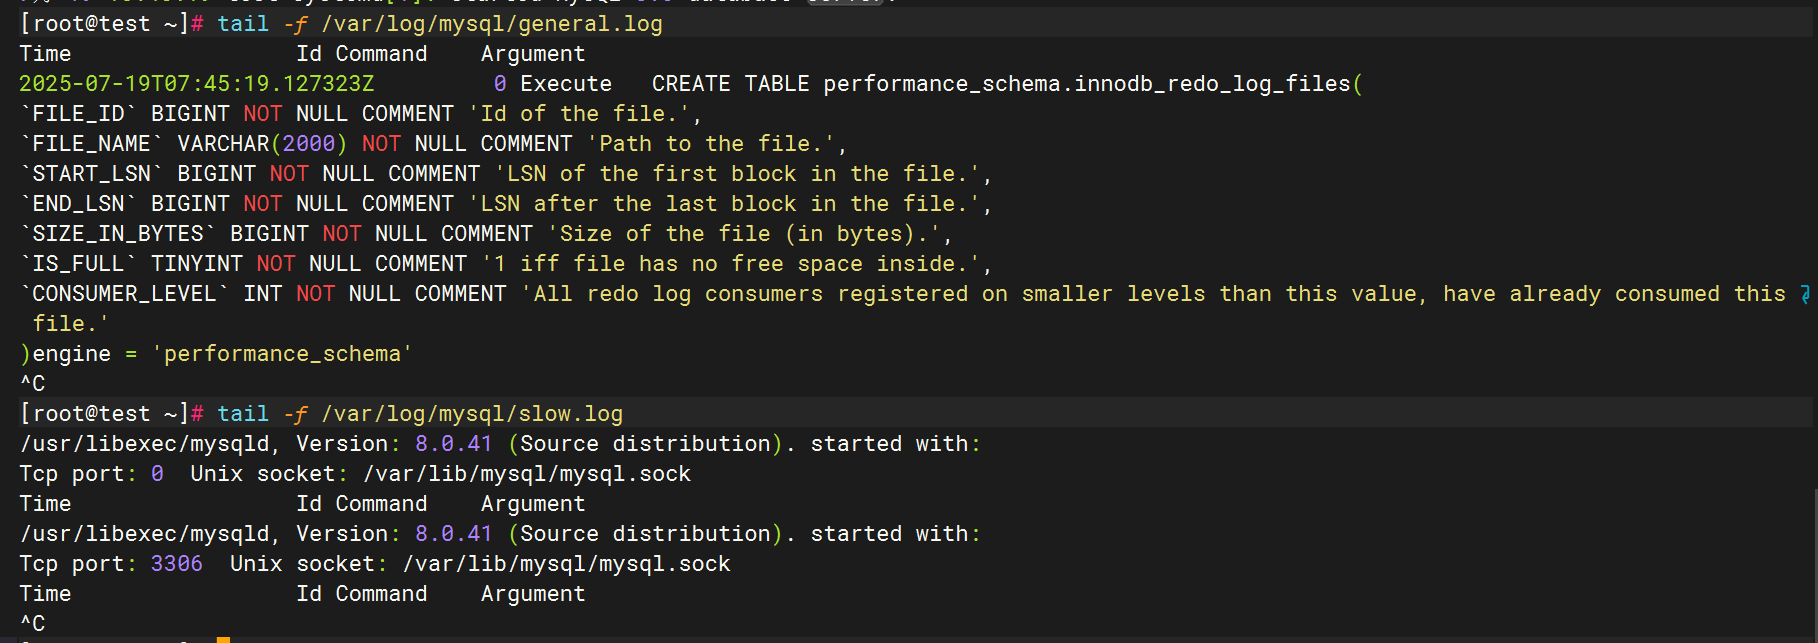
3.啟動mysql并驗證日志生成
4.配置filebeat文件
5.配置logstash文件
6.重啟服務查看kibana
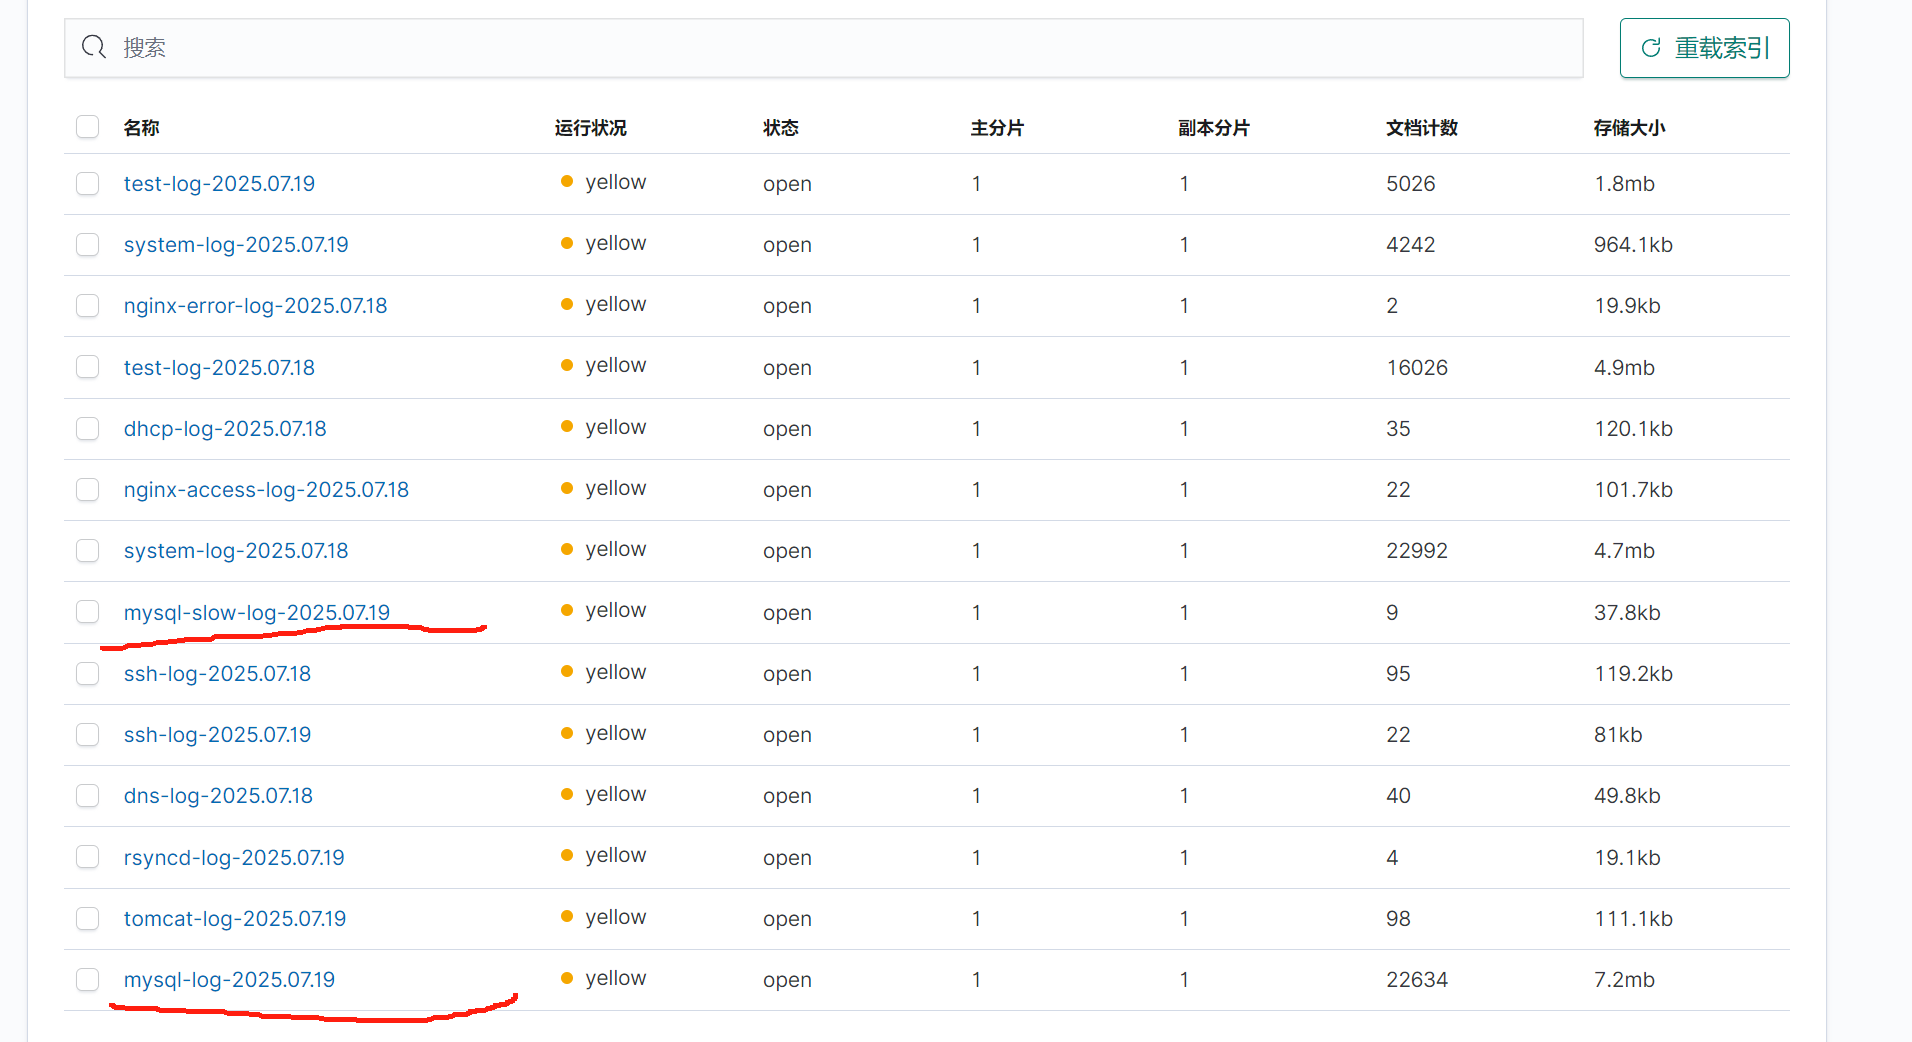
通用日志和慢日志
七.NFS日志收集
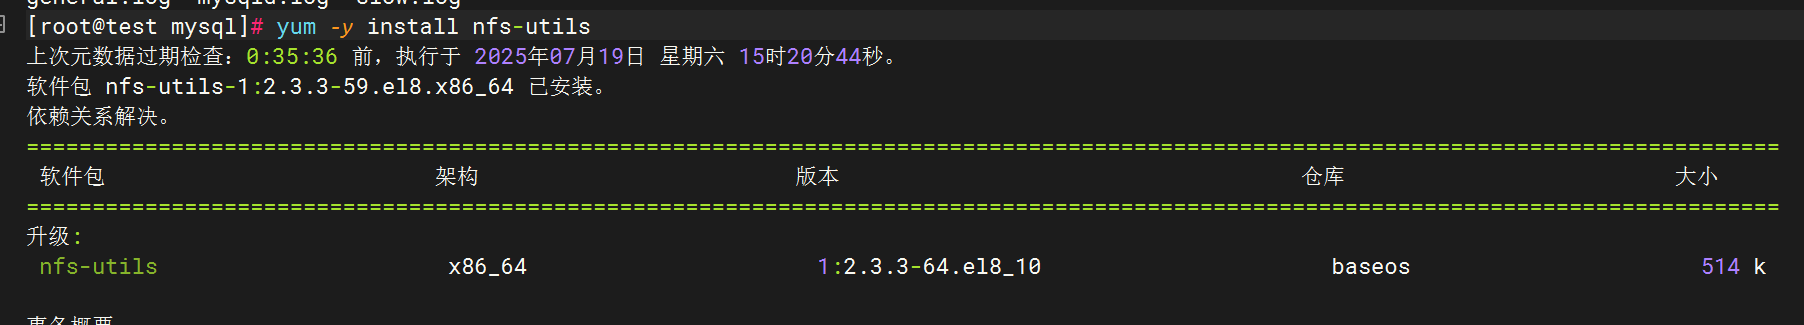
1.安裝NFS
2.啟用NFS日志
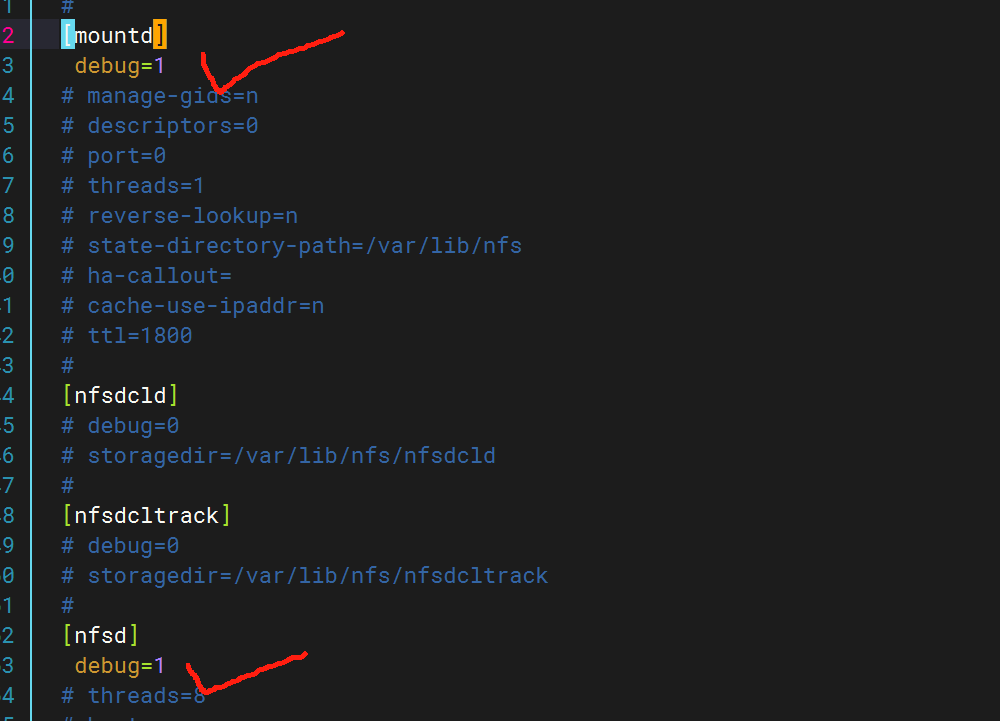
編輯NFS配置文件(通常為/etc/nfs.conf或/etc/sysconfig/nfs),確保日志模塊啟用并指定路徑
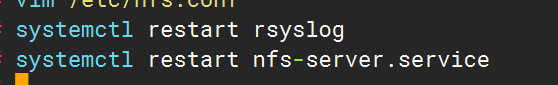
配置rsyslog.log文件,為nfs增加日志路徑

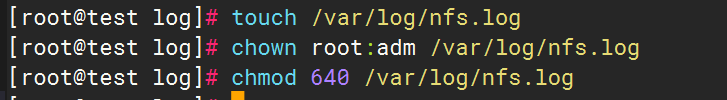
創建日志文件
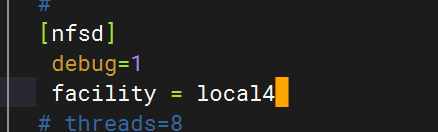
在NFS配置中指定facility
重啟rsyslog服務
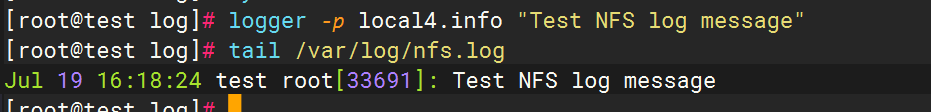
驗證配置:
發送測試日志(使用local4 facility),檢查日志是否生成
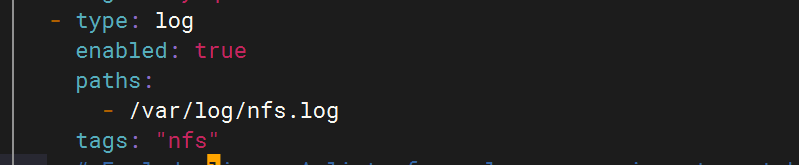
3.配置filebeat文件
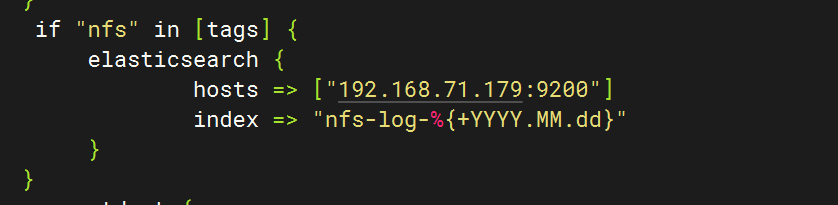
4.配置logstash文件
5.重啟服務查看kibana

八.Redis數據庫日志收集
1.安裝redis數據庫
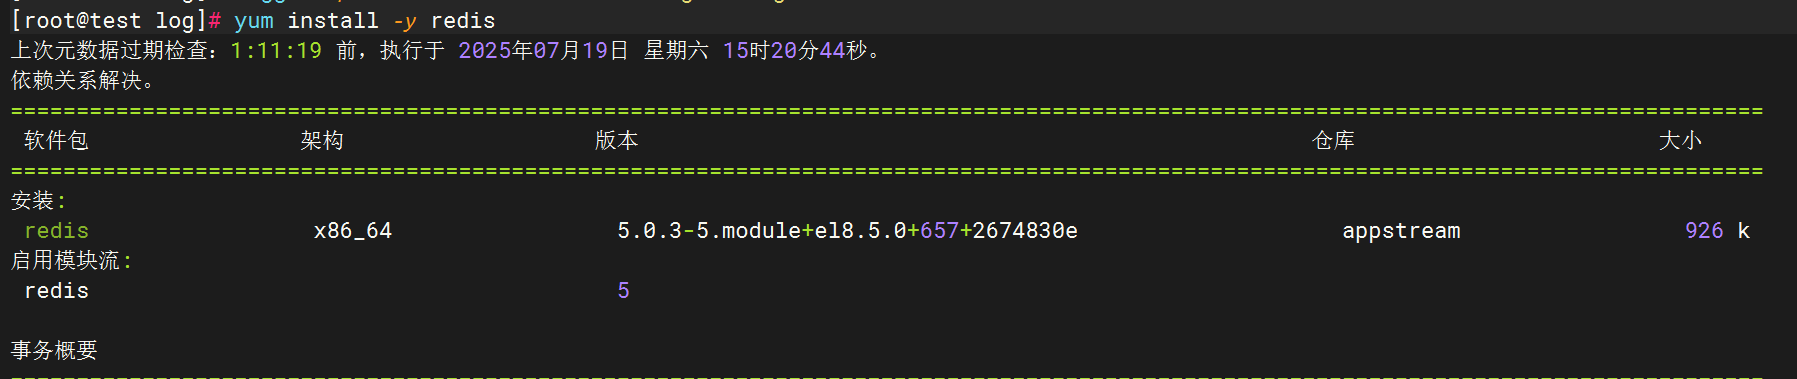
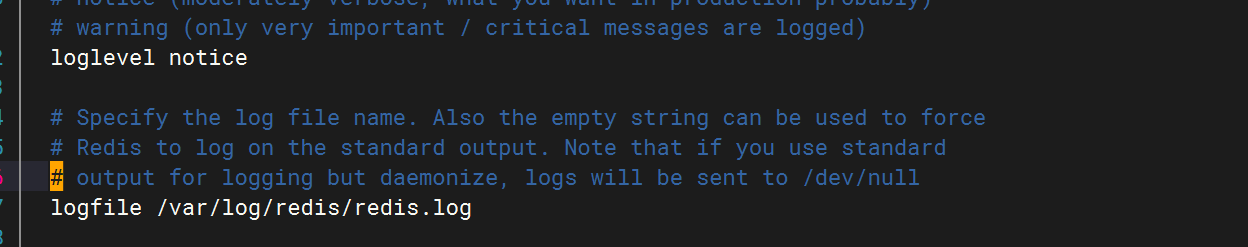
2.Redis日志生成配置
修改Redis配置文件?
編輯/etc/redis.conf,啟用日志并指定路徑:
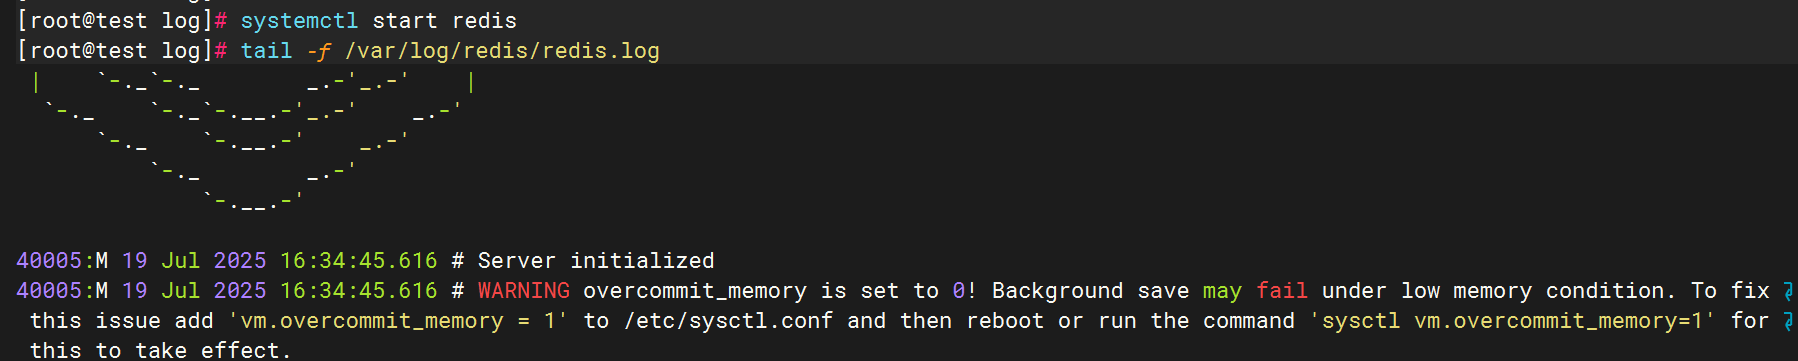
驗證日志生成
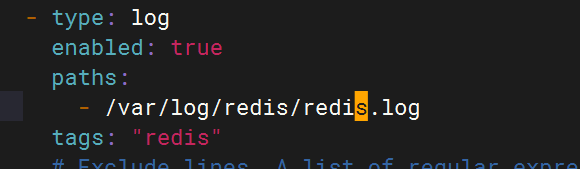
3.配置filebeat文件
4.配置logstash文件
5.重啟服務查看kibana

九.LVS日志收集
1.下載安裝ipvsadm
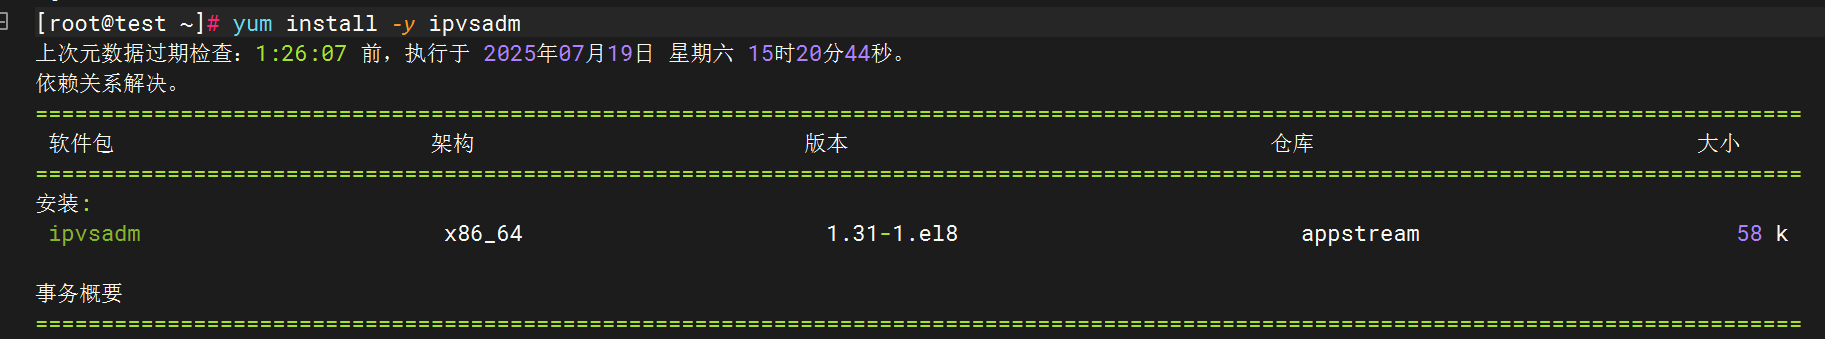
2.配置rsyslog文件
在/etc/rsyslog.conf內加入
kern.* ? ?/var/log/lvs.log
手動觸發LVS日志生成
通過模擬請求觸發LVS轉發,使系統產生日志:
curl http://<VIP> # 替換為你的虛擬IP(VIP)或在另一臺機器訪問VIP服務。
或者可以手動添加規則使日志內容增加
ifconfig ens34:0 192.168.71.200/24 #生成臨時網址ipvsadm -a -t 192.168.71.200:80 -s rr
ipvsadm -E -t 192.168.71.200:80 -s rr -p 60
ipvsadm -a -t 192.168.71.200:80 -r 192.168.1.101:80 -g
ipvsadm -a -t 192.168.71.200:80 -r 192.168.1.102:80 -g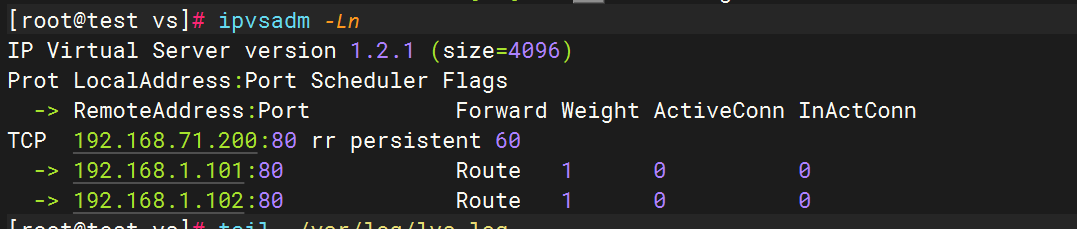
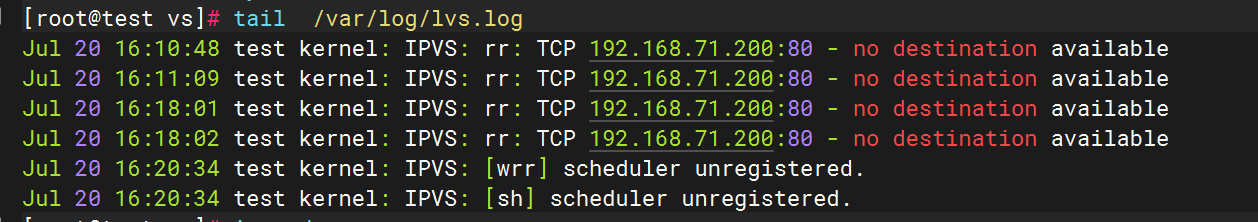
查看日志內容是否生成
2.配置filebeat文件
3.配置logstash文件
4.重啟服務后查看kibana

十.Haproxy日志收集
1.安裝haproxy
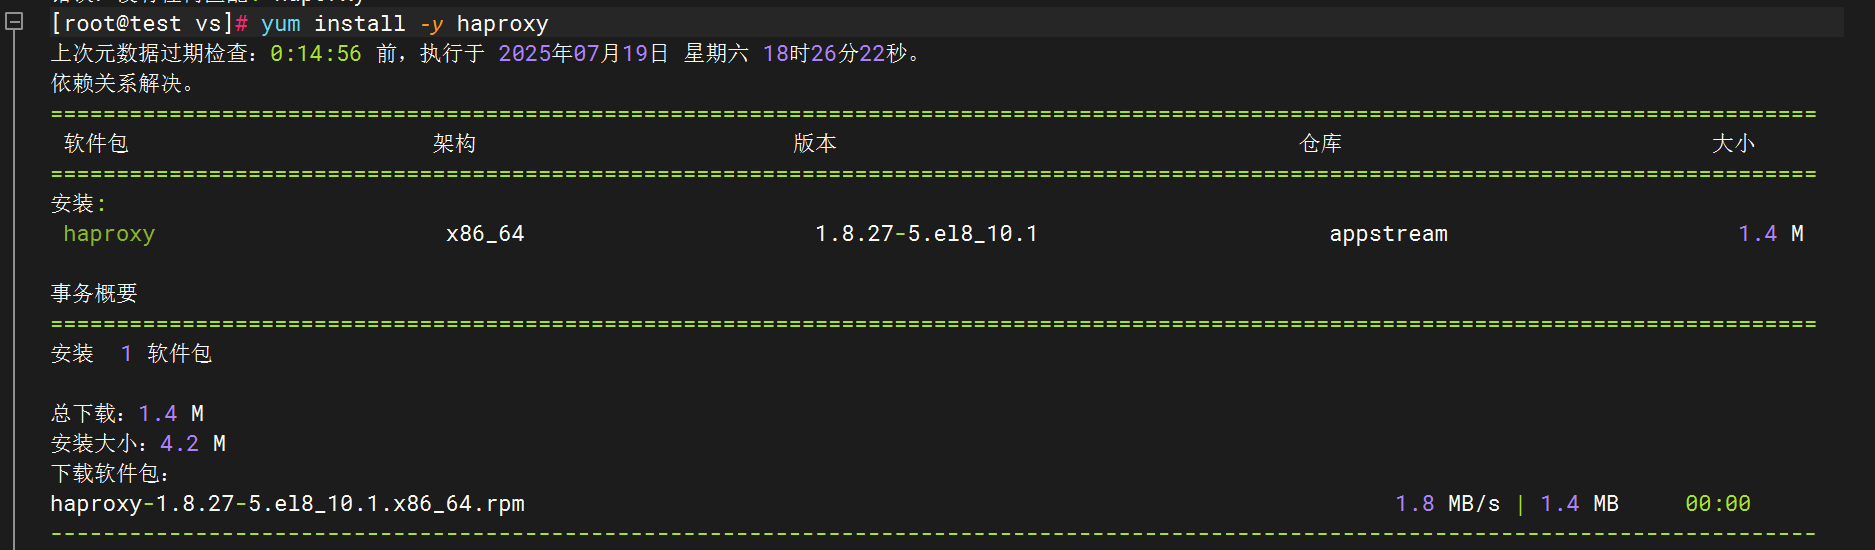
2.配置haproxy文件
cat > /etc/haproxy/haproxy.cfg <<'EOF'
globallog 127.0.0.1 local0 info  # 重要:使用local0設備defaultslog     globalmode    httpoption  httplogoption  dontlognulltimeout connect 5000timeout client  50000timeout server  50000# 添加您的具體frontend/backend配置
# frontend示例:
frontend http-inbind *:80default_backend serversbackend serversserver server1 192.168.1.100:80 check
EOF
3.配置Rsyslog收集HAProxy日志
創建文件 /etc/rsyslog.d/haproxy.conf
$ModLoad imudp
$UDPServerRun 514
local0.* /var/log/haproxy.log  # 本地存儲
local0.* @logstash_ip:5140     # 轉發到Logstash
4.修改filebeat文件
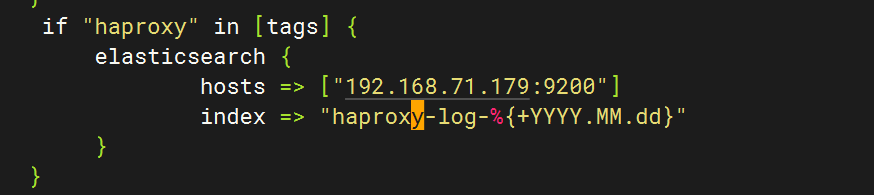
5.修改logstash文件
6.重啟全部服務,登錄kibana查看日志

十一.Keepalived日志收集
1.安裝keepalived
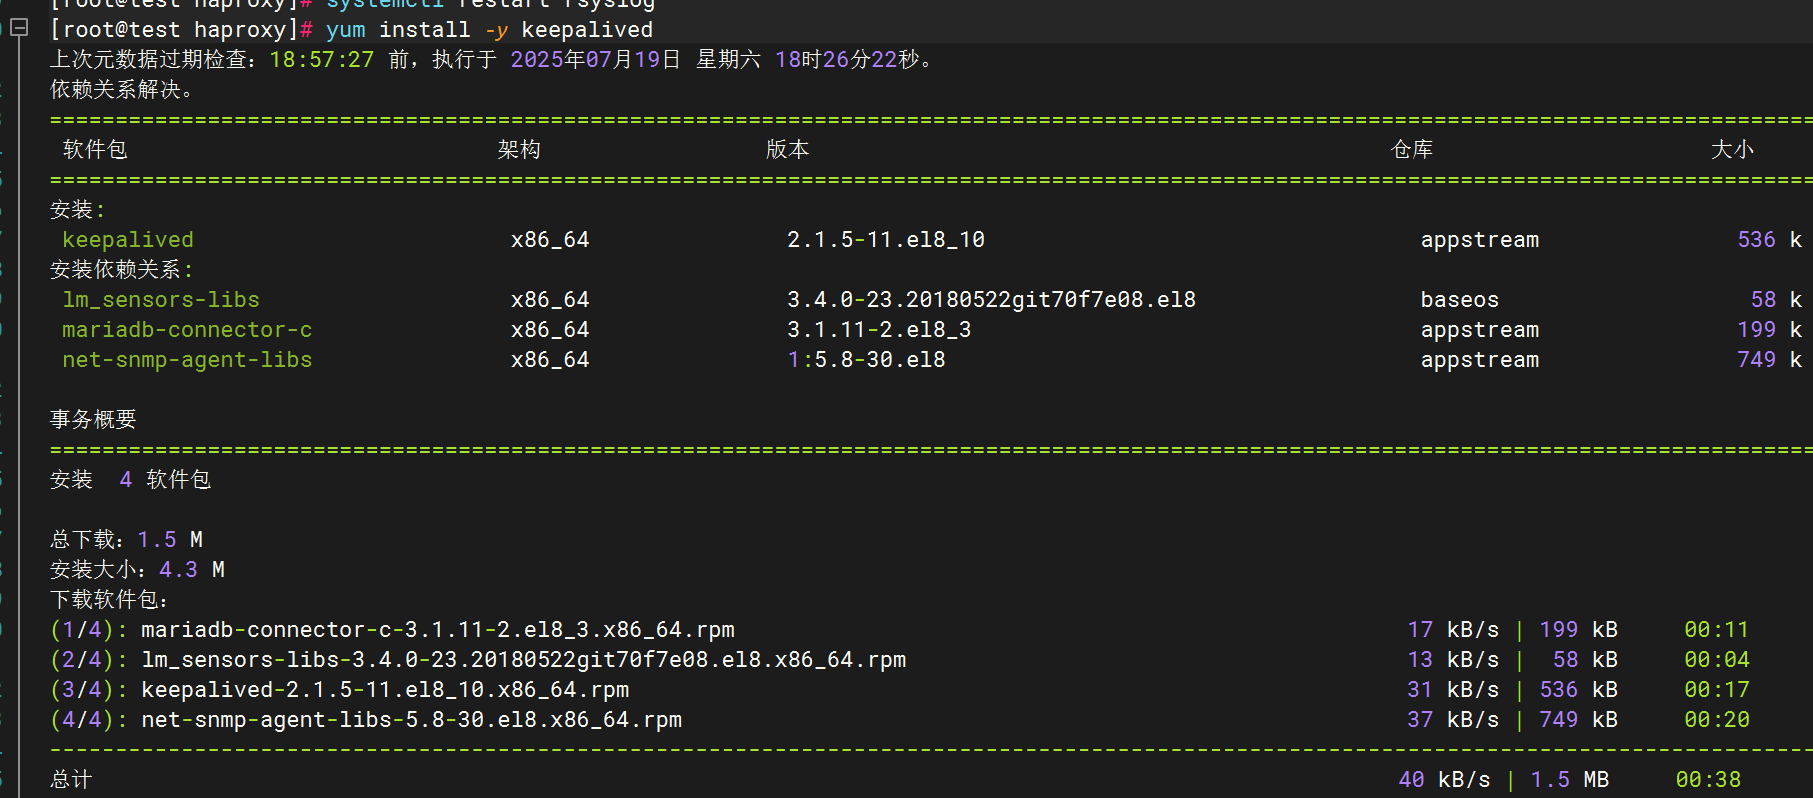
2.配置keepalived日志輸出
創建日志目錄
sudo mkdir -p /var/log/keepalived
sudo touch /var/log/keepalived/keepalived.log
sudo chown -R root:keepalived /var/log/keepalived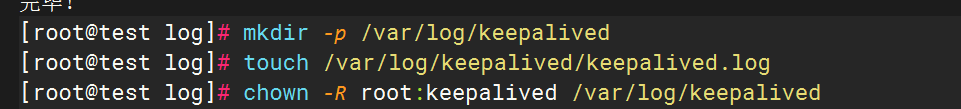
編輯keepalived配置文件,
vim /etc/sysconfig/keepalived添加以下行
KEEPALIVED_OPTIONS="-D -d -S 0"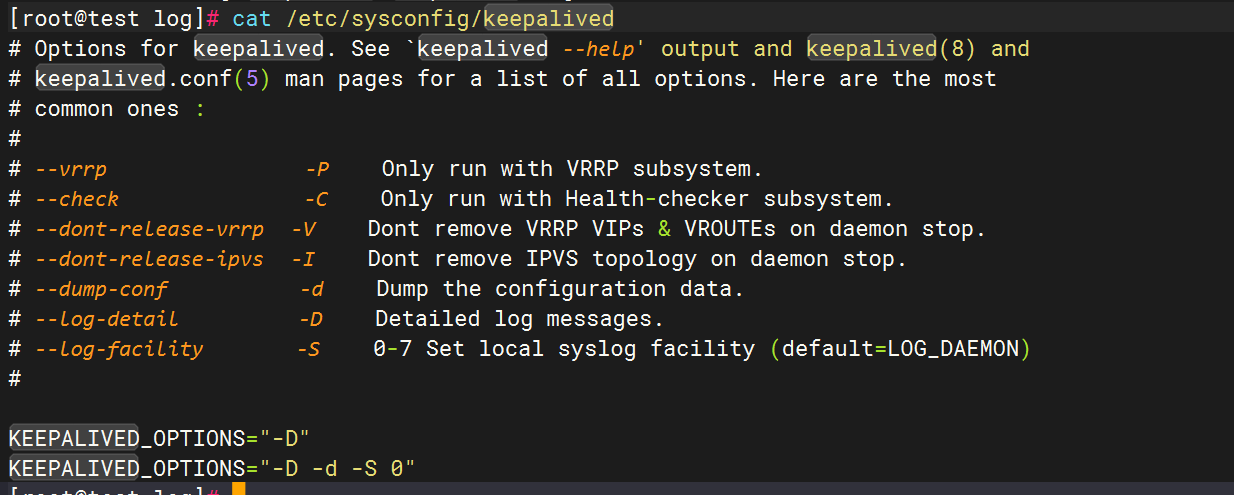
?配置rsyslog,在文件末尾添加
local0.* /var/log/keepalived/keepalived.log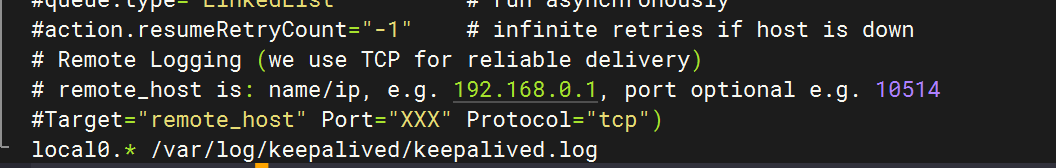
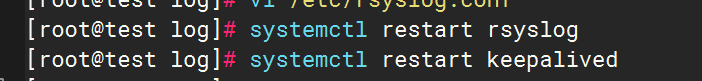
重啟服務
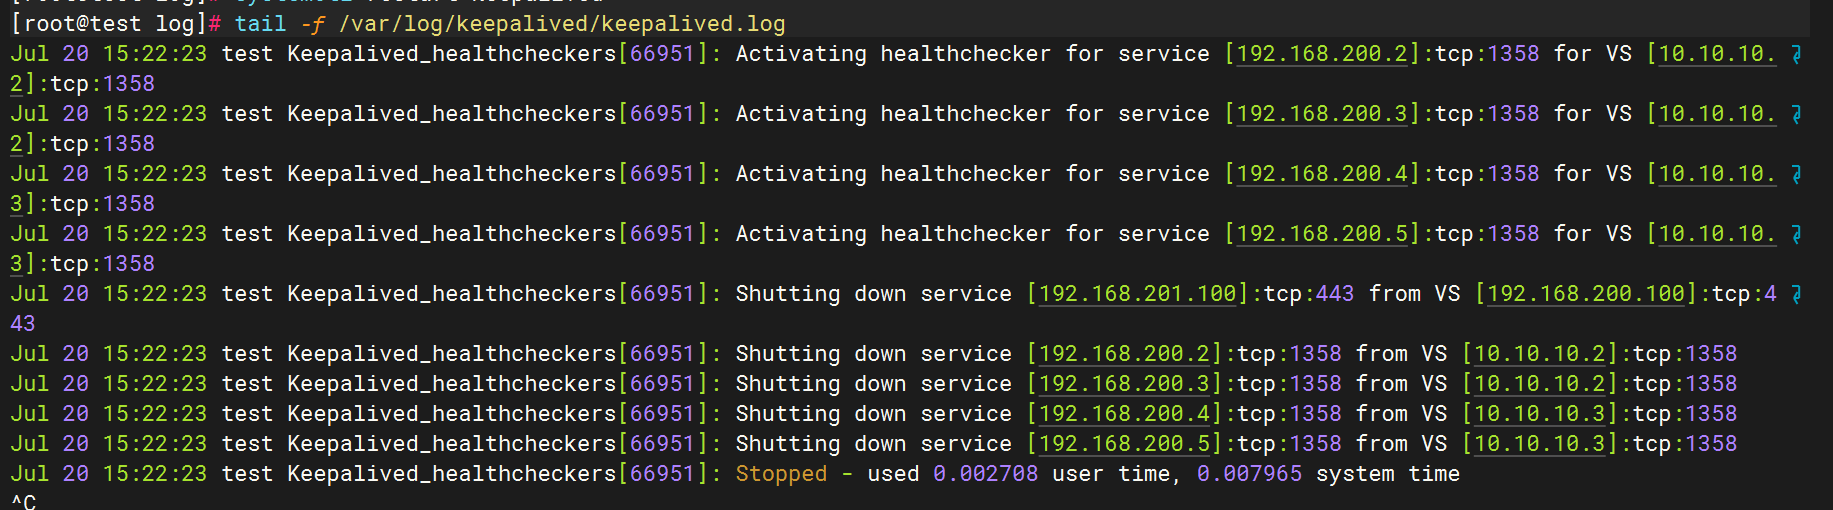
3.測試日志生成
4.修改filebeat文件
5.修改logstash文件
6.重啟全部服務,檢查kibana

十二.匯總
logstash
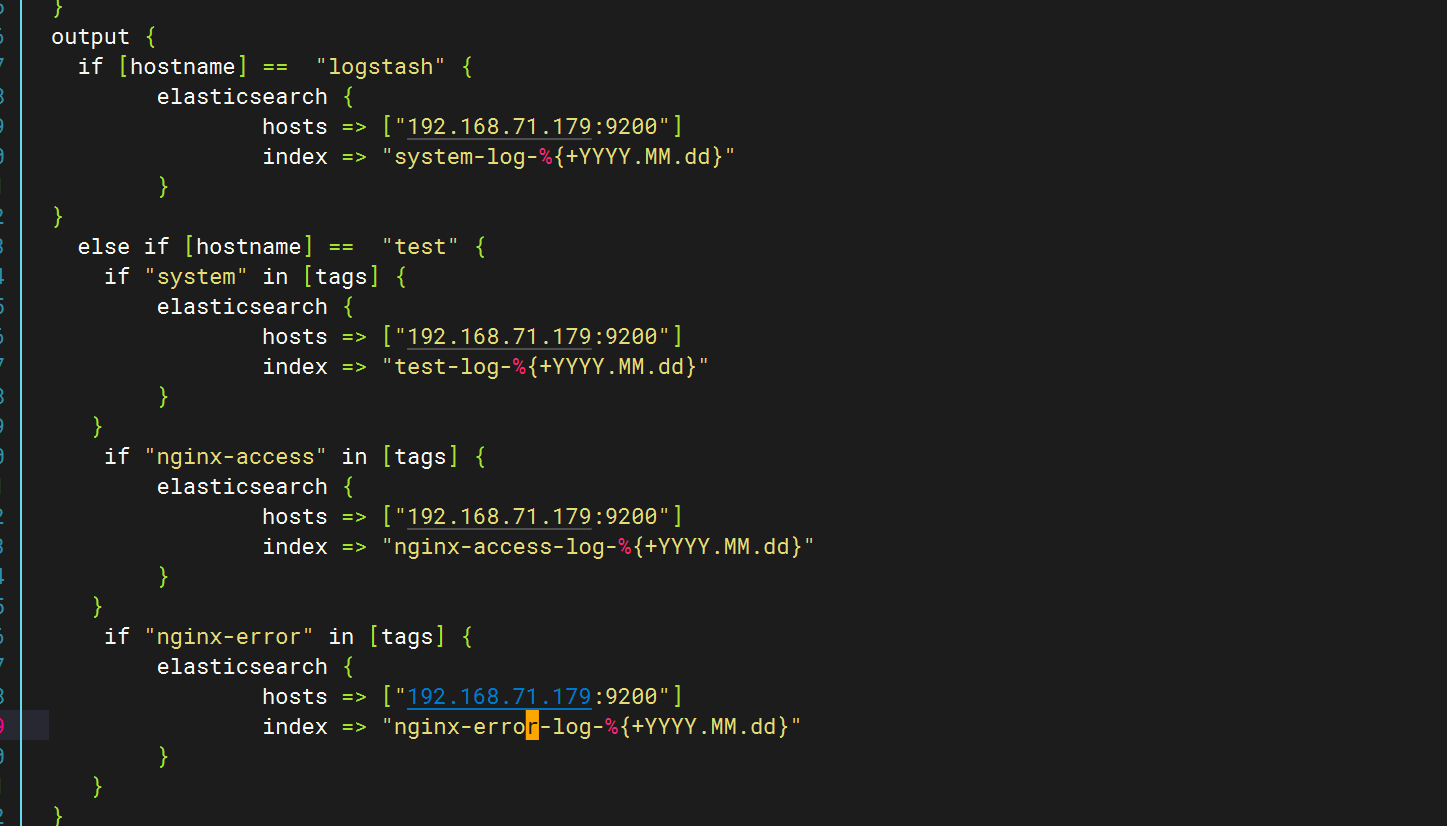
經過全部配置后,logstash上的pipline.conf全部內容如下
input {file {path => "/var/log/messages"start_position => "beginning"}beats {port => 5044}
}
filter {if [host][name] {mutate { add_field => { "hostname" => "%{[host][name]}" } }}else if [agent][hostname] {mutate { add_field => { "hostname" => "%{[agent][hostname]}" } }}else {mutate { add_field => { "hostname" => "%{host}" } }}
}
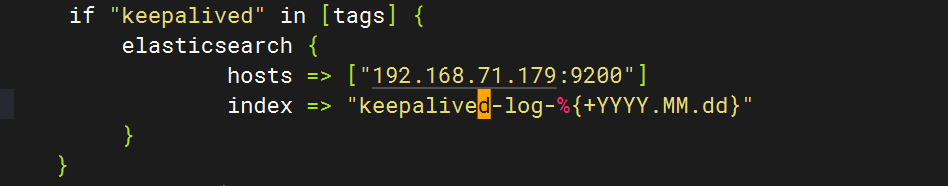
output {if [hostname] == "logstash" {elasticsearch {hosts => ["192.168.71.179:9200"]index => "system-log-%{+YYYY.MM.dd}"}
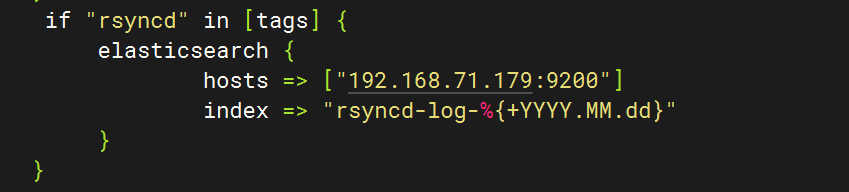
}else if [hostname] == "test" {if "system" in [tags] {elasticsearch {hosts => ["192.168.71.179:9200"]index => "test-log-%{+YYYY.MM.dd}"}}if "nginx-access" in [tags] {elasticsearch {hosts => ["192.168.71.179:9200"]index => "nginx-access-log-%{+YYYY.MM.dd}"}}if "nginx-error" in [tags] {elasticsearch {hosts => ["192.168.71.179:9200"]index => "nginx-error-log-%{+YYYY.MM.dd}"}}if "dhcp" in [tags] {elasticsearch {hosts => ["192.168.71.179:9200"]index => "dhcp-log-%{+YYYY.MM.dd}"}}if "dns" in [tags] {elasticsearch {hosts => ["192.168.71.179:9200"]index => "dns-log-%{+YYYY.MM.dd}"}}if "ssh" in [tags] {elasticsearch {hosts => ["192.168.71.179:9200"]index => "ssh-log-%{+YYYY.MM.dd}"}}if "rsyncd" in [tags] {elasticsearch {hosts => ["192.168.71.179:9200"]index => "rsyncd-log-%{+YYYY.MM.dd}"}}if "tomcat" in [tags] {elasticsearch {hosts => ["192.168.71.179:9200"]index => "tomcat-log-%{+YYYY.MM.dd}"}}
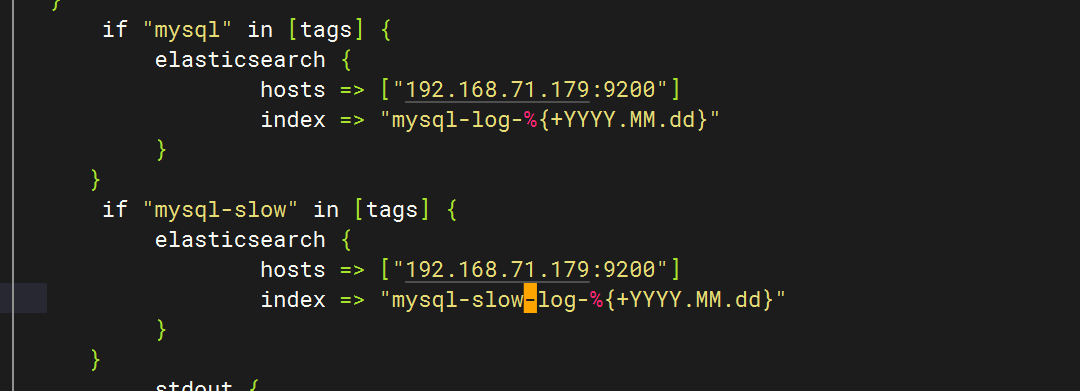
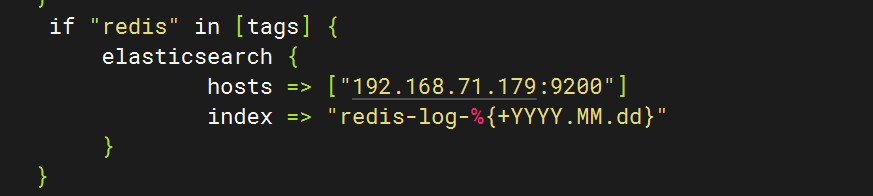
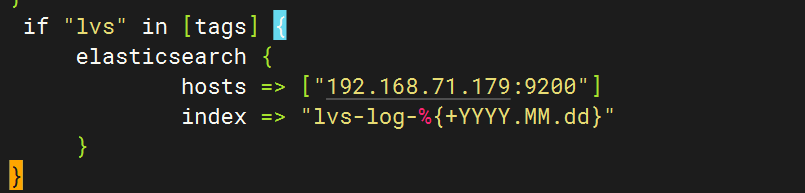
}if "mysql" in [tags] {elasticsearch {hosts => ["192.168.71.179:9200"]index => "mysql-log-%{+YYYY.MM.dd}"}}if "mysql-slow" in [tags] {elasticsearch {hosts => ["192.168.71.179:9200"]index => "mysql-slow-log-%{+YYYY.MM.dd}"}}if "nfs" in [tags] {elasticsearch {hosts => ["192.168.71.179:9200"]index => "nfs-log-%{+YYYY.MM.dd}"}}if "redis" in [tags] {elasticsearch {hosts => ["192.168.71.179:9200"]index => "redis-log-%{+YYYY.MM.dd}"}}if "lvs" in [tags] {elasticsearch {hosts => ["192.168.71.179:9200"]index => "lvs-log-%{+YYYY.MM.dd}"}}if "haproxy" in [tags] {elasticsearch {hosts => ["192.168.71.179:9200"]index => "haproxy-log-%{+YYYY.MM.dd}"}}if "keepalived" in [tags] {elasticsearch {hosts => ["192.168.71.179:9200"]index => "keepalived-log-%{+YYYY.MM.dd}"}}stdout {codec => rubydebug}
}filebeat
filebeat上的filebeat.yml內容如下
###################### Filebeat Configuration Example ########################## This file is an example configuration file highlighting only the most common
# options. The filebeat.reference.yml file from the same directory contains all the
# supported options with more comments. You can use it as a reference.
#
# You can find the full configuration reference here:
# https://www.elastic.co/guide/en/beats/filebeat/index.html# For more available modules and options, please see the filebeat.reference.yml sample
# configuration file.#=========================== Filebeat inputs =============================filebeat.inputs:# Each - is an input. Most options can be set at the input level, so
# you can use different inputs for various configurations.
# Below are the input specific configurations.
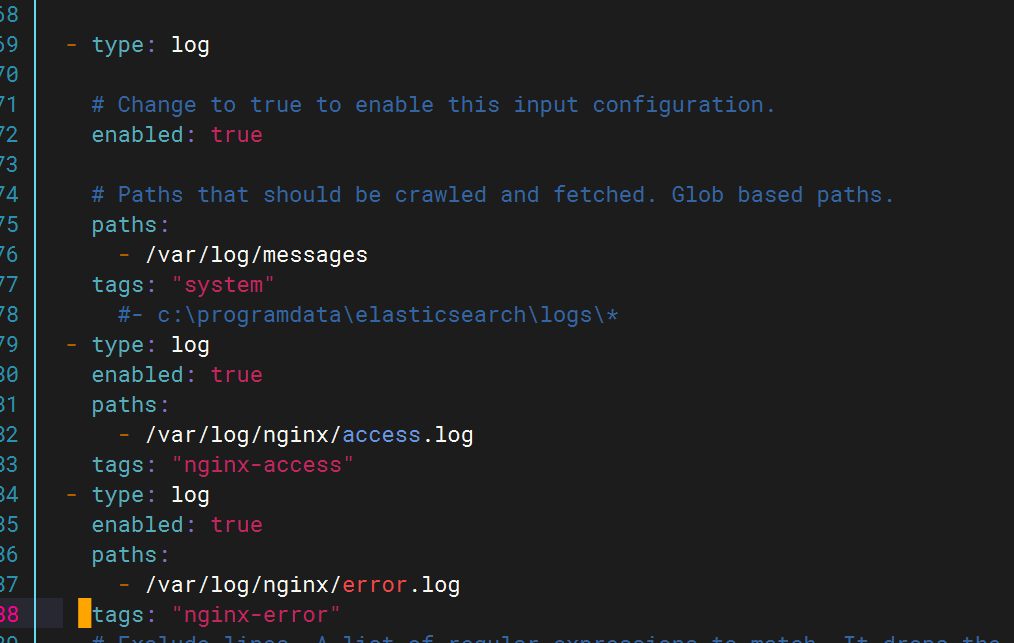
- type: log# Change to true to enable this input configuration.enabled: true# Paths that should be crawled and fetched. Glob based paths.paths:- /var/log/messages#tags: "system" #- c:\programdata\elasticsearch\logs\*
- type: logenabled: truepaths:- /var/log/nginx/access.logtags: "nginx-access"
- type: logenabled: truepaths:- /var/log/nginx/error.logtags: "nginx-error"
- type: logenabled: truepaths:- /var/log/dhcpd.logtags: "dhcp"
- type: logenabled: truepaths:- /var/log/named/dns.logtags: "dns"
- type: logenabled: truepaths:- /var/log/securetags: "ssh"
- type: logenabled: truepaths:- /var/log/rsyncd.logtags: "rsyncd"
- type: logenabled: truepaths:- /usr/local/tomcat8/logs/*.logtags: "tomcat"
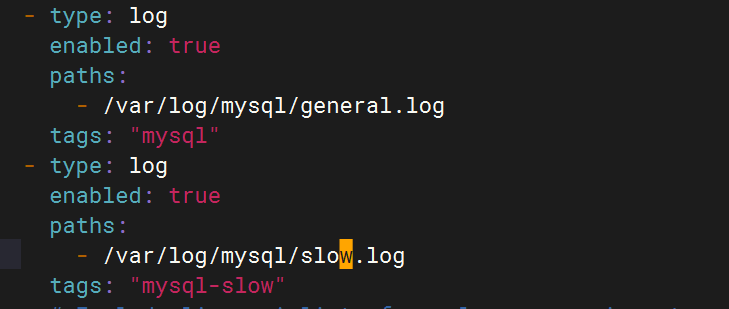
- type: logenabled: truepaths:- /var/log/mysql/general.logtags: "mysql"
- type: logenabled: truepaths:- /var/log/mysql/slow.logtags: "mysql-slow"
- type: logenabled: truepaths:- /var/log/nfs.logtags: "nfs"
- type: logenabled: truepaths:- /var/log/redis/redis.logtags: "redis"
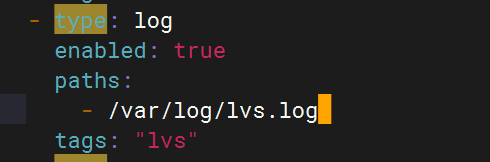
- type: logenabled: truepaths:- /var/log/lvs.logtags: "lvs"
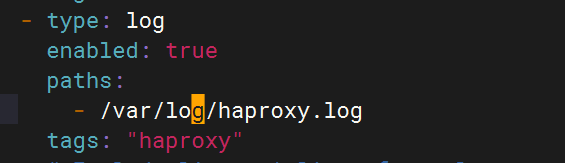
- type: logenabled: truepaths:- /var/log/haproxy.logtags: "haproxy"
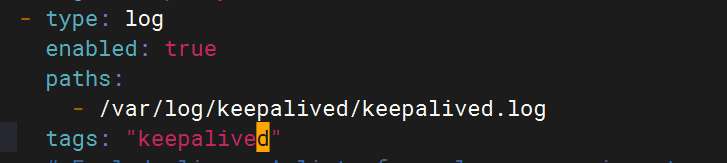
- type: logenabled: truepaths:- /var/log/keepalived/keepalived.logtags: "keepalived" # Exclude lines. A list of regular expressions to match. It drops the lines that are# matching any regular expression from the list.#exclude_lines: ['^DBG']# Include lines. A list of regular expressions to match. It exports the lines that are# matching any regular expression from the list.#include_lines: ['^ERR', '^WARN']# Exclude files. A list of regular expressions to match. Filebeat drops the files that# are matching any regular expression from the list. By default, no files are dropped.#exclude_files: ['.gz$']# Optional additional fields. These fields can be freely picked# to add additional information to the crawled log files for filtering#fields:# level: debug# review: 1### Multiline options# Multiline can be used for log messages spanning multiple lines. This is common# for Java Stack Traces or C-Line Continuation# The regexp Pattern that has to be matched. The example pattern matches all lines starting with [#multiline.pattern: ^\[# Defines if the pattern set under pattern should be negated or not. Default is false.#multiline.negate: false# Match can be set to "after" or "before". It is used to define if lines should be append to a pattern# that was (not) matched before or after or as long as a pattern is not matched based on negate.# Note: After is the equivalent to previous and before is the equivalent to to next in Logstash#multiline.match: after#============================= Filebeat modules ===============================filebeat.config.modules:# Glob pattern for configuration loadingpath: ${path.config}/modules.d/*.yml# Set to true to enable config reloadingreload.enabled: false# Period on which files under path should be checked for changes#reload.period: 10s#==================== Elasticsearch template setting ==========================setup.template.settings:index.number_of_shards: 1#index.codec: best_compression#_source.enabled: false#================================ General =====================================# The name of the shipper that publishes the network data. It can be used to group
# all the transactions sent by a single shipper in the web interface.
#name:# The tags of the shipper are included in their own field with each
# transaction published.
#tags: ["service-X", "web-tier"]# Optional fields that you can specify to add additional information to the
# output.
#fields:
# env: staging#============================== Dashboards =====================================
# These settings control loading the sample dashboards to the Kibana index. Loading
# the dashboards is disabled by default and can be enabled either by setting the
# options here or by using the `setup` command.
#setup.dashboards.enabled: false# The URL from where to download the dashboards archive. By default this URL
# has a value which is computed based on the Beat name and version. For released
# versions, this URL points to the dashboard archive on the artifacts.elastic.co
# website.
#setup.dashboards.url:#============================== Kibana =====================================# Starting with Beats version 6.0.0, the dashboards are loaded via the Kibana API.
# This requires a Kibana endpoint configuration.
setup.kibana:# Kibana Host# Scheme and port can be left out and will be set to the default (http and 5601)# In case you specify and additional path, the scheme is required: http://localhost:5601/path# IPv6 addresses should always be defined as: https://[2001:db8::1]:5601#host: "localhost:5601"# Kibana Space ID# ID of the Kibana Space into which the dashboards should be loaded. By default,# the Default Space will be used.#space.id:#============================= Elastic Cloud ==================================# These settings simplify using filebeat with the Elastic Cloud (https://cloud.elastic.co/).# The cloud.id setting overwrites the `output.elasticsearch.hosts` and
# `setup.kibana.host` options.
# You can find the `cloud.id` in the Elastic Cloud web UI.
#cloud.id:# The cloud.auth setting overwrites the `output.elasticsearch.username` and
# `output.elasticsearch.password` settings. The format is `<user>:<pass>`.
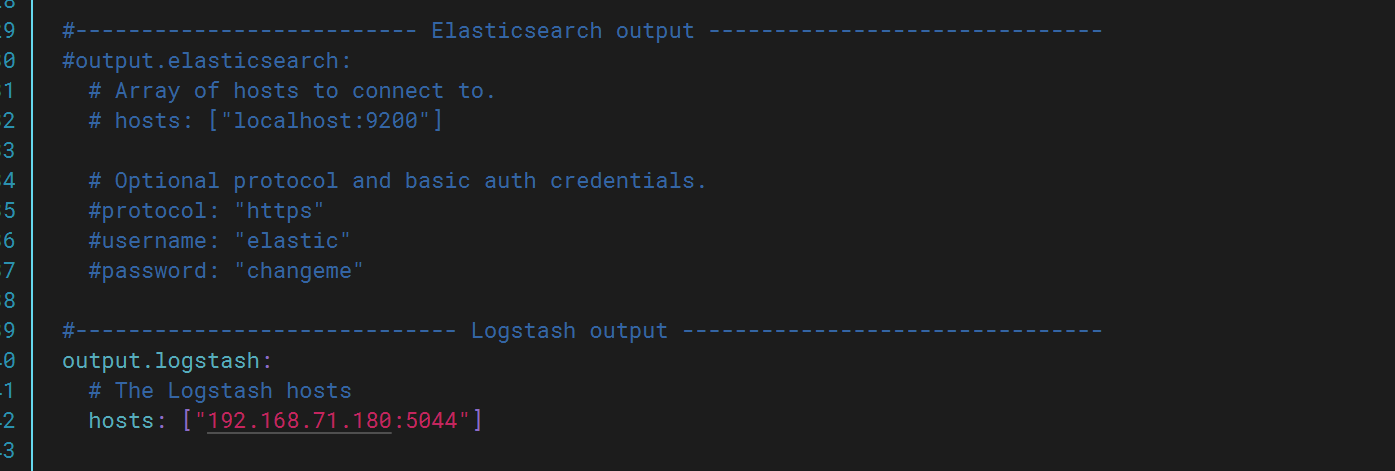
#cloud.auth:#================================ Outputs =====================================# Configure what output to use when sending the data collected by the beat.#-------------------------- Elasticsearch output ------------------------------
#output.elasticsearch:
# # Array of hosts to connect to.
# # hosts: ["localhost:9200"]
# hosts: ["192.168.71.179:9200"]
# indices:
# - index: "LVS-logs"
# when:
# contains:
# { "message": "ipvs"}
#setup.ilm.enabled: false
#setup.template.name: "LVS"
#setup.template.pattern: "LVS-*"# Optional protocol and basic auth credentials.#protocol: "https"#username: "elastic"#password: "changeme"#----------------------------- Logstash output --------------------------------
output.logstash:# The Logstash hostshosts: ["192.168.71.180:5044"]# Optional SSL. By default is off.# List of root certificates for HTTPS server verifications#ssl.certificate_authorities: ["/etc/pki/root/ca.pem"]# Certificate for SSL client authentication#ssl.certificate: "/etc/pki/client/cert.pem"# Client Certificate Key#ssl.key: "/etc/pki/client/cert.key"#================================ Processors =====================================# Configure processors to enhance or manipulate events generated by the beat.processors:- add_host_metadata: ~- add_cloud_metadata: ~#================================ Logging =====================================# Sets log level. The default log level is info.
# Available log levels are: error, warning, info, debug
#logging.level: debug# At debug level, you can selectively enable logging only for some components.
# To enable all selectors use ["*"]. Examples of other selectors are "beat",
# "publish", "service".
#logging.selectors: ["*"]#============================== Xpack Monitoring ===============================
# filebeat can export internal metrics to a central Elasticsearch monitoring
# cluster. This requires xpack monitoring to be enabled in Elasticsearch. The
# reporting is disabled by default.# Set to true to enable the monitoring reporter.
#xpack.monitoring.enabled: false# Uncomment to send the metrics to Elasticsearch. Most settings from the
# Elasticsearch output are accepted here as well. Any setting that is not set is
# automatically inherited from the Elasticsearch output configuration, so if you
# have the Elasticsearch output configured, you can simply uncomment the
# following line.
#xpack.monitoring.elasticsearch:#================================= Migration ==================================# This allows to enable 6.7 migration aliases
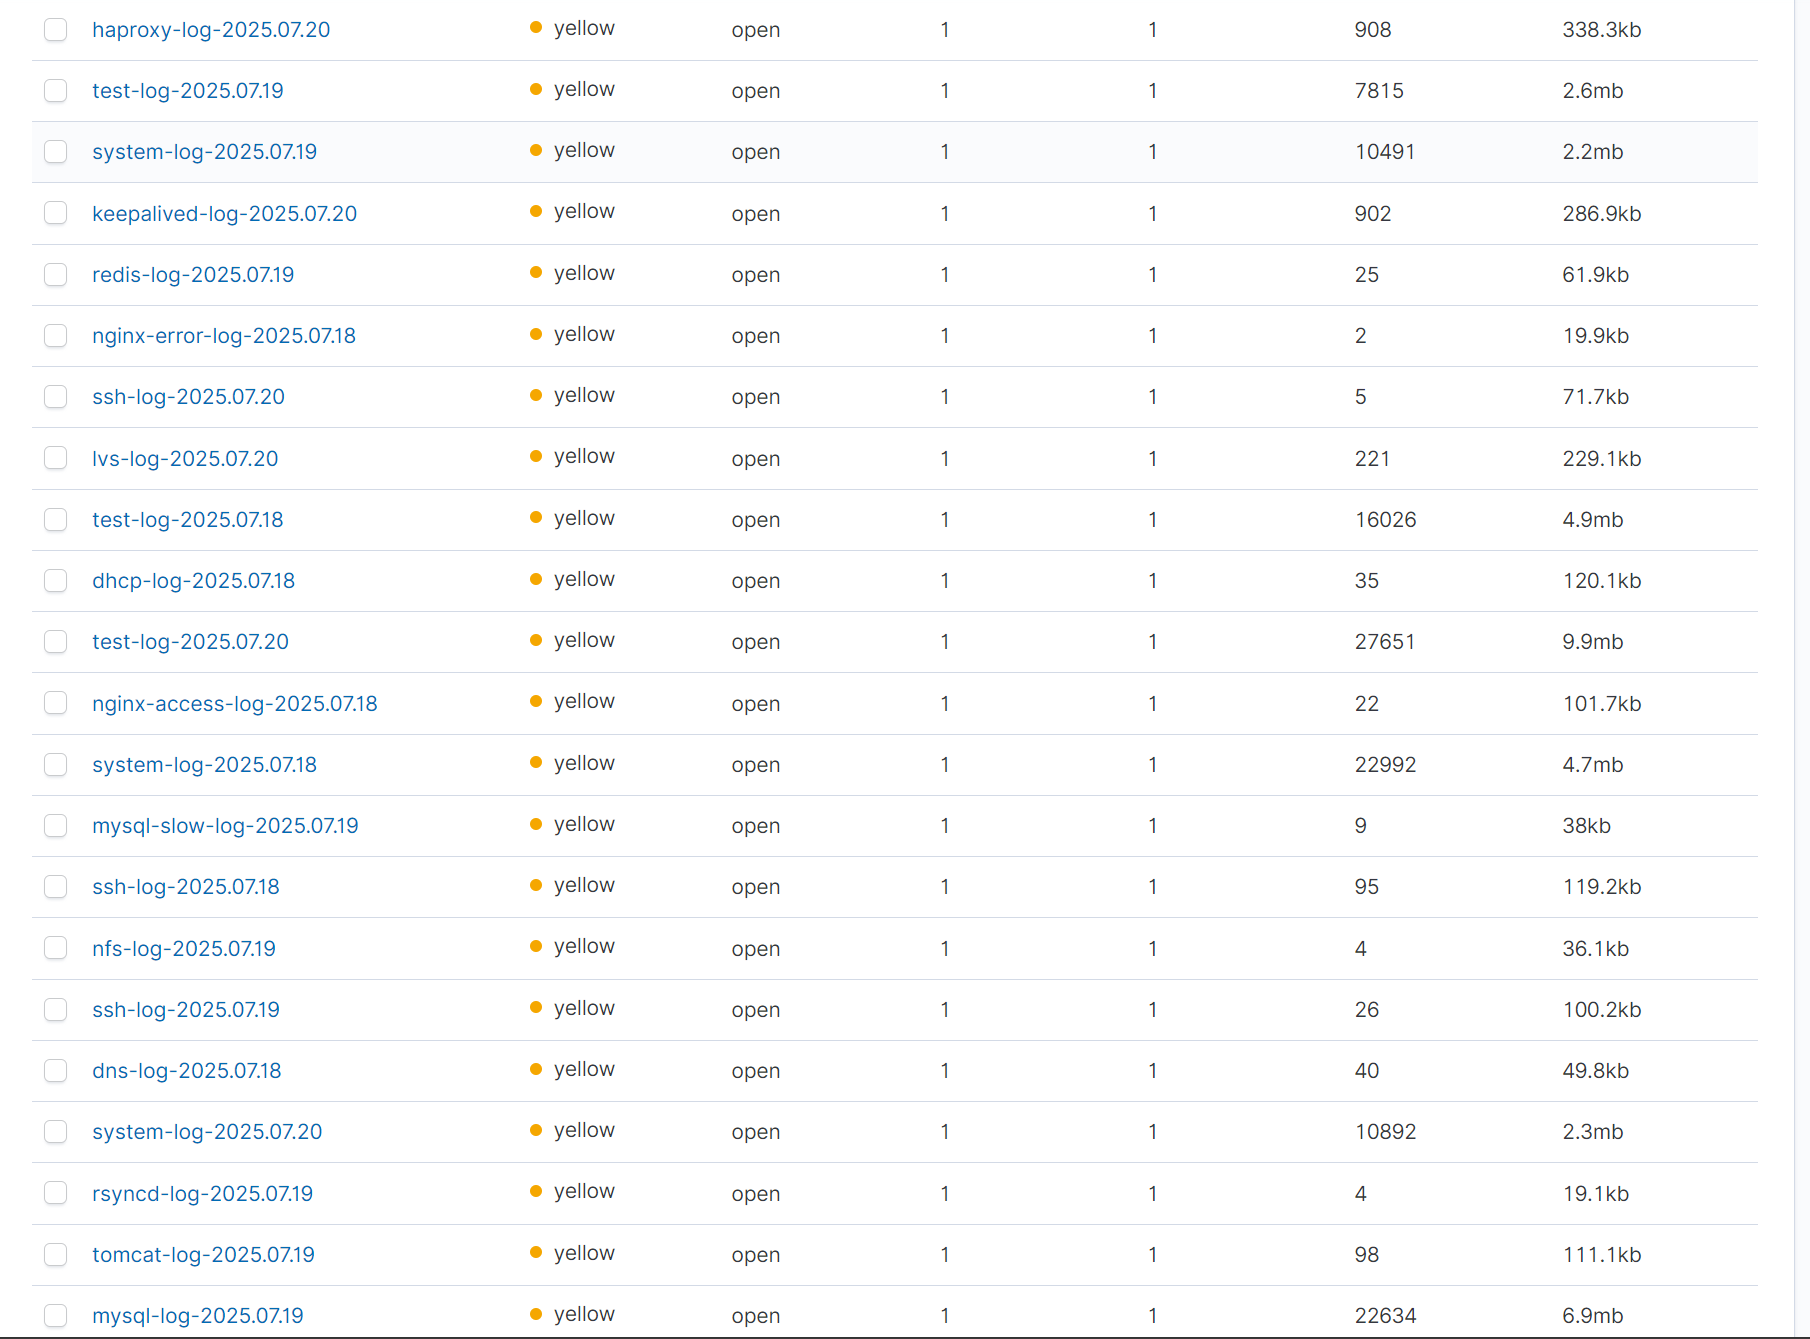
#migration.6_to_7.enabled: truekibana
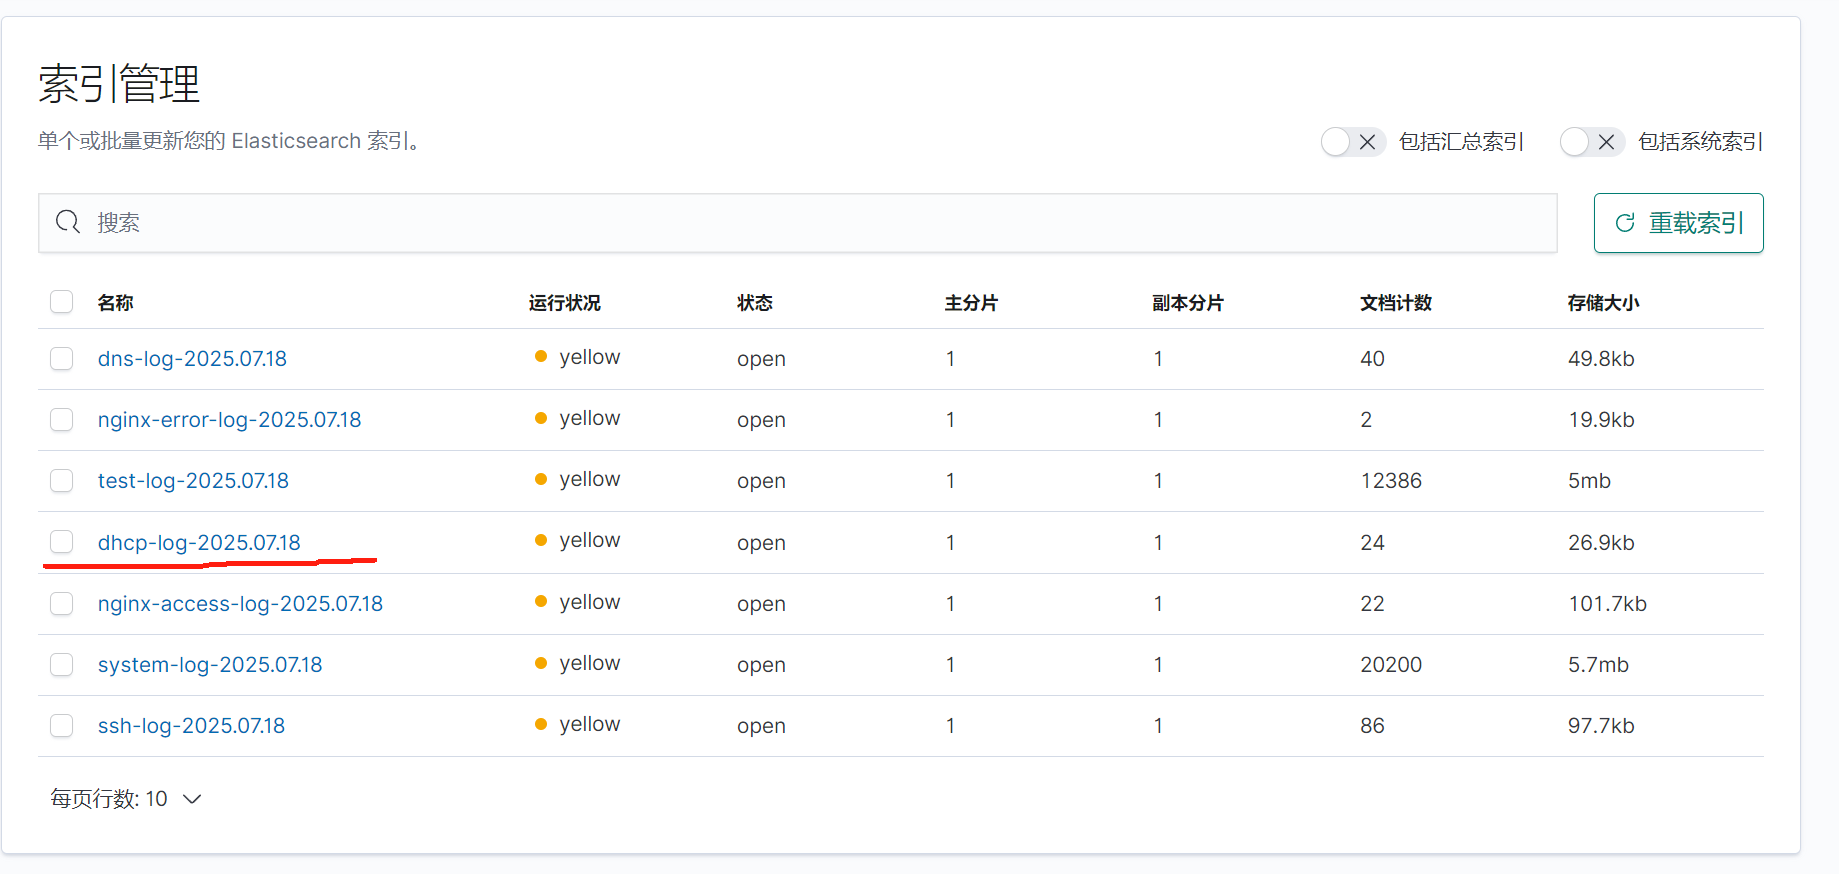
kibana總覽
 ?
?


![[2025CVPR-目標檢測方向]FSHNet:一種用于3D物體檢測的全稀疏混合網絡。](http://pic.xiahunao.cn/[2025CVPR-目標檢測方向]FSHNet:一種用于3D物體檢測的全稀疏混合網絡。)


 視頻教程 - 主頁-微博點贊量Top6實現)

機器學習小白入門YOLOv:YOLOv8-cls 模型微調實操)


)
——鏈接預測在社交網絡分析中的應用)