前端性能分析大全
前端性能優化
LightHouse性能評分
性能指標監控分析
瀏覽器加載資源的全過程性能指標分析
性能指標
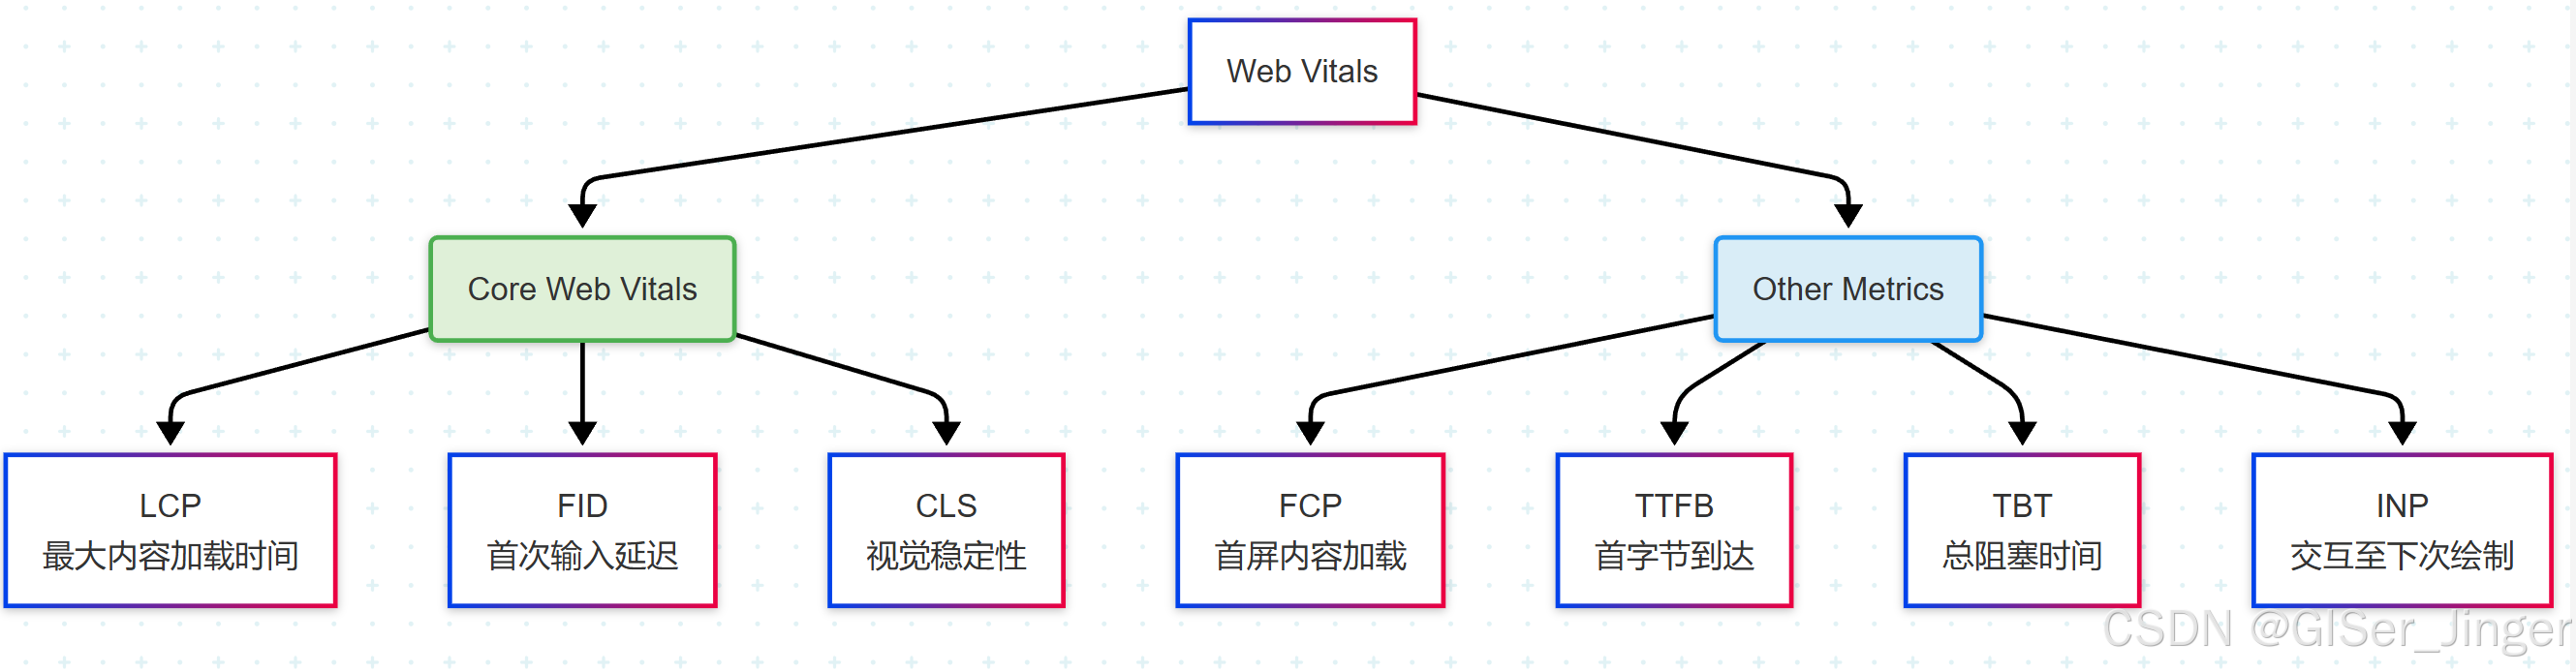
在實現性能監控前,先了解Web Vitals涉及的常見的性能指標
Web Vitals 是由 Google 推出的網頁用戶體驗衡量指標體系,旨在幫助開發者量化和優化網頁在實際用戶終端上的性能體驗。Web Vitals 強調“以用戶為中心”的度量,而不是純技術層面的加載時間。
要按 先后順序(時間維度) 梳理 Web Vitals,可以從網頁加載的生命周期出發,把每個指標放入其發生時機對應的階段中。這樣更利于理解用戶體驗的演變和指標采集的邏輯。
🧭 一、加載過程的五大階段
[1] 網絡響應階段
[2] 首次渲染階段
[3] 內容加載階段
[4] 用戶交互階段
[5] 頁面穩定階段
📊 二、Web Vitals 指標按時間順序梳理
| 階段 | 指標名 | 含義 | 時機 |
|---|---|---|---|
| 1?? 網絡響應 | TTFB (Time to First Byte) | 首字節到達 | 瀏覽器請求后,接收到第一個響應字節 |
| 2?? 首次渲染 | FCP (First Contentful Paint) | 首次繪制文字/圖像 | 頁面開始有內容渲染(非白屏) |
| 3?? 主內容加載 | LCP (Largest Contentful Paint) | 最大可視內容渲染完成 | 用戶感知“頁面加載完” |
| 4?? 用戶首次交互 | FID (First Input Delay) | 用戶首次點擊的響應延遲 | 用戶第一次交互,直到瀏覽器處理事件的延遲 |
| 5?? 頁面穩定 | CLS (Cumulative Layout Shift) | 布局跳動 | 頁面是否因為圖片/廣告等加載而抖動 |
🧬 三、時間線圖(邏輯順序)
時間單位為毫秒。
TTFB最早,CLS貫穿整個加載過程。
🔁 四、簡潔記憶順序口訣
💡「先 TTFB,見 FCP;看大圖,用 LCP;首操作,測 FID;別亂跳,查 CLS」
🛠 五、指標采集時機小貼士
| 指標 | 采集方式 | 推薦 API |
|---|---|---|
| TTFB | performance.timing.responseStart - navigationStart | Navigation Timing |
| FCP | PerformanceObserver 監聽 paint | PerformancePaintTiming |
| LCP | PerformanceObserver 監聽 largest-contentful-paint | LCP Entry |
| FID | 真實用戶交互產生的事件延遲 | Event Timing API |
| CLS | PerformanceObserver 監聽 layout-shift | LayoutShift Entry |
🧭 六、總結為時序流圖(Mermaid)
指標監控
PerformanceObserver
PerformanceObserver 是 Performance API 中用于監聽性能條目變化的核心工具。它可以在網頁運行過程中,異步捕獲新生成的性能條目,而不是一開始就調用 performance.getEntries() 拿“舊數據”。
一、PerformanceObserver 的作用
它允許開發者:
- 監聽網頁運行中
出現的性能條目(如資源加載、繪制、打點、長任務等) 做出動態響應(如打日志、發送埋點數據)- 支持指定監聽的
entryTypes,如["resource"],["mark", "measure"]
二、使用方式
1. 創建實例
const observer = new PerformanceObserver((list, observer) => {const entries = list.getEntries();for (const entry of entries) {console.log(entry.name, entry.entryType, entry.startTime, entry.duration);}
});
2. 啟動監聽
observer.observe({entryTypes: ['mark', 'measure', 'resource']
});
entryTypes是監聽的條目類型數組。
三、常用方法
| 方法 | 說明 |
|---|---|
observe(options) | 開始監聽性能條目 |
disconnect() | 停止監聽 |
takeRecords() | 獲取當前緩沖區的所有性能條目并清空緩沖區 |
四、選項說明
observe(options)
observer.observe({entryTypes: ['resource', 'paint']
});
或使用過時寫法(不推薦):
observer.observe({type: 'resource',buffered: true
});
參數說明:
entryTypes: 性能條目的類型(推薦)type: 單一類型(不推薦)buffered: 是否包括已存在的歷史條目(true會包含之前的記錄)
五、支持的 entryType(性能條目類型)
| 類型 | 含義 |
|---|---|
resource | 外部資源加載耗時 |
mark | 用戶自定義打點 |
measure | 用戶定義的測量點 |
paint | 首次繪制(first-paint, first-contentful-paint) |
navigation | 頁面導航 |
longtask | 長任務(如 JS 卡頓) |
element | 關鍵可視元素曝光(需要配置) |
largest-contentful-paint | 最大內容繪制時間 |
layout-shift | 布局偏移(CLS) |
六、典型使用場景
- 監聽
資源加載情況(如 img、script) - 監聽
FCP、LCP、CLS、Long Tasks,用于Web Vitals 性能分析 - 異步
獲取自定義打點結果 - 在 SPA 頁面做
性能埋點
七、注意事項
PerformanceObserver是異步的:不會立即收到記錄。- 使用
buffered: true可獲取已經發生的記錄(舊數據),用于首次加載打點。 - 頁面進入后臺或關閉時,需要調用
takeRecords()收集剩余數據。 - 一些條目需要在支持的瀏覽器中開啟對應實驗性特性(如
longtask)。
八、Mermaid 類圖詳解 PerformanceObserver
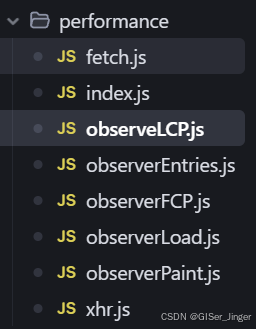
九、具體實現
import { lazyReportBatch } from '../report';
const originalFetch = window.fetch;
function overwriteFetch() {window.fetch = function  newFetch(url, config) {const startTime = Date.now();const reportData = {type: 'performance',subType: 'fetch',url,startTime,method: config.method,}return originalFetch(url, config).then((res) => {const endTime = Date.now();reportData.endTime = endTime;reportData.duration = endTime - startTime;const data = res.clone();reportData.status = data.status;reportData.success = data.ok;// todo 上報數據lazyReportBatch(reportData);return res;}).catch((err) => {const endTime = Date.now();reportData.endTime = endTime;reportData.duration = endTime - startTime;reportData.status = 0;reportData.success = false;// todo 上報數據lazyReportBatch(reportData);});}
}
export default function fetch() {overwriteFetch();
}
//監控FP
import { lazyReportBatch } from '../report';
export default function observerPaint() {const entryHandler = (list) => {for (const entry of list.getEntries()) {if (entry.name === 'first-paint') {observer.disconnect();const json = entry.toJSON();console.log(json);const reportData = {...json,type: 'performance',subType: entry.name,pageUrl: window.location.href,}// 發送數據 todo;lazyReportBatch(reportData);}}}// 統計和計算fp的時間const observer = new PerformanceObserver(entryHandler);// buffered: true 確保觀察到所有paint事件observer.observe({type: 'paint', buffered: true});}
//監控FCP
import { lazyReportBatch } from '../report';
export default function observerFCP() {const entryHandler = (list) => {for (const entry of list.getEntries()) {if (entry.name === 'first-contentful-paint') {observer.disconnect();const json = entry.toJSON();console.log(json);const reportData = {...json,type: 'performance',subType: entry.name,pageUrl: window.location.href,}// 發送數據 todo;lazyReportBatch(reportData);}}}// 統計和計算fcp的時間const observer = new PerformanceObserver(entryHandler);// buffered: true 確保觀察到所有paint事件observer.observe({type: 'paint', buffered: true});
}
//監控LCP
import { lazyReportBatch } from '../report';
export default function observerLCP() {if (typeof PerformanceObserver === 'undefined' ||!PerformanceObserver.supportedEntryTypes.includes('largest-contentful-paint')) {console.warn('LCP not supported in this browser.');return;}const entryHandler = (list,observer) => {if (observer) {observer.disconnect();} for (const entry of list.getEntries()) {const json = entry.toJSON();//console.log(json);const reportData = {...json,type: 'performance',subType: entry.name,pageUrl: window.location.href,}console.log(reportData);// 發送數據 todo;//lazyReportBatch(reportData);}}// 統計和計算lcp的時間const observer = new PerformanceObserver(entryHandler);// buffered: true 確保觀察到所有paint事件observer.observe({type: 'largest-contentful-paint', buffered: true});
}
import { lazyReportBatch } from '../report';
export default function observerLoad () {window.addEventListener('pageShow', function (event) {requestAnimationFrame(() =>{['load'].forEach((type) => {const reportData = {type: 'performance',subType: type,pageUrl: window.location.href,startTime: performance.now()- event.timeStamp}// 發送數據lazyReportBatch(reportData);});}, true);});
}import { lazyReportBatch } from '../report';
export const originalProto = XMLHttpRequest.prototype;
export const originalSend = originalProto.send;
export const originalOpen = originalProto.open;function overwriteOpenAndSend() {originalProto.open = function newOpen(...args) {this.url = args[1];this.method = args[0];originalOpen.apply(this, args);}originalProto.send = function newSend(...args) {this.startTime = Date.now();const onLoaded = () => {this.endTime = Date.now();this.duration = this.endTime - this.startTime;const { url, method , startTime, endTime, duration, status} = this;const reportData = {status,duration,startTime,endTime,url,method: method.toUpperCase(),type: 'performance',success: status >= 200 && status < 300,subType: 'xhr'}// todo 發送數據lazyReportBatch(reportData);this.removeEventListener('loadend', onLoaded, true);}this.addEventListener('loadend', onLoaded, true);originalSend.apply(this, args);}}
export default function xhr() {overwriteOpenAndSend();
}十、其他實現:Web Vitals
其他實現:Web Vitals 是 Google 提出的一組衡量網站用戶體驗關鍵質量的指標,特別關注 加載性能、交互響應、視覺穩定性。
監控上報(?)
數據上報
有三種上報方式:
- imgRequest:以
圖片打點的方式 - beaconRequest:通過
navigator.sendBeacon發送 - xhrRequest:使用
XMLHttpRequest(兼容方式)
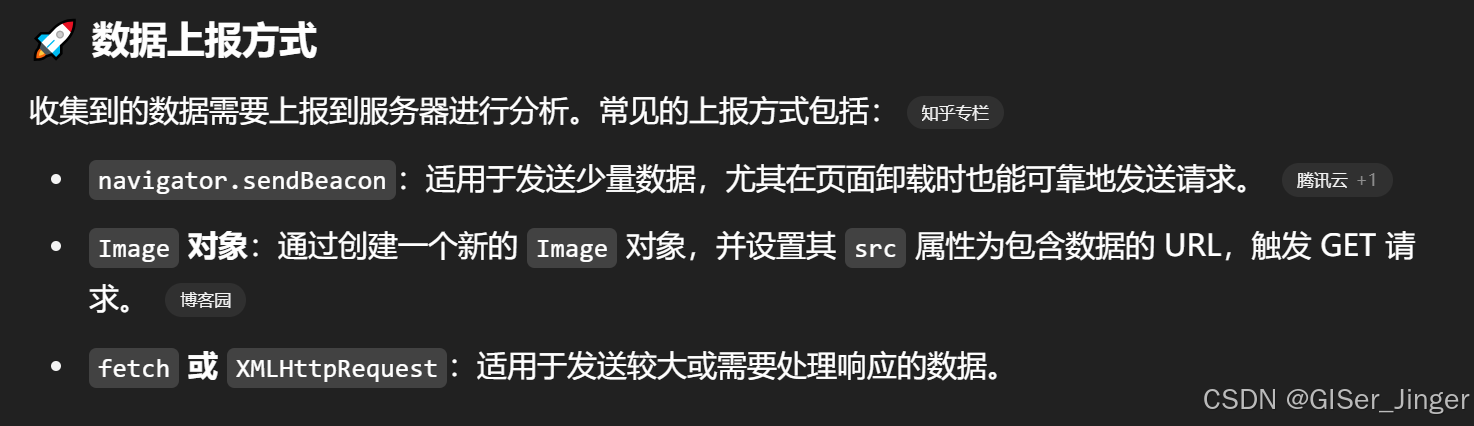
如果使用 lazyReportBatch,則會緩存數據并按批量上傳。多數請求都通過 requestIdleCallback 實現性能友好的空閑發送。
import config from './config';
import {generateUniqueId} from './utils';
import {addCache, getCache, clearCache} from './cache';
export const originalProto = XMLHttpRequest.prototype;
export const originalOpen = XMLHttpRequest.prototype.open;
export const originalSend = XMLHttpRequest.prototype.send;
export function isSupportSendBeacon() {return 'sendBeacon' in navigator;
}
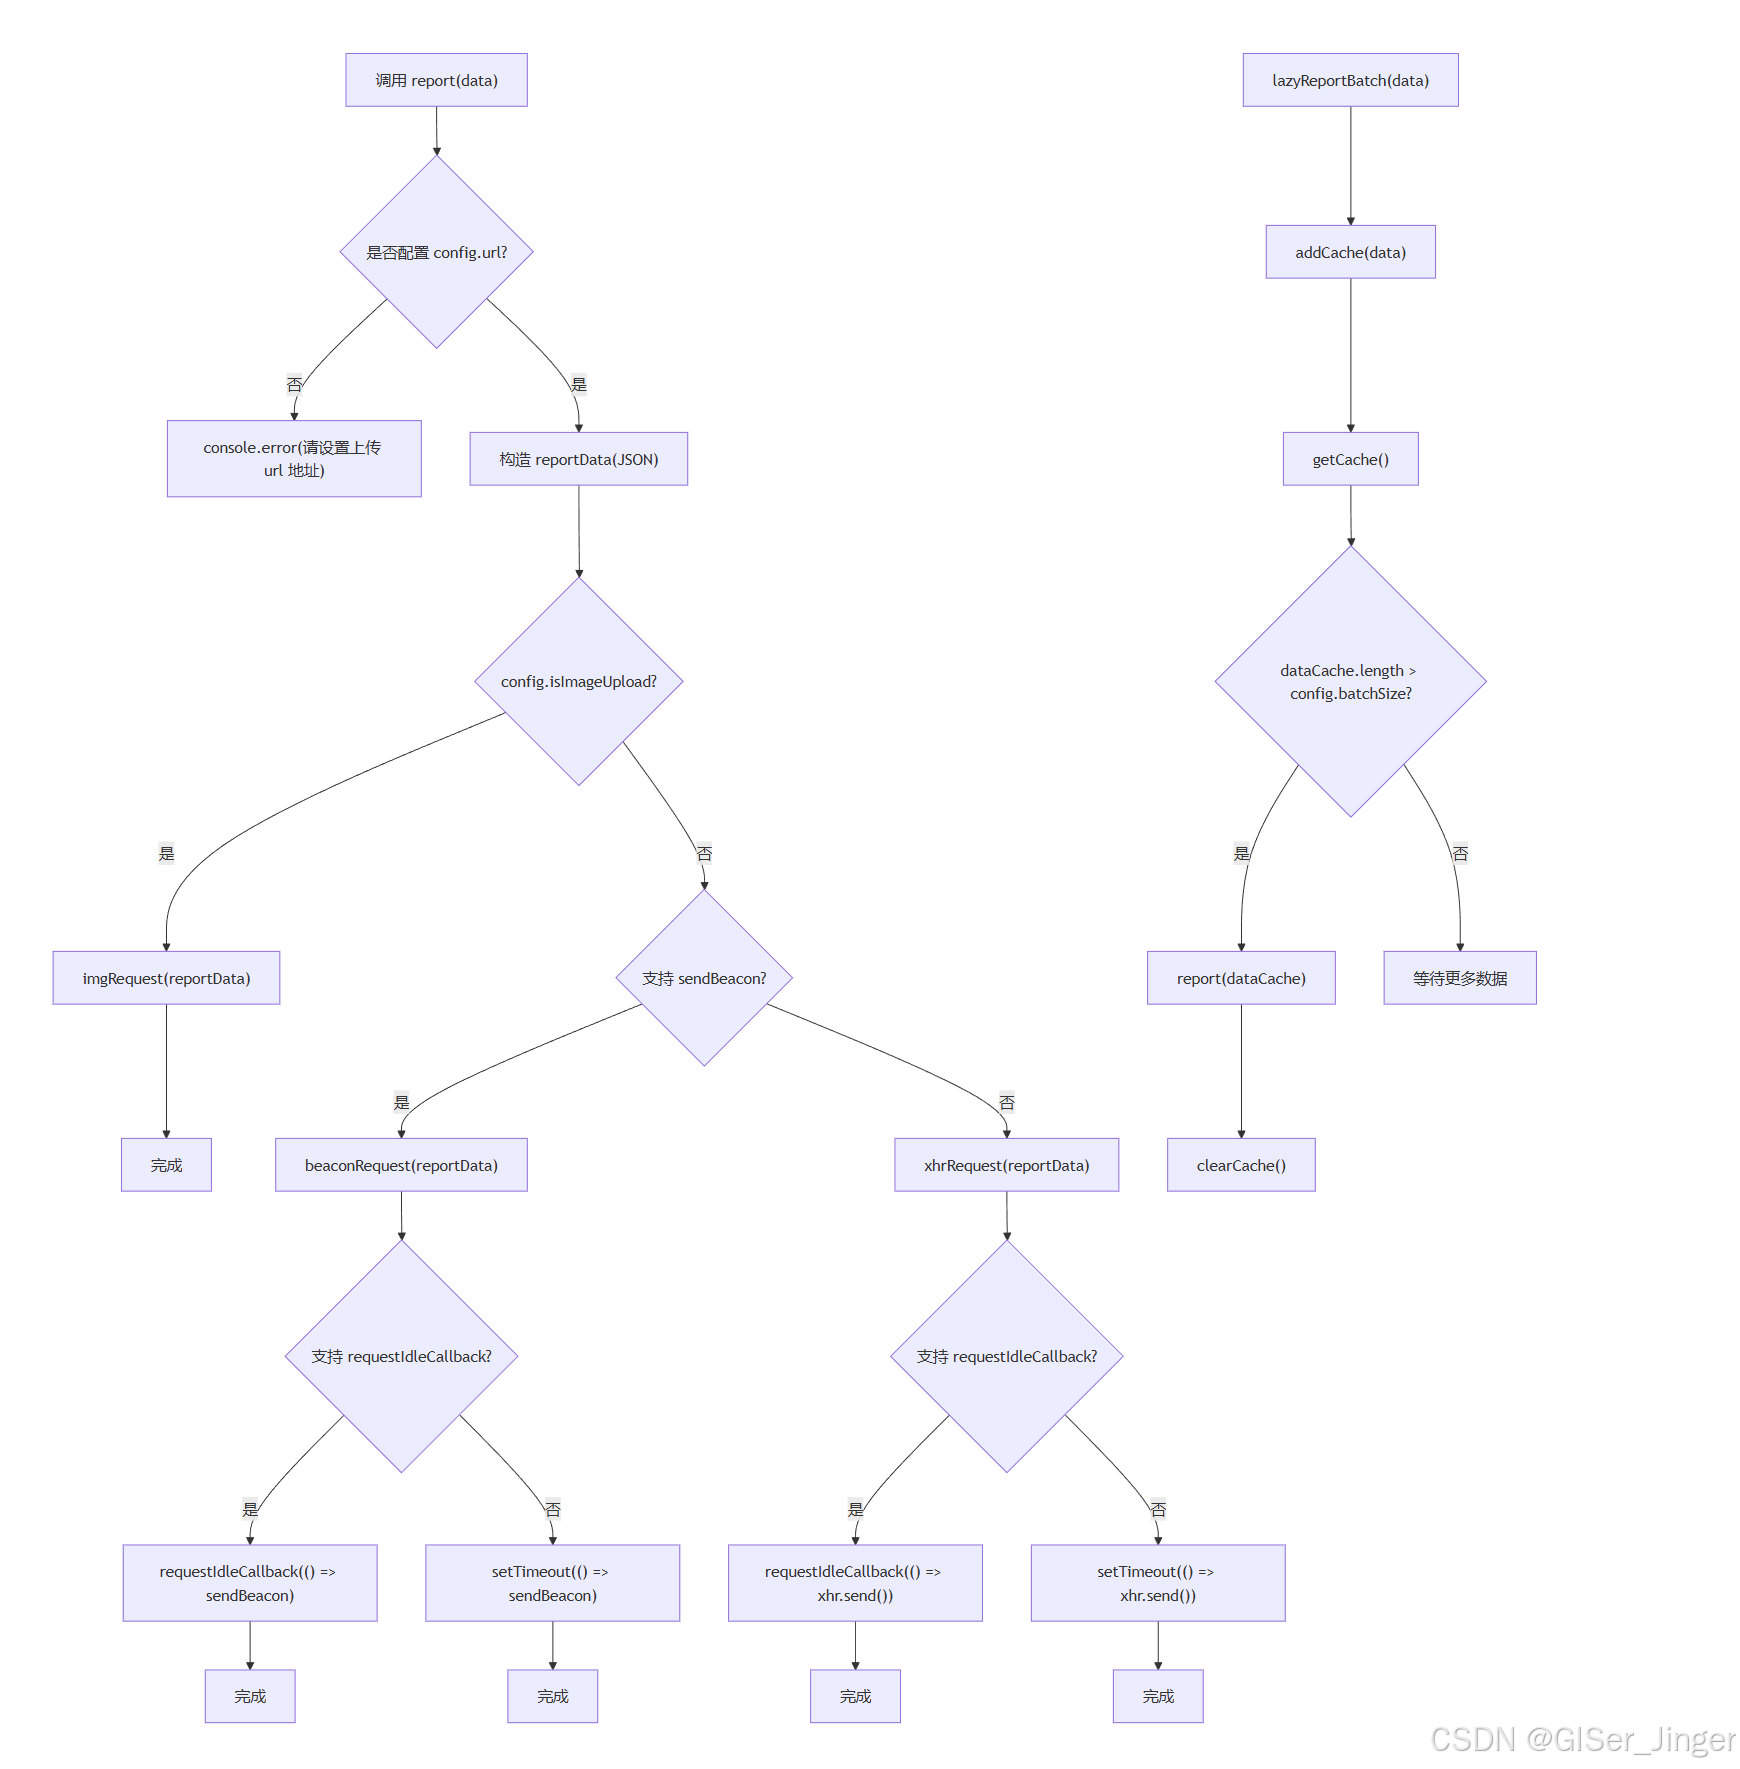
export function report(data) {if (!config.url) {console.error('請設置上傳 url 地址');}const reportData = JSON.stringify({id: generateUniqueId(),data,});// 上報數據,使用圖片的方式if (config.isImageUpload) {imgRequest(reportData);} else {// 優先使用 sendBeaconif (window.navigator.sendBeacon) {return beaconRequest(reportData);} else {xhrRequest(reportData);}}
}
// 批量上報數據
export function lazyReportBatch(data) {addCache(data);const dataCache = getCache();console.log('dataCache', dataCache);if (dataCache.length && dataCache.length > config.batchSize) {report(dataCache);clearCache();}//
}
// 圖片發送數據
export function imgRequest(data) {const img = new Image();// http://127.0.0.1:8080/api?data=encodeURIComponent(data)img.src = `${config.url}?data=${encodeURIComponent(JSON.stringify(data))}`;
}
// 普通ajax發送請求數據
export function xhrRequest(data) {if (window.requestIdleCallback) {window.requestIdleCallback(() => {const xhr = new XMLHttpRequest();originalOpen.call(xhr, 'post', config.url);originalSend.call(xhr, JSON.stringify(data));},{ timeout: 3000 });} else {setTimeout(() => {const xhr = new XMLHttpRequest();originalOpen.call(xhr, 'post', url);originalSend.call(xhr, JSON.stringify(data));});}
}// const sendBeacon = isSupportSendBeacon() ? navigator.sendBeacon : xhrRequest
export function beaconRequest(data) {if (window.requestIdleCallback) {window.requestIdleCallback(() => {window.navigator.sendBeacon(config.url, data);},{ timeout: 3000 });} else {setTimeout(() => {window.navigator.sendBeacon(config.url, data);});}
}
Lighthouse
Lighthouse 是 Google 提供的一個開源自動化網站審計工具,主要用于評估 Web 頁面在性能、可訪問性、最佳實踐、SEO 和 PWA(漸進式 Web 應用)等方面的表現。它可以直接在 Chrome 瀏覽器的 DevTools(開發者工具)中使用,也可以通過 Node.js 命令行運行,甚至集成到 CI/CD 流程中。
下面是對 Lighthouse 工具的詳解:
🔧 一、Lighthouse 使用方式
1. Chrome DevTools 中使用
- 打開 Chrome 瀏覽器
- 按 F12 或右鍵 → 檢查,打開開發者工具
- 切換到 “Lighthouse” 標簽頁
- 選擇你要評估的維度(Performance、Accessibility、Best Practices、SEO、PWA)
- 選擇設備類型(Mobile 或 Desktop)
- 點擊 “Analyze page load” 開始分析
2. 命令行工具
安裝 Node.js 后執行:
npm install -g lighthouse
lighthouse https://example.com --view
📊 二、Lighthouse 的評估維度詳解
1. 📈 Performance(性能)
評估頁面加載速度和交互體驗。核心指標包括:
- First Contentful Paint (FCP):首屏內容出現時間
- Largest Contentful Paint (LCP):最大內容元素加載時間
- Speed Index:頁面可見內容加載速度
- Time to Interactive (TTI):頁面完全可交互的時間
- Total Blocking Time (TBT):頁面阻塞時間
- Cumulative Layout Shift (CLS):視覺穩定性變化程度
👉 建議:壓縮資源、懶加載圖片、使用緩存、減少 JS 體積等
2. ? Accessibility(可訪問性)
檢測網站對殘障人士的友好程度:
- 圖像是否有合適的
alt標簽 - 表單元素是否有標簽
- 顏色對比度是否足夠
- 使用 ARIA 屬性
👉 建議:為每個交互元素提供語義標簽、顏色對比度符合標準
3. 📐 Best Practices(最佳實踐)
檢測網站是否符合現代 Web 開發規范:
- 使用 HTTPS
- 避免使用過時的 API
- 圖片格式是否優化
- 是否防止 XSS
👉 建議:盡量使用現代 Web API、安全連接和資源優化策略
4. 🔍 SEO(搜索引擎優化)
評估頁面對搜索引擎的友好程度:
- 頁面是否有
title、meta description - 使用語義化 HTML 標簽
- 頁面是否可爬取
- viewport 是否設置
👉 建議:符合基礎 SEO 規范,并確保結構良好
5. 📦 Progressive Web App(PWA)
檢測是否符合 PWA 應用標準(如可離線使用、安裝到桌面):
- 是否注冊了 Service Worker
- 是否提供 Web App Manifest
- 是否支持離線緩存
👉 建議:適合構建高可靠性、接近原生體驗的 Web 應用場景
📁 三、Lighthouse 報告詳解
生成報告后包含如下信息:
- 分數評分:每個維度都是 0-100 分
- 診斷信息:詳細列出存在的問題
- 建議改進:如何提升每項得分
- 詳細資源信息:如阻塞時間的腳本、加載順序等
🔄 四、常見優化建議
| 問題 | 建議優化方式 |
|---|---|
| FCP 慢 | 使用 CDN、預加載字體、圖片壓縮 |
| LCP 慢 | 懶加載、預渲染關鍵內容 |
| TTI 高 | 減少 JS 文件大小、優化主線程執行時間 |
| CLS 高 | 給圖片/iframe 設置固定尺寸,避免動態插入內容 |
🧪 五、集成到 CI/CD 中
可使用 lighthouse-ci 進行自動化測試:
npm install -g @lhci/cli
lhci autorun
可將分數設置為門檻,發布前必須達到指定分值。
🧠 總結
| 模塊 | 目的 | 分數建議 |
|---|---|---|
| Performance | 用戶體驗核心 | ≥90 |
| Accessibility | 對所有用戶友好 | ≥90 |
| Best Practices | 遵循標準 | ≥90 |
| SEO | 搜索可見性 | ≥90 |
| PWA | 應用體驗 | ≥70(視業務而定) |
六、案例: 個人網站


:RAG下的ETL快速上手)

)


、應用場景、注意事項)


