Title
題目
Deep-LIBRA: An artificial-intelligence method for robust quantification of breast density with independent validation in breast cancer risk assessment
Deep-LIBRA:一種用于可靠量化乳腺密度的人工智能方法,并在乳腺癌風險評估中進行了獨立驗證
01
文獻速遞介紹
研究表明,乳腺密度,即乳腺內纖維腺體組織的程度,不僅限制了篩查乳腺X光檢查的敏感性,而且還是一個獨立的乳腺癌風險因素(Engmann 等,2017;Freer,2015;Brentnall 等,2018)。乳腺密度可以通過全視野數字乳腺X光片(FFDM)圖像進行估算,通常使用美國放射學會乳腺影像報告和數據系統(BI-RADS)進行評估(D’orsi 等,2003)。然而,BI-RADS密度評估高度主觀,并且未能提供乳腺密度的定量、連續測量,這將有助于更精細的風險分層和乳腺密度變化的評估(Irshad 等,2016;Sprague 等,2016)。
可以通過市售軟件(Hartman 等,2008;Regini 等,2014)和基于研究的工具(Keller 等,2012;Mustra 等,2016;Li 等,2013;Shi 等,2018;Anitha 等,2017;Ferrari 等,2004;Kwok 等,2004)對FFDM圖像中的乳腺密度進行自動定量測量。盡管這些工具有用,但仍存在重要的局限性。大多數市售軟件包(如Quantra和Volpara)基于X射線束交互模型計算乳腺密度(Hartman 等,2008;Regini 等,2014)。這些軟件包基于特定元數據進行假設,以簡化各種估算,包括識別脂肪組織。因此,當所需元數據缺失時,這些假設可能導致估算不準確。此外,商業工具不提供相應的致密組織分割空間圖,同時它們也很昂貴,難以普及。另一方面,除了少數例外(如公開的LIBRA軟件,Keller 等,2012;Gastounioti 等,2020),基于研究的方法通常不是免費提供的,難以廣泛采用并嚴格比較其性能。大多數基于研究的工具也是使用小型、單機構數據集開發的,缺乏獨立驗證(Keller 等,2012;Li 等,2013;Shi 等,2018;Anitha 等,2017)。
Abstract
摘要
乳腺密度是乳腺癌的重要風險因素,也影響篩查乳腺X光檢查的特異性和敏感性。目前的聯邦立法要求對所有進行乳腺癌篩查的女性報告乳腺密度。在臨床上,乳腺密度是通過美國放射學會乳腺影像報告和數據系統(BI-RADS)評分進行視覺評估的。本文介紹了一種人工智能(AI)方法,用于從數字乳腺X光片中估算乳腺密度。我們的方法利用深度學習,使用兩種卷積神經網絡架構來準確分割乳腺區域。然后應用結合超像素生成和放射組學機器學習的AI算法,區分乳腺內的致密和非致密組織區域,從而估算乳腺密度。我們的方法在包含不同種族和多機構的15,661張圖像(4,437名女性)的數據集上進行了訓練和驗證,并在一個獨立的匹配病例對照數據集(6368張數字乳腺X光片,414例病例;1178例對照)上進行了乳腺密度估算和病例對照區分測試。在獨立數據集上,Deep-LIBRA和專家讀片者的乳腺密度百分比(PD)估算高度相關(Spearman相關系數=0.90)。此外,在調整年齡和體重指數(BMI)的模型中,Deep-LIBRA在病例對照區分性能方面表現更優(ROC曲線下面積,AUC=0.612 [95%置信區間(CI):0.584,0.640]),相比于四種廣泛使用的研究和商業乳腺密度評估方法(AUC=0.528到0.599)。我們的結果表明,Deep-LIBRA與專家讀片者的金標準評估之間的乳腺密度估算高度一致,并且在乳腺癌風險評估中表現優于最先進的開源和商業方法。
Method
方法
Deep-LIBRA is a pipeline of AI modules sequentially performing all three key computational steps involved in automated breastdensity quantification from FFDM. Through these steps, DeepLIBRA provides estimates of the total dense tissue area (DA), aswell as the relative amount of dense tissue within the breast, alsoknown as breast percent density (PD). This section describes thestudy datasets and the experiments used to develop and evaluateeach AI module of Deep-LIBRA (Table 1, Fig. 1 and SupplementaryFigure 1).
Deep-LIBRA是一系列AI模塊的管道,按順序執行FFDM自動乳腺密度量化涉及的所有三個關鍵計算步驟。通過這些步驟,Deep-LIBRA提供了總致密組織面積(DA)的估算,以及乳腺內致密組織的相對量,即乳腺密度百分比(PD)。本節描述了用于開發和評估Deep-LIBRA每個AI模塊的研究數據集和實驗(表1,圖1和補充圖1)。
Results
結果
3.1. Evaluation on development datasets
3.1.1. Background and pectoralis muscle removal
The evaluation curves in the development phase of Deep-LIBRAshow sufficient training and high performance in breast segmentation (Fig. 4). The highest weighted dice score achieved by thebackground removal module on the validation set was 99.4% after35 epochs, with a value of 99.5% on the training set at the sameepoch (Fig. 4 (a)). The pectoralis muscle removal module achievedthe highest weighted dice of 95.0% on the validation set after 158epochs, with a valueof 96.3% on the training set at the same epoch(Fig. 4 (b)).
3.1. 評估開發數據集
3.1.1. 背景和胸肌去除
Deep-LIBRA開發階段的評估曲線顯示了在乳腺分割中的充分訓練和高性能(圖4)。背景去除模塊在驗證集上的最高加權Dice得分在第35輪后達到了99.4%,在訓練集上的值在同一輪達到了99.5%(圖4(a))。胸肌去除模塊在第158輪后在驗證集上達到了最高加權Dice得分95.0%,在訓練集上的值在同一輪達到了96.3%(圖4(b))。
Figure
圖
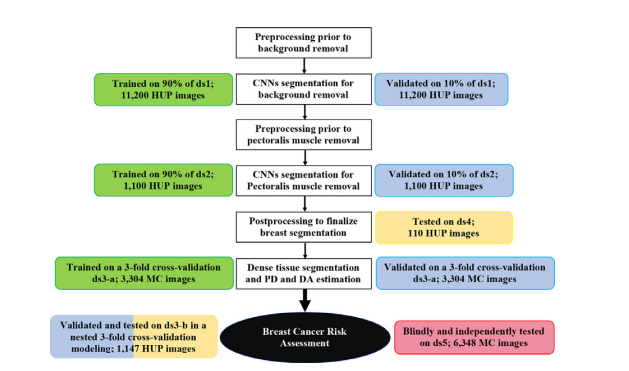
Fig. 1. Development and evaluation experiments. White boxes: workflow of theDeep-LIBRA algorithm. Green, blue, yellow, and red boxes: training, validation, independent testing, and blinded independent testing, respectively. HUP: Hospital ofthe University of Pennsylvania; MC: Mayo Clinic.
圖1. 開發和評估實驗。白色框:Deep-LIBRA算法的工作流程。綠色、藍色、黃色和紅色框分別表示訓練、驗證、獨立測試和盲獨立測試。HUP:賓夕法尼亞大學醫院;MC:梅奧診所。
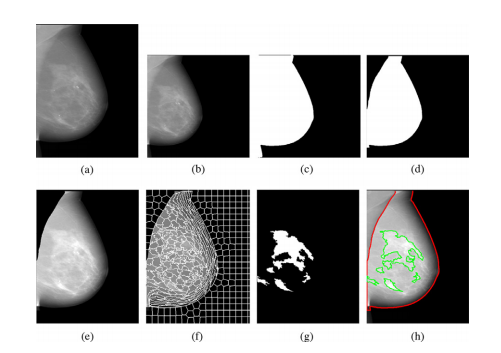
Fig. 2. Detailed illustration of the Deep-LIBRA algorithm operation. Panel (a) showsthe original FFDM image in 16-bit resolution, and panel (b) is the zero-padded image in an 8-bit intensity resolution. The zero-padded image is used by the background segmentation U-Net, which generates the image shown in panel (c). Panel(d) is the output of the module of pectoralis muscle removal using the second UNet resulting to the final breast segmentation shown in panel (e). The image frompanel (e) is used to generate superpixels as shown in panel (f) and perform radiomic feature analysis. Finally, the SVM classifies the superpixels based on the extracted features, resulting in dense tissue segmentation, as shown in panel (g). Thepanel (h) shows the final dense tissue segmentation overlaid on the original image. Note: The image sizes are different in this figure because the panels (a), (e)-(h)show images in the original image resolution, while the panels (b)-(d) are downsampled images of size 512 × 512 pixels used in U-Net segmentation.
圖2. Deep-LIBRA算法操作的詳細說明。面板(a)顯示了16位分辨率的原始FFDM圖像,面板(b)是零填充的8位強度分辨率圖像。零填充圖像被背景分割U-Net使用,生成面板(c)中顯示的圖像。面板(d)是使用第二個U-Net去除胸肌模塊的輸出,結果為面板(e)中顯示的最終乳腺分割圖像。面板(e)中的圖像用于生成如面板(f)所示的超像素,并進行放射組學特征分析。最后,SVM根據提取的特征對超像素進行分類,結果為致密組織分割,如面板(g)所示。面板(h)顯示了覆蓋在原始圖像上的最終致密組織分割圖像。注意:此圖中的圖像大小不同,因為面板(a)和面板(e)-(h)顯示的是原始圖像分辨率,而面板(b)-(d)是用于U-Net分割的512 × 512像素的下采樣圖像。
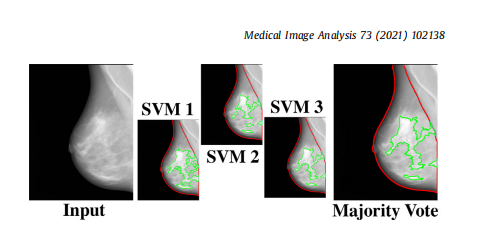
Fig. 3. The majority voting approach. The majority voting approach uses the outcome of three SVM models, each trained on two folds of ds3-a, to make the finaldense tissue segmentation. The majority voting scheme assigns the dense or nondense label to each superpixel based on at least two SVM models agreeing on thelabel.
圖3. 多數投票方法。多數投票方法使用三個SVM模型的結果,每個模型在ds3-a的兩個折疊上訓練,以進行最終的致密組織分割。多數投票方案根據至少兩個SVM模型對標簽的同意情況,將致密或非致密標簽分配給每個超像素。
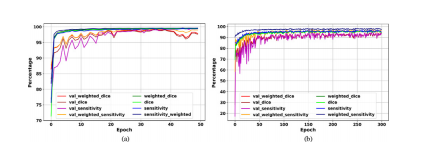
Fig. 4. Deep-LIBRA evaluation curves in the development phase. Panels (a) and(b) show the training and validation (noted as “val_”) results for background andpectoral muscle segmentation CNNs, respectively. As the panel (b) shows, there isno sign of overfitting for pectoralis muscle segmentation while panel (a) indicatessome possible signs of overfitting after epoch 40 shown by a wider fluctuation onthe validation set.
圖4. Deep-LIBRA在開發階段的評估曲線。面板(a)和面板(b)分別顯示了背景和胸肌分割CNN的訓練和驗證(標記為“val_”)結果。如面板(b)所示,胸肌分割沒有出現過擬合的跡象,而面板(a)顯示出在第40輪后驗證集上的波動較大,可能存在一些過擬合的跡象。
Table
表
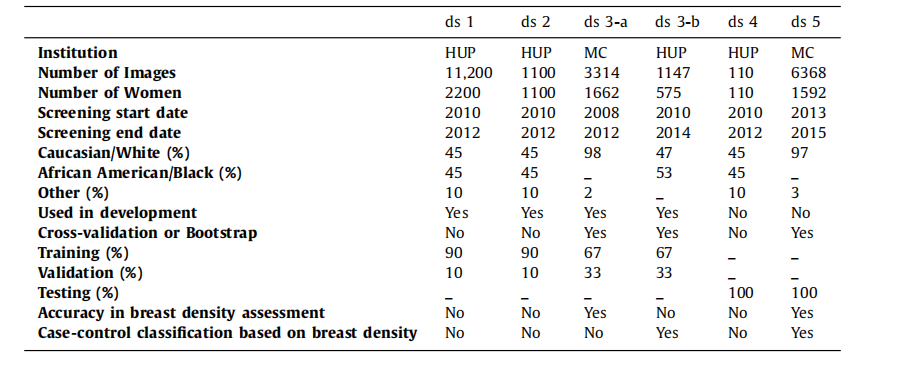
Table 1General characteristics of the six study datasets. For each dataset, this table shows the institution where images werecollected, the number of images and individual women, the range of screening dates, the racial distribution, andinformation about the dataset usage in this study. The case-control datasets (ds3-b and ds5) include any availablecancer case from the HUP and MC screening cohorts as long as a negative FFDM exam acquired prior to breastcancer diagnosis was available for analysis.
表1 六個研究數據集的一般特征。對于每個數據集,本表顯示了圖像收集的機構、圖像和個體女性的數量、篩查日期范圍、種族分布以及在本研究中數據集的使用信息。病例對照數據集(ds3-b和ds5)包括HUP和MC篩查隊列中的所有可用癌癥病例,只要有乳腺癌診斷前獲得的陰性FFDM檢查可供分析。
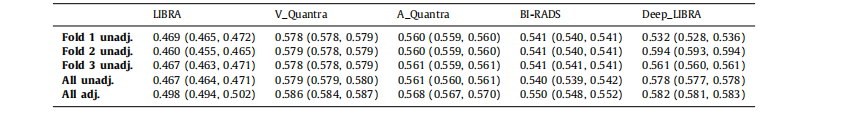
Table 2Case-control discrimination performance on the dataset ds3-b for breast percent density (PD) values generated by Deep-LIBRA and LIBRA,area-based (A_Quantra) and volumetric (V_Quantra) PD values by Quantra, and clinical BI-RADS density assessments. Results correspond tomean AUCs and 95% CIs in parentheses. Folds 1, 2 and 3 are the held-out folds used for the evaluation of the corresponding Deep-LIBRASVM. Unadj. and adj. indicate unadjusted logistic regression models and logistic regression models adjusted for age and BMI, respectively.
表2 ds3-b數據集上Deep-LIBRA和LIBRA生成的乳腺密度百分比(PD)值的病例對照區分性能,Quantra生成的基于面積(A_Quantra)和體積(V_Quantra)的PD值,以及臨床BI-RADS密度評估。結果對應于平均AUC和95%置信區間(CI)括號內的值。折疊1、2和3是用于評估相應Deep-LIBRA SVM的保留折疊。Unadj.和adj.分別表示未調整的邏輯回歸模型和調整年齡和BMI的邏輯回歸模型。
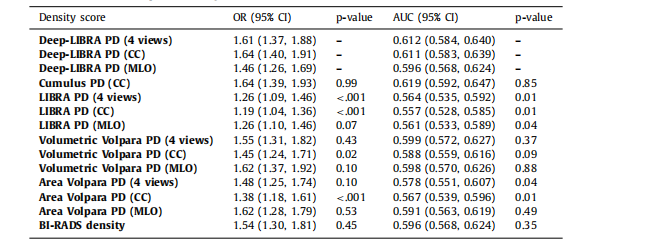
Table 3Associations of percent density (PD) measures with breast cancer and case-control discriminatory performance on ds5, using logistic regression models adjusted for age and BMI. P-values for both AUCs and ORswere obtained from 1000 bootstrap samples to test for the null hypothesis of no difference from the AUCor OR derived from Deep-LIBRA using the same breast views.
表3使用調整年齡和BMI的邏輯回歸模型,在ds5數據集上乳腺密度百分比(PD)測量與乳腺癌的關聯及病例對照區分性能。AUC和OR的P值是通過1000次自舉樣本獲得的,以檢驗與使用相同乳腺視圖的Deep-LIBRA得到的AUC或OR之間無差異的零假設。
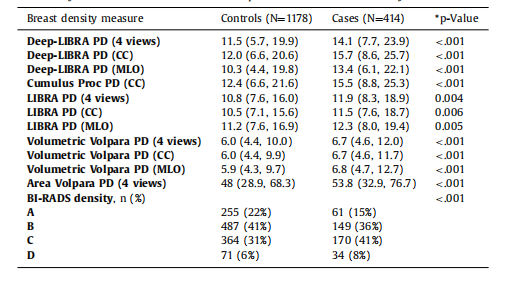
Table 4Breast density distributions on ds5. Except for BI-RADS density, data corresponds to medianand interquartile range in parentheses. For BI-RADS density, data corresponds to number ofwomen and percentage in parentheses. P-values from Wilcoxon Rank-sum tests for continuous density measures and from Pearson chi-squared test for BI-RADS density.
表4 ds5數據集上的乳腺密度分布。除BI-RADS密度外,數據對應于中位數和括號中的四分位數范圍。對于BI-RADS密度,數據對應于括號中的女性數量和百分比。*P值來自Wilcoxon秩和檢驗(用于連續密度測量)和Pearson卡方檢驗(用于BI-RADS密度)。


)