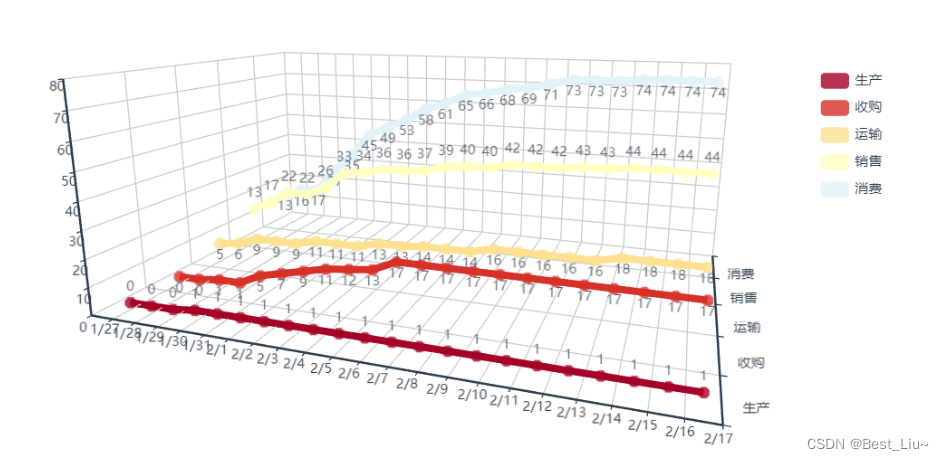
?一、vue中使用三維折線圖
效果圖:
二、使用步驟?
1.引入庫
安裝echarts
在package.json文件中添加
"dependencies": {"echarts": "^5.1.2""echarts-gl": "^1.1.1",// "echarts-gl": "^2.0.8"},
npm install echarts-gl@1.1.1 --save
2.使用
完整代碼如下(示例):
HTML代碼
<template><div :class="className" :style="{height:height,width:width}" />
</template>
js腳本代碼
<script>import echarts from 'echarts'import "echarts-gl";require('echarts/theme/macarons') // echarts themeimport resize from '@/views/dashboard/mixins/resize'export default {mixins: [resize],props: {className: {type: String,default: 'chart'},width: {type: String,default: '100%'},height: {type: String,default: '400px'},dataList: {type: Array,default: []}},data() {return {chart: null,}},mounted() {this.$nextTick(() => {this.initChart()})},beforeDestroy() {if (!this.chart) {return}this.chart.dispose()this.chart = null},watch: {dataList(val, oldVal) {//普通的watch監聽this.initChart()}},methods: {initChart() {let data = [[0, 0, 0, 1, 1, 1, 1, 1, 1, 1, 1, 1, 1, 1, 1, 1, 1, 1, 1, 1, 1, 1],[0, 0, 1, 1, 5, 7, 9, 11, 12, 13, 17, 17, 17, 17, 17, 17, 17, 17, 17, 17, 17, 17],[5, 6, 9, 9, 9, 11, 11, 11, 13, 13, 14, 14, 14, 16, 16, 16, 16, 16, 18, 18, 18, 18],[13, 17, 22, 22, 26, 33, 34, 36, 36, 37, 39, 40, 40, 42, 42, 42, 43, 43, 44, 44, 44, 44],[13, 16, 17, 27, 35, 45, 49, 53, 58, 61, 65, 66, 68, 69, 71, 73, 73, 73, 74, 74, 74, 74]]let dataX = ['1/27', '1/28', '1/29', '1/30', '1/31', '2/1', '2/2', '2/3', '2/4', '2/5', '2/6', '2/7', '2/8', '2/9', '2/10', '2/11', '2/12', '2/13', '2/14', '2/15', '2/16', '2/17']let dataY = ['生產', '收購', '運輸', '銷售', '消費']var vdata = []for (var i = 0; i < dataY.length; i++) {vdata[i] = []}for (var t = 0; t < dataY.length; t++) {var y = dataY[t];for (var k = 0; k < data[0].length; k++) {for (var p = 0; p < dataX.length; p++) {var x = dataX[p];var z = data[t][p];vdata[t].push([x, y, z]);}break;}}this.chart = echarts.init(this.$el, 'macarons')this.chart.setOption({xAxis3D: {type: 'category',name: '',data: dataX,axisLabel: {show: true,interval: 0  //使x軸都顯示}},yAxis3D: {type: 'category',name: '',data: dataY,axisLabel: {show: true,interval: 0   //使y軸都顯示}},zAxis3D: {type: 'value',name: ''},//圖例legend: {orient: 'vertical',right: 50,top: 200,icon: 'roundRect',textStyle: {color: '#FFFFFF'}},tooltip: {show: true},grid3D: {boxWidth: 300,boxHeight: 120,boxDepth: 200,axisLine: {show: true,interval: 0,lineStyle: {color: '#FFFFFF'}},viewControl: {distance: 400}},series: [{type: 'scatter3D',name: '生產',itemStyle: {color: 'rgb(165,  0, 38)'},label: {  //當type為scatter3D時有label出現show: true,position: 'top',   //標簽的位置,也就是data中數據相對于線在哪個位置distance: 0,textStyle: {color: '#FFFFFF',fontSize: 12,borderWidth: 0,borderColor: '#FFFFFF',backgroundColor: 'transparent'}},data: vdata[0]},{type: 'scatter3D',name: '收購',itemStyle: {color: 'rgb(215, 48, 39)'},label: {show: true,position: 'bottom',distance: 0,textStyle: {color: '#FFFFFF',fontSize: 12,borderWidth: 0,borderColor: '#FFFFFF',backgroundColor: 'transparent'}},data: vdata[1]},{type: 'scatter3D',name: '運輸',itemStyle: {color: 'rgb(254,224,144)'},label: {show: true,position: 'bottom',distance: 0,textStyle: {color: '#FFFFFF',fontSize: 12,borderWidth: 0,borderColor: '#FFFFFF',backgroundColor: 'transparent'}},data: vdata[2]},{type: 'scatter3D',name: '銷售',itemStyle: {color: 'rgb(255,255,191)'},label: {show: true,position: 'top',distance: 0,textStyle: {color: '#FFFFFF',fontSize: 12,borderWidth: 0,borderColor: '#FFFFFF',backgroundColor: 'transparent'}},data: vdata[3]},{type: 'scatter3D',name: '消費',itemStyle: {color: 'rgb(224,243,248)'},label: {show: true,position: 'bottom',distance: 0,textStyle: {color: '#FFFFFF',fontSize: 12,borderWidth: 0,borderColor: '#FFFFFF',backgroundColor: 'transparent'}},data: vdata[4]},{type: 'line3D', //當type為line3D時有label沒有作用,官網沒有label這個配置項name: '生產',lineStyle: {width: 8,   //線的寬度color: 'rgb(165,  0, 38)'   //線的顏色},data: vdata[0]   //線數據和點數據所需要的格式一樣},{type: 'line3D',name: '收購',lineStyle: {color: 'rgb(215, 48, 39)',  //線的顏色width: 8     //線的寬度},data: vdata[1]},{type: 'line3D',name: '運輸',lineStyle: {color: 'rgb(254,224,144)',width: 8},data: vdata[2]},{type: 'line3D',name: '銷售',lineStyle: {color: 'rgb(255,255,191)',width: 8},data: vdata[3]},{type: 'line3D',name: '消費',lineStyle: {color: 'rgb(224,243,248)',width: 8},data: vdata[4]},]})}}}
</script>


和安卓操作系統(Android)的區別)

)


>》)


![[圖解]SysML和EA建模住宅安全系統-02-現有運營領域-塊定義圖](http://pic.xiahunao.cn/[圖解]SysML和EA建模住宅安全系統-02-現有運營領域-塊定義圖)


