目錄
Prometheus
概述——
安裝prometheus
案例
環境說明
實驗步驟
一、prometheus服務器配置時間同步
二、安裝Prometheus服務器
配置文件說明
三、編寫服務啟動文件并啟動服務
四、訪問web頁面
Prometheus
概述——
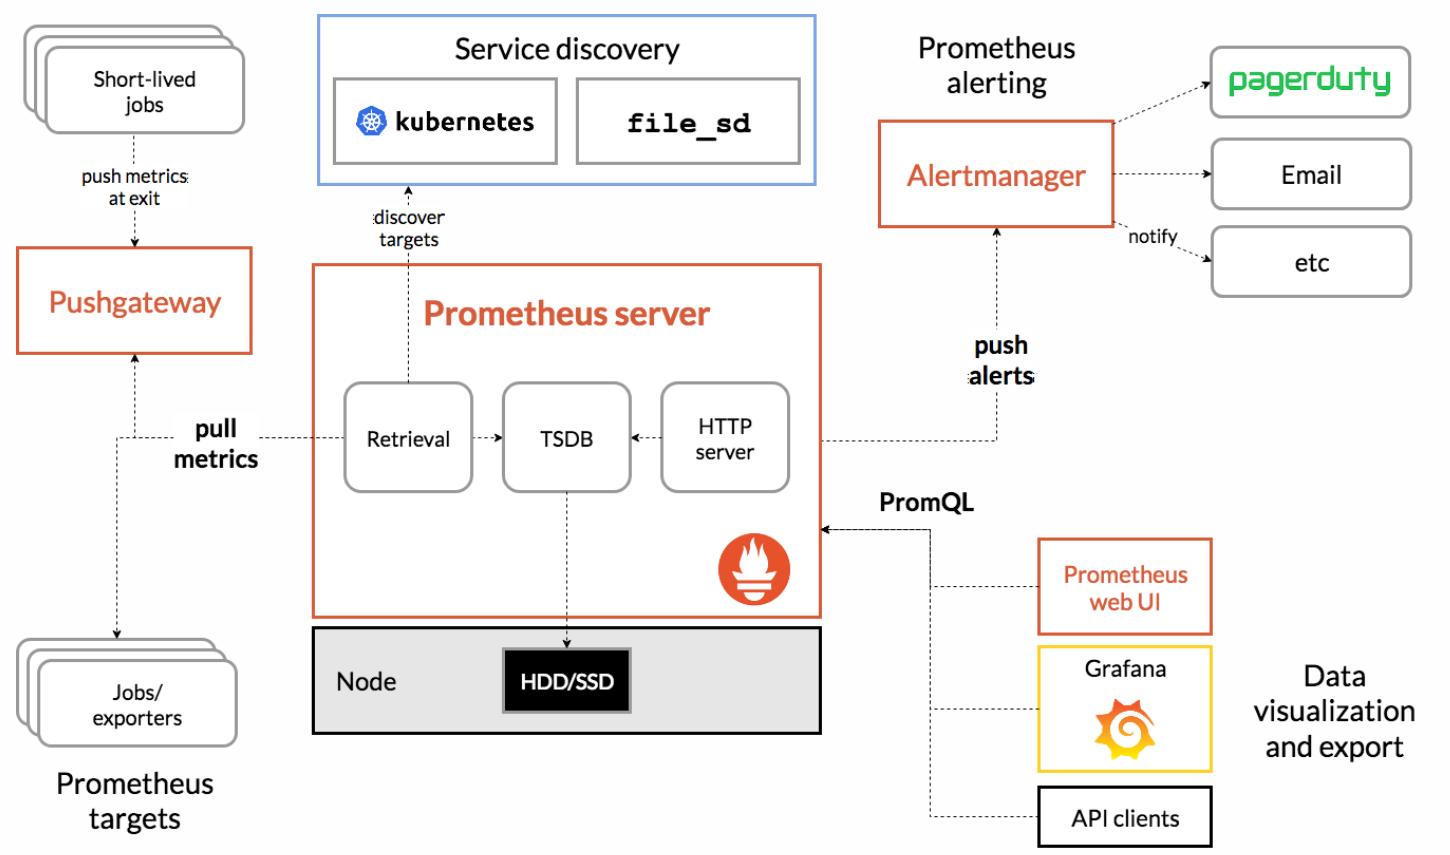
Prometheus是一個開源系統監控和警報工具包,最初由 SoundCloud構建。
是一款監控軟件,也是一個時序數據庫。Prometheus 將其指標收集并存儲為時間序列數據,即指標信息與記錄時的時間戳以及稱為標簽的可選鍵值對一起存儲。
主要用在容器監控方面,也可以用于常規的主機監控。
使用google公司開發的go語言編寫。
Prometheus是一個框架,可以與其他組件完美結合。
重視高可用,準確性達不到100%
服務名:prometheus
服務端口:9090
安裝prometheus
你可以從Prometheus官網下載安裝包,然后上傳到服務器進行解壓安裝
Download | Prometheus? ? ? 找到合適的安裝包進行下載
案例
環境說明
| 主機名稱 | IP地址 | 功能 |
| prometheus | 192.168.88.5 | prometheus服務器 |
| web1 | 192.168.88.100 | web服務器 |
| web2 | 192.168.88.200 | web服務器 |
實驗步驟
一、prometheus服務器配置時間同步
方法一:計劃任務方式
#創建定時任務:
*/2 * * * * /sbin/ntpdate ntp1.aliyun.com &>/dev/null
方法二:chrony服務方式
#安裝chrony:
dnf -y install chrony
#配置chrony:
vim /etc/chrony.conf
#添加或修改服務器配置:
server [目標IP/域名] iburst
#啟動服務:
systemctl enable chronyd --now
#驗證同步狀態:
chronyc sources
方法三:timedatectl工具
#查看時區:
timedatectl
#設置時區:
timedatectl set-timezone Asia/Shanghai
#查看當前時間:
date
#手動修改時間:
date -s "YYYY-MM-DD HH:MM:SS"
二、安裝Prometheus服務器
#拷貝Prometheus相關軟件包到服務器,解壓即部署
[root@prometheus ~]# cd prometheus_soft/
[root@prometheus prometheus_soft]# tar xf?prometheus-2.37.5.linux-amd64.tar.gz
[root@prometheus?prometheus_soft]# mv prometheus-2.37.5.linux-amd64 /usr/local/prometheus
配置文件說明
配置文件中包含三個配置塊:global、rule_files和scrape_configs。
global塊控制 Prometheus 服務器的全局配置。我們有兩個選擇。第一個,scrape_interval控制 Prometheus 抓取目標的頻率。您可以為單個目標覆蓋它。在這種情況下,全局設置是每 15 秒抓取一次。該evaluation_interval選項控制 Prometheus 評估規則的頻率。Prometheus 使用規則來創建新的時間序列并生成警報。
rule_files塊指定我們希望 Prometheus 服務器加載的任何規則的位置。現在我們還沒有規則。
最后一個塊,scrape_configs控制 Prometheus 監控的資源。由于 Prometheus 還將有關自身的數據公開為 HTTP 端點,因此它可以抓取和監控自身的健康狀況。在默認配置中,有一個名為 的作業prometheus,用于抓取 Prometheus 服務器公開的時間序列數據。該作業包含一個單一的、靜態配置的目標,即localhost的9090端口。Prometheus期望度量在/metrics路徑上的目標上可用,所以這個默認作業是通過 URL 抓取的:http://localhost:9090/metrics。
三、編寫服務啟動文件并啟動服務
[root@prometheus?prometheus_soft]# vim /usr/lib/systemd/system/prometheus.service
[Unit]
Description=Prometheus Monitoring System??#服務描述
After=network.target?#在網絡服務啟動后運行
#啟動命令指定了配置文件路徑(--config.file)和數據存儲路徑(--storage.tsdb.path)
[Service]
ExecStart=/usr/local/prometheus/prometheus \
??--config.file=/usr/local/prometheus/prometheus.yml \
??--storage.tsdb.path=/usr/local/prometheus/data/?
[Install]
WantedBy=multi-user.target??#設置為多用戶模式下啟動
# 啟動服務
[root@prometheus prometheus_soft]# systemctl daemon-reload
[root@prometheus prometheus_soft]# systemctl enable prometheus.service --now
[root@prometheus prometheus_soft]# ss -tlnp | grep :9090
LISTEN 0 ? ? ?128 ? ? ? ? ? ? ? ?*:9090 ? ? ? ? ? ? *:* ? ?users:(("prometheus",pid=4396,fd=7)) ?
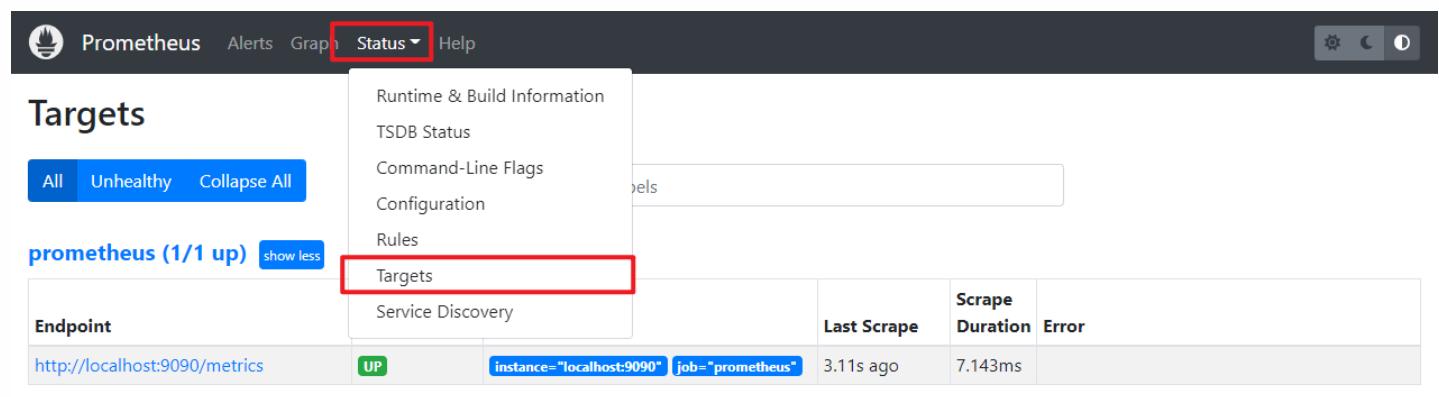
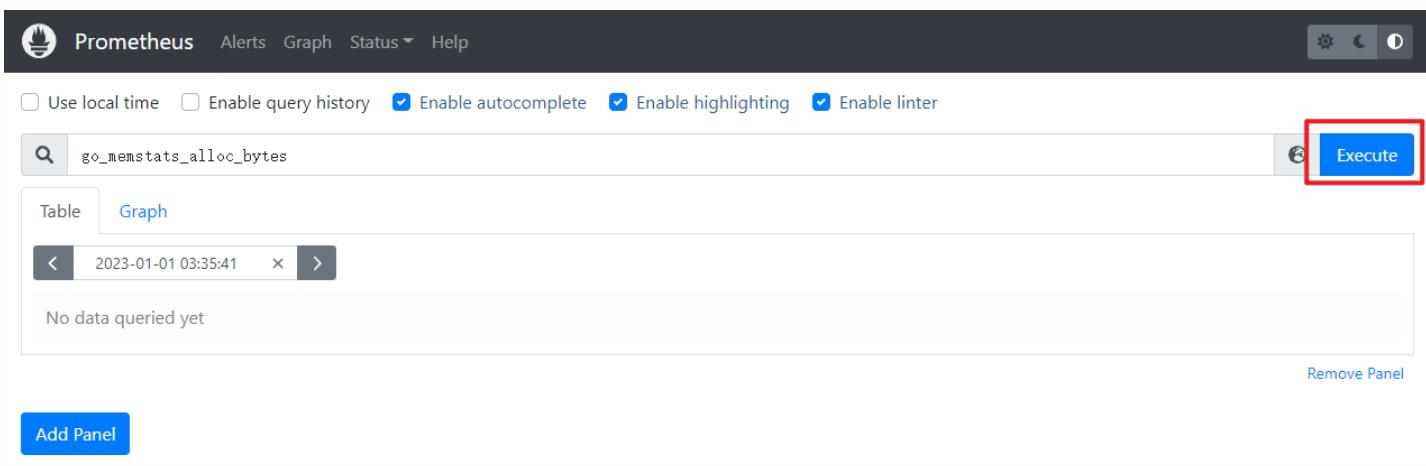
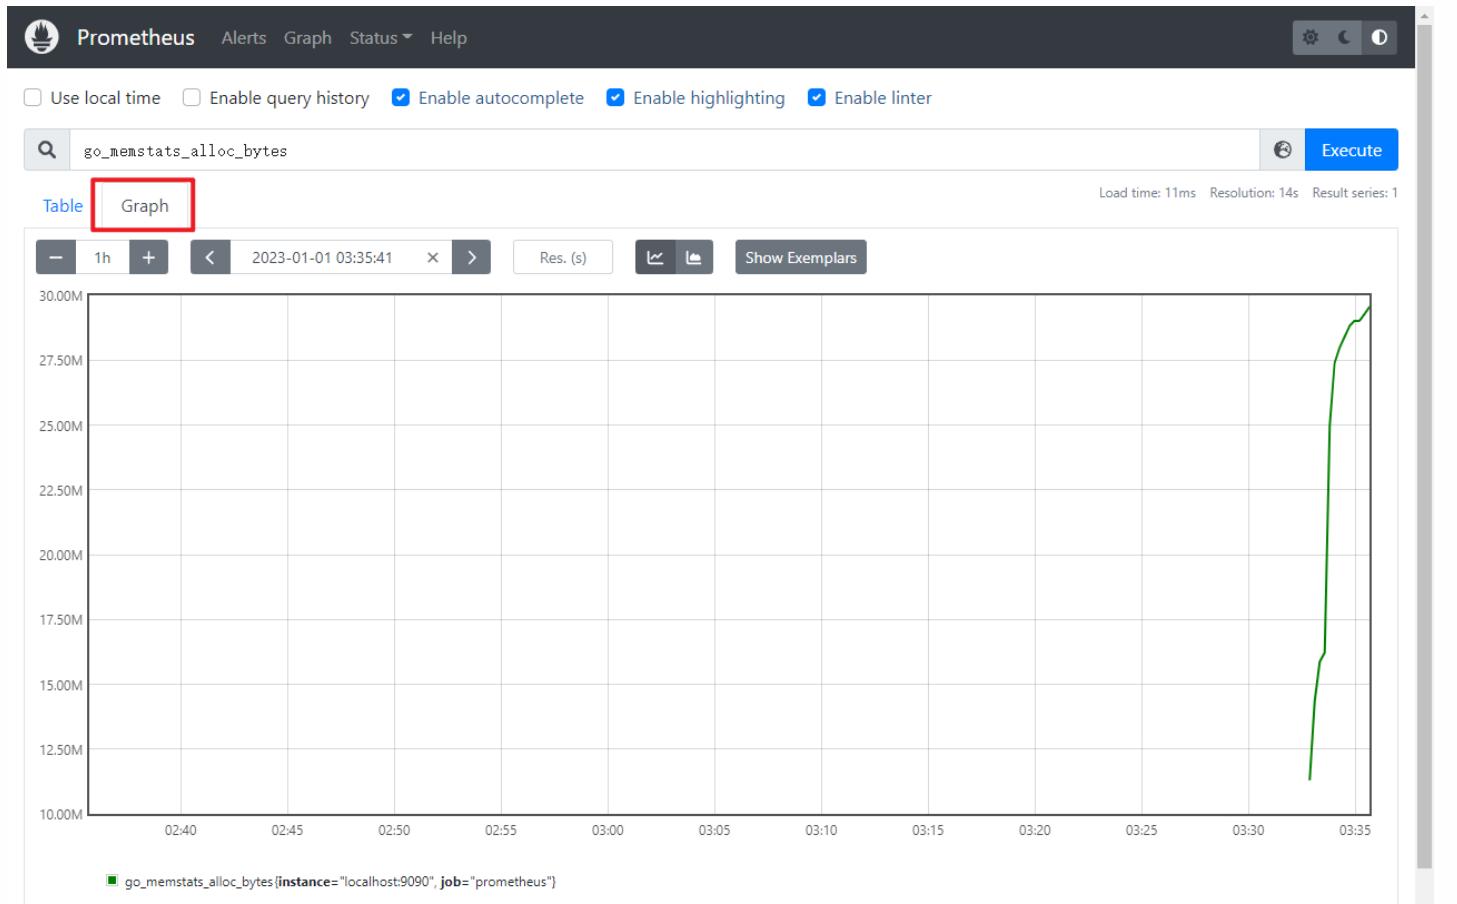
四、訪問web頁面
http://192.168.88.5:9090/
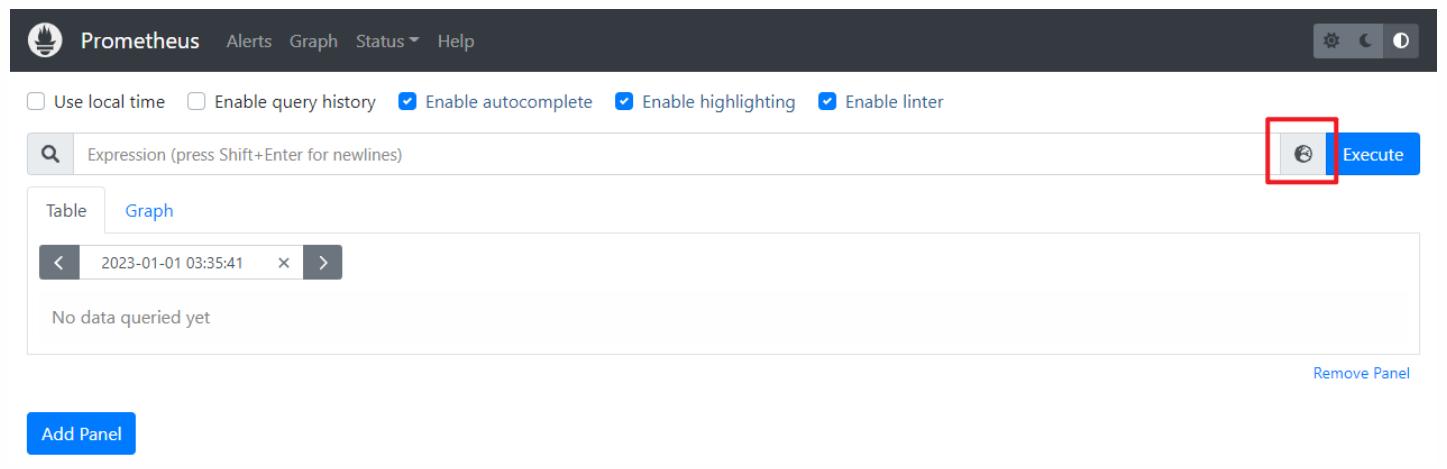
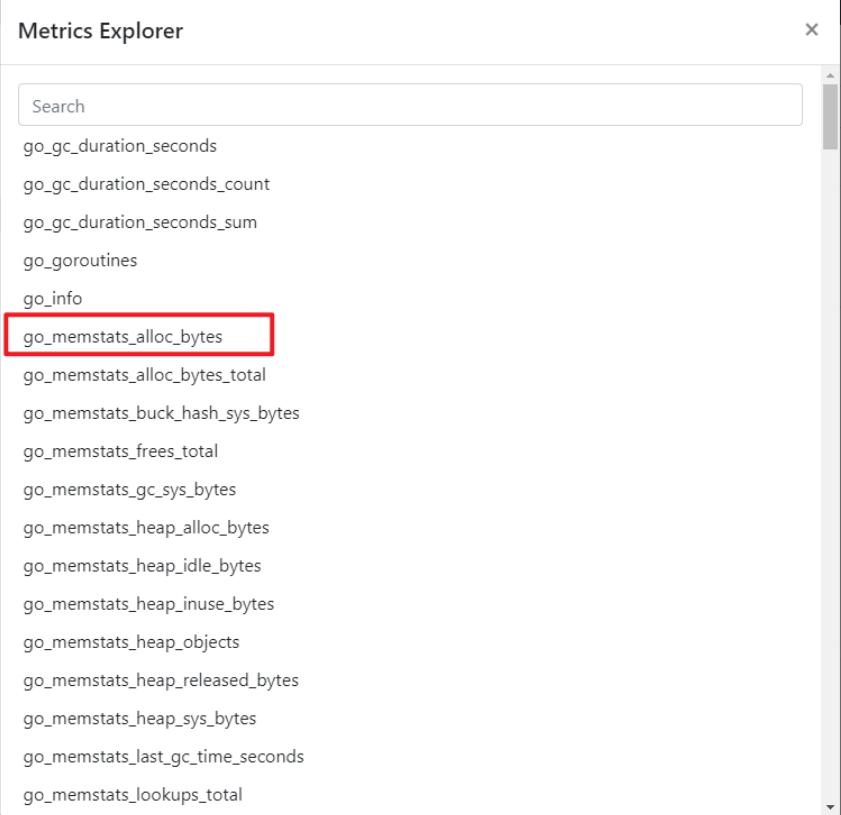
查看監控自身的數據,如分配置給Prometheus運行的內存數量


![洛谷 P1077 [NOIP 2012 普及組] 擺花-普及-](http://pic.xiahunao.cn/洛谷 P1077 [NOIP 2012 普及組] 擺花-普及-)

)
)


:指令與過濾器)


)

