前言
參考的視頻在抖音,電腦版的抖音一直登錄不了,用手機分享的鏈接如下所示。
4.35 I@v.FH yTl:/ 04/04 復制打開抖音👀數學送的七夕花禮,記得查收噢.# 七夕花禮請查收 ... https://v.douyin.com/H-YpOJCyQyg/
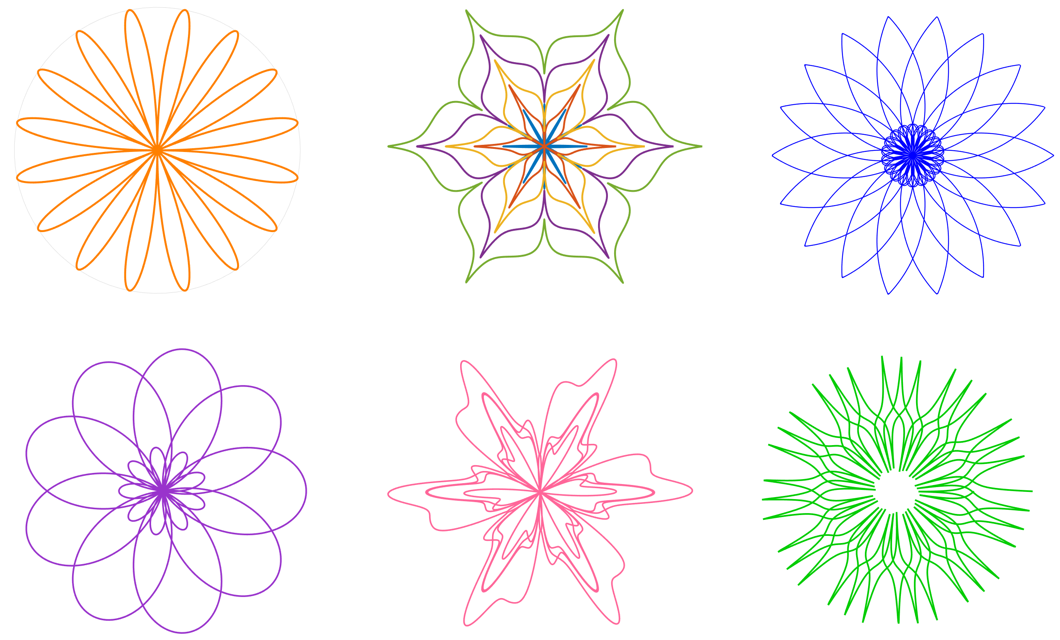
rho=4sin(8theta)
公式:
% rho=4sin(8theta)
clc;            % 清空命令窗口
clear;          % 清空工作區變量
close all;      % 關閉所有圖形窗口% 首先生成數據
theta = linspace(0, 2*pi, 1000);  % 創建0到2π之間的1000個角度點
rho = 4 * sin(8 * theta);         % 計算極徑值% 創建最終結果的圖形窗口(優先顯示)- 修改背景為白色
figure('Position', [100, 100, 800, 600], 'Name', '最終結果 - 八瓣玫瑰曲線', 'Color', 'white');
polarplot(theta, rho, 'Color', [1, 0.5, 0], 'LineWidth', 2.5);  % 使用橙色繪制
title('\rho = 4 sin(8\theta)', 'FontSize', 14, 'FontWeight', 'bold');
grid on;
rlim([0 4]);% 隱藏極坐標軸的標簽和刻度
ax = gca;
ax.ThetaTickLabel = {};
ax.RTickLabel = {};
ax.ThetaTick = [];
ax.RTick = [];% 添加信息文本框
annotation('textbox', [0.04, 0.04, 0.2, 0.12], 'String', ...{'極坐標方程: ρ = 4sin(8θ)', '八瓣玫瑰曲線', '橙色線條'}, ...'FitBoxToText', 'on', 'BackgroundColor', 'white', 'FontSize', 10);% 然后創建動畫圖形窗口
figure('Position', [900, 100, 800, 600], 'Name', '動畫繪制過程');% 轉換為直角坐標系用于繪圖
x = rho .* cos(theta);
y = rho .* sin(theta);% 創建極坐標軸
polaraxes;
hold on;  % 保持圖形,允許多次繪制% 設置極坐標圖范圍
rlim([0 4]);  % 設置徑向范圍
title('\rho = 4 sin(8\theta) - 繪制過程');  % 添加標題
grid on;      % 顯示網格% 初始化繪圖,只繪制第一個點
h = polarplot(theta(1), rho(1), 'Color', [1, 0.5, 0], 'LineWidth', 1.5);  % 橙色% 動畫循環 - 逐步繪制曲線
for i = 2:length(theta)% 更新數據點set(h, 'ThetaData', theta(1:i), 'RData', rho(1:i));% 暫停一小段時間,創建動畫效果pause(0.01);% 刷新顯示drawnow;
end% 將焦點返回到最終結果窗口
figure(1);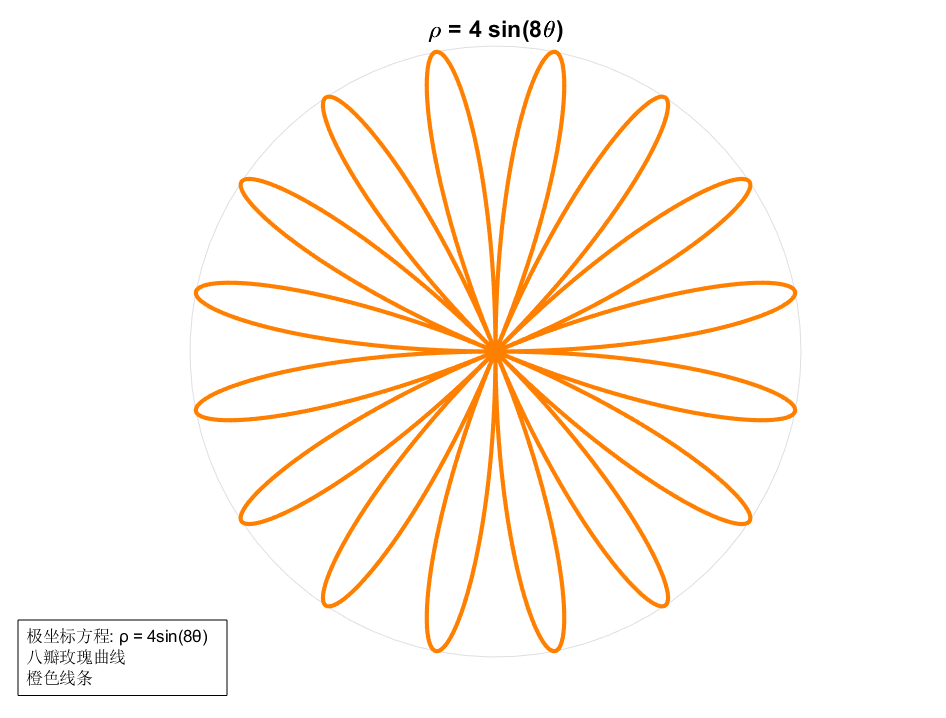
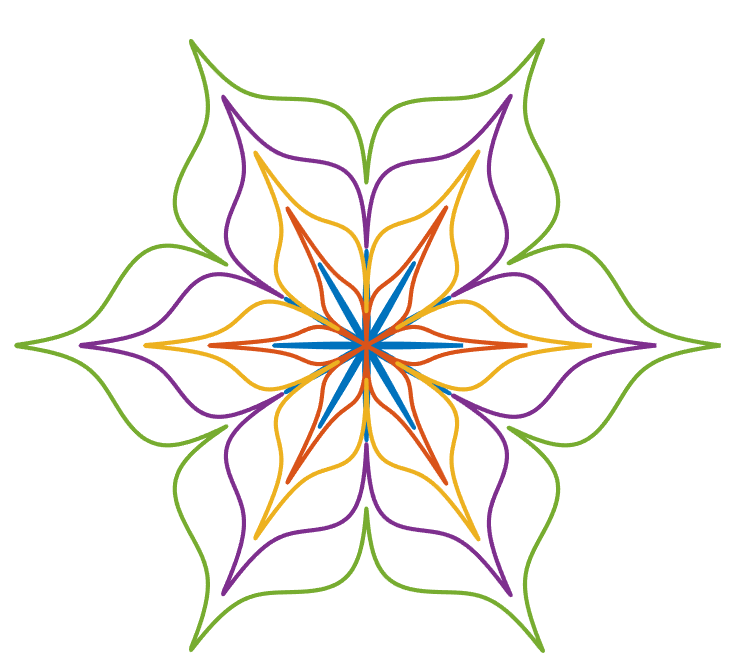
rho = n + (|cos(3θ)| + 2(0.25 - |cos(3θ + π/2)|)) / (2 + 8|cos(6θ + π/2)|)
公式:
% 花朵曲線方程: rho = n + (|cos(3θ)| + 2(0.25 - |cos(3θ + π/2)|)) / (2 + 8|cos(6θ + π/2)|)
clc;            % 清空命令窗口
clear;          % 清空工作區變量
close all;      % 關閉所有圖形窗口% 定義n值
n_values = [0, 0.5, 1, 1.5, 2];
theta = linspace(0, 2*pi, 2000);  % 角度值
colors = lines(length(n_values)); % 生成不同的顏色% 創建最終結果的圖形窗口
figure('Position', [100, 100, 800, 600], 'Name', '花朵曲線比較', 'Color', 'white');
hold on;% 為每個n值計算并繪制曲線
for i = 1:length(n_values)n = n_values(i);% 計算 rhocos3theta = cos(3*theta);cos6theta_pi2 = cos(6*theta + pi/2);abs_cos3theta = abs(cos3theta);abs_cos6theta_pi2 = abs(cos6theta_pi2);numerator = abs_cos3theta + 2*(0.25 - abs(cos(3*theta + pi/2)));denominator = 2 + 8*abs_cos6theta_pi2;rho = n + numerator ./ denominator;% 轉換為笛卡爾坐標x = rho .* cos(theta);y = rho .* sin(theta);% 繪制最終曲線plot(x, y, 'Color', colors(i,:), 'LineWidth', 2.5, 'DisplayName', sprintf('n=%.1f', n));
end% 設置圖形屬性
axis equal;
axis off; % 關閉坐標軸
title('花朵曲線比較', 'FontSize', 14, 'FontWeight', 'bold');% 添加圖例(替代坐標軸信息)
legend('show', 'Location', 'best', 'FontSize', 10, 'Box', 'off');% 添加信息文本框
annotation('textbox', [0.02, 0.02, 0.3, 0.1], 'String', ...{'ρ = n + (|cos(3θ)| + 2(0.25 - |cos(3θ + π/2)|))', '/ (2 + 8|cos(6θ + π/2)|)'}, ...'FitBoxToText', 'on', 'BackgroundColor', 'white', 'FontSize', 9, ...'EdgeColor', 'none');hold off;% 創建動畫窗口
figure('Position', [900, 100, 800, 600], 'Name', '花朵曲線動畫繪制');% 動畫繪制過程
for i = 1:length(n_values)n = n_values(i);% 計算當前n值的rhocos3theta = cos(3*theta);cos6theta_pi2 = cos(6*theta + pi/2);abs_cos3theta = abs(cos3theta);abs_cos6theta_pi2 = abs(cos6theta_pi2);numerator = abs_cos3theta + 2*(0.25 - abs(cos(3*theta + pi/2)));denominator = 2 + 8*abs_cos6theta_pi2;rho = n + numerator ./ denominator;% 轉換為笛卡爾坐標x = rho .* cos(theta);y = rho .* sin(theta);% 清空當前圖形clf;hold on;% 繪制所有已完成的曲線for j = 1:i-1n_prev = n_values(j);% 重新計算之前n值的rho(為了動畫效果)cos3theta_prev = cos(3*theta);cos6theta_pi2_prev = cos(6*theta + pi/2);abs_cos3theta_prev = abs(cos3theta_prev);abs_cos6theta_pi2_prev = abs(cos6theta_pi2_prev);numerator_prev = abs_cos3theta_prev + 2*(0.25 - abs(cos(3*theta + pi/2)));denominator_prev = 2 + 8*abs_cos6theta_pi2_prev;rho_prev = n_prev + numerator_prev ./ denominator_prev;x_prev = rho_prev .* cos(theta);y_prev = rho_prev .* sin(theta);plot(x_prev, y_prev, 'Color', colors(j,:), 'LineWidth', 2, 'DisplayName', sprintf('n=%.1f', n_prev));end% 動畫繪制當前曲線h = plot(x(1), y(1), 'Color', colors(i,:), 'LineWidth', 2, 'DisplayName', sprintf('n=%.1f', n));% 逐步繪制當前曲線for k = 2:50:length(theta)  % 步長為50,加快動畫速度set(h, 'XData', x(1:k), 'YData', y(1:k));drawnow;pause(0.005);end% 完成當前曲線的繪制set(h, 'XData', x, 'YData', y);% 設置圖形屬性axis equal;axis off; % 關閉坐標軸title(sprintf('繪制過程: n = %.1f', n), 'FontSize', 12);legend('show', 'Location', 'best', 'Box', 'off');drawnow;% 暫停一下,顯示當前曲線pause(0.5);
end% 添加最終標題
title('所有花朵曲線繪制完成', 'FontSize', 12);
hold off;% 將焦點返回到最終結果窗口
figure(1);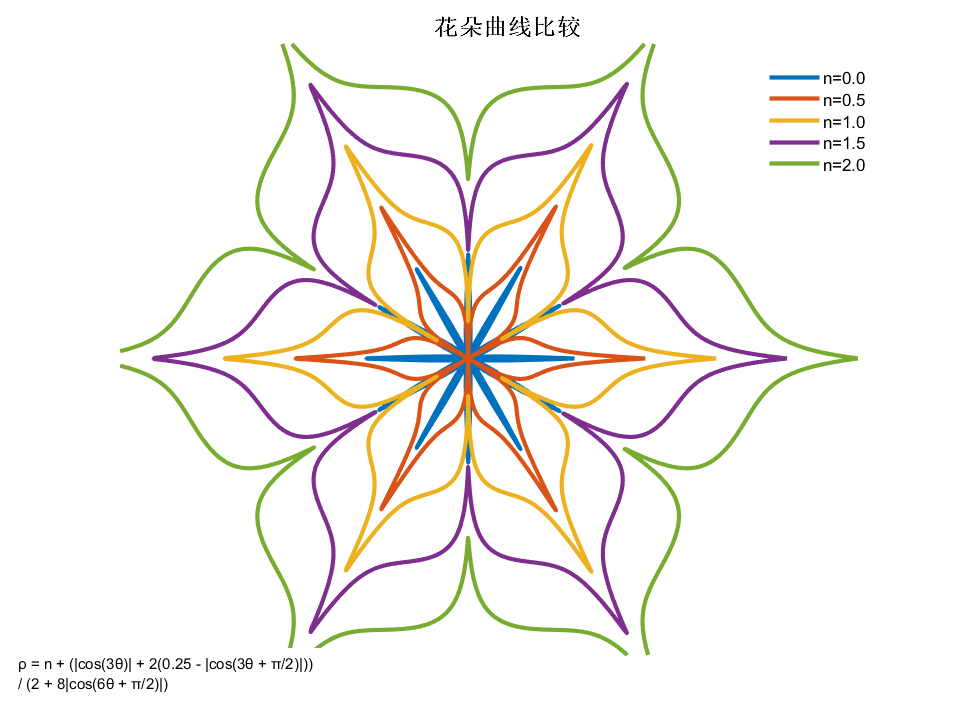
rho=(sin 0.9 theta)(3-|5cos(0.9 theta)|)?
公式:
% rho=(sin 0.9 theta)(3-|5cos(0.9 theta)|) clc;            % 清空命令窗口
clear;          % 清空工作區變量
close all;      % 關閉所有圖形窗口% 創建最終結果的圖形窗口(可移動,無坐標軸)- 白色背景
finalFig = figure('Position', [100, 100, 800, 800], 'Name', '最終結果 (0-32π)', ...'NumberTitle', 'off', 'MenuBar', 'none', 'ToolBar', 'none', ...'Color', 'white');
movegui(finalFig, 'center'); % 將窗口移動到屏幕中央% 計算32π范圍的圖形
theta_range = linspace(0, 32*pi, 10000);
rho_range = sin(0.9 * theta_range) .* (3 - abs(5 * cos(0.9 * theta_range)));% 轉換為笛卡爾坐標
x_range = rho_range .* cos(theta_range);
y_range = rho_range .* sin(theta_range);% 繪制最終結果(無坐標軸)- 白色背景
plot(x_range, y_range, 'b', 'LineWidth', 1.5);
axis equal;
axis off; % 關閉坐標軸
set(gca, 'Color', 'white'); % 設置坐標區域背景為白色
title('最終圖形 (θ = 0 到 32π)', 'FontSize', 12);% 創建動畫窗口(可移動)- 白色背景
animFig = figure('Position', [300, 300, 600, 600], 'Name', '動畫繪制過程', ...'NumberTitle', 'off', 'Color', 'white');
movegui(animFig, 'center'); % 將窗口移動到屏幕中央% 準備動畫數據
theta = linspace(0, 32*pi, 5000);
rho = sin(0.9 * theta) .* (3 - abs(5 * cos(0.9 * theta)));
x = rho .* cos(theta);
y = rho .* sin(theta);% 繪制動畫
h = plot(x(1), y(1), 'b-', 'LineWidth', 1.5);
axis equal;
grid on;
title('動畫繪制過程 (θ = 0 到 32π)');
xlabel('x');
ylabel('y');
xlim([min(x) max(x)]);
ylim([min(y) max(y)]);
set(gca, 'Color', 'white'); % 設置坐標區域背景為白色% 繪制動畫過程
for k = 1:50:length(theta)set(h, 'XData', x(1:k), 'YData', y(1:k));drawnow;
end% 優先顯示最終結果的窗口
figure(finalFig);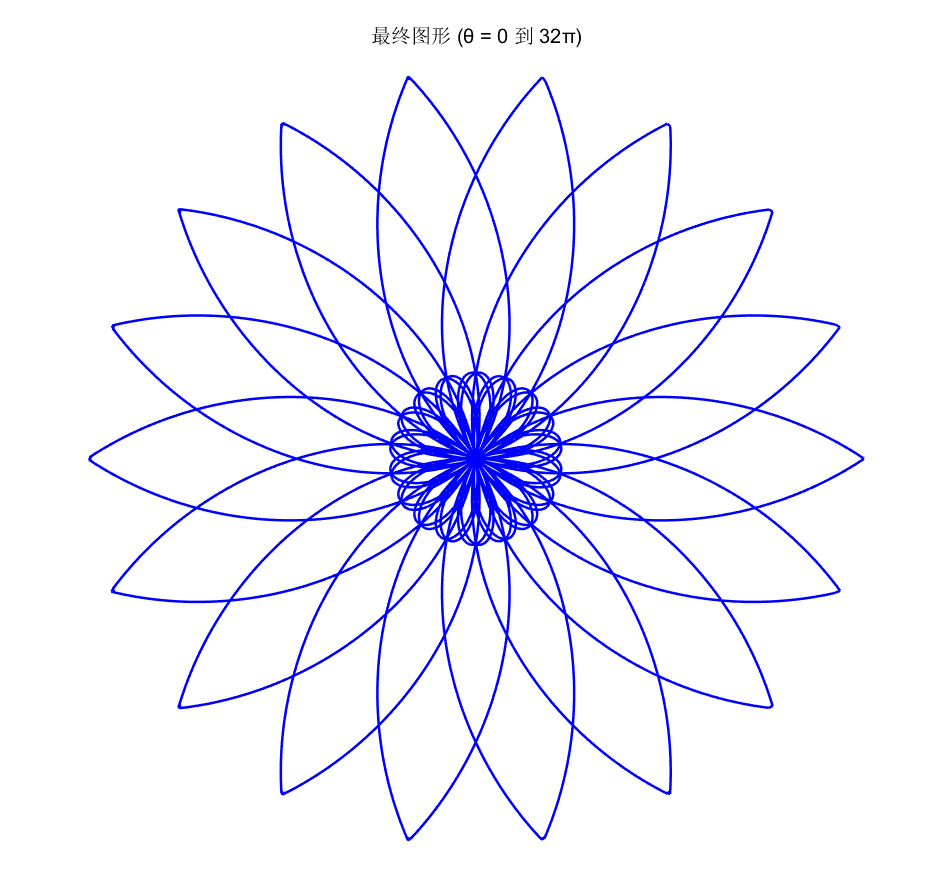
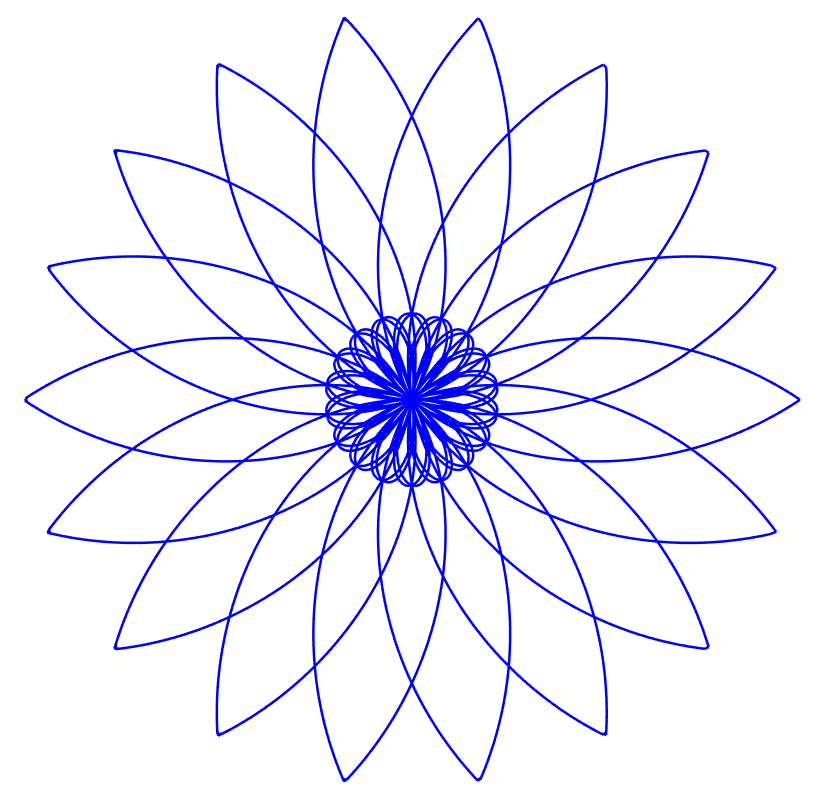
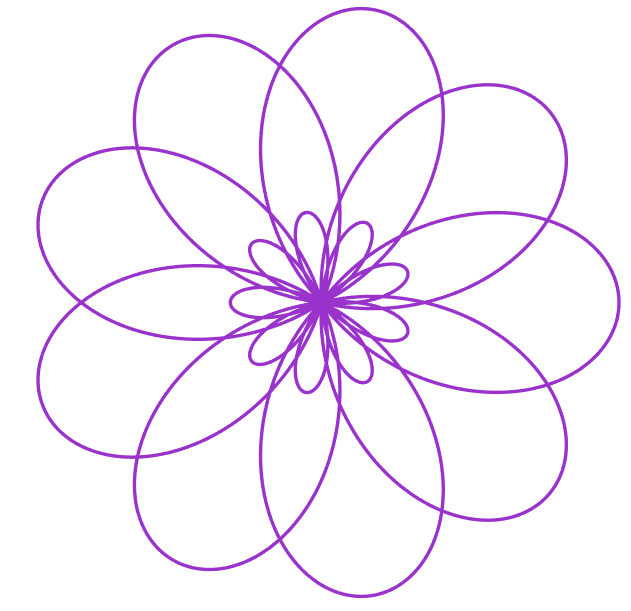
rho = cos(2.25θ) + 0.53
公式:
% rho = cos(2.25θ) + 0.53
clc;            % 清空命令窗口
clear;          % 清空工作區變量
close all;      % 關閉所有圖形窗口% 參數設置
theta_max = 16*pi;
theta_steps = linspace(0, theta_max, 200);
theta_full = linspace(0, theta_max, 5000);% 計算完整圖形數據
rho_full = cos(2.25 * theta_full) + 0.53;
x_full = rho_full .* cos(theta_full);
y_full = rho_full .* sin(theta_full);% 獲取屏幕尺寸
screen_size = get(0, 'ScreenSize');
screen_width = screen_size(3);
screen_height = screen_size(4);% 窗口尺寸設置
window_width = 600;  % 窗口寬度
window_height = 600; % 窗口高度% 創建最終結果窗口(可移動位置)
final_fig = figure('Name', '最終結果 - ρ = cos(2.25θ) + 0.53', 'Color', 'white');
set(final_fig, 'Position', [100, screen_height-window_height-100, window_width, window_height]); % 左上角位置
plot(x_full, y_full, 'Color', [0.6, 0.2, 0.8], 'LineWidth', 2); % 紫色線條,稍微減小線寬
axis equal;
axis off; % 關閉坐標軸
title('ρ = cos(2.25θ) + 0.53', 'FontSize', 12, 'FontWeight', 'bold', 'Color', [0.4, 0.1, 0.6]);% 添加信息文本框
annotation('textbox', [0.02, 0.02, 0.25, 0.08], 'String', ...{'ρ = cos(2.25θ) + 0.53', '復雜玫瑰曲線'}, ...'FitBoxToText', 'on', 'BackgroundColor', 'white', 'FontSize', 9, ...'EdgeColor', 'none', 'Color', [0.4, 0.1, 0.6]);% 創建動畫窗口(可移動位置)
anim_fig = figure('Name', '動畫繪制過程 - ρ = cos(2.25θ) + 0.53');
set(anim_fig, 'Position', [screen_width-window_width-100, screen_height-window_height-100, window_width, window_height]); % 右上角位置
hold on;
axis equal;
grid on;
title('圖形形成過程', 'Color', [0.4, 0.1, 0.6], 'FontSize', 12);
xlabel('x', 'FontSize', 10);
ylabel('y', 'FontSize', 10);% 預繪制完整圖形(淺色背景)
plot(x_full, y_full, 'Color', [0.9, 0.85, 0.95], 'LineWidth', 0.5); % 淡紫色背景% 動畫繪制
h = plot(NaN, NaN, 'Color', [0.6, 0.2, 0.8], 'LineWidth', 1.5); % 紫色線條,稍微減小線寬for i = 1:length(theta_steps)current_theta = linspace(0, theta_steps(i), 1000);current_rho = cos(2.25 * current_theta) + 0.53;current_x = current_rho .* cos(current_theta);current_y = current_rho .* sin(current_theta);set(h, 'XData', current_x, 'YData', current_y);title(sprintf('θ = %.1fπ', theta_steps(i)/pi), 'Color', [0.4, 0.1, 0.6], 'FontSize', 12);drawnow;pause(0.02);
end% 動畫完成后顯示完整圖形
set(h, 'XData', x_full, 'YData', y_full);
title('繪制完成', 'Color', [0.4, 0.1, 0.6], 'FontSize', 12);% 將焦點返回到最終結果窗口
figure(final_fig);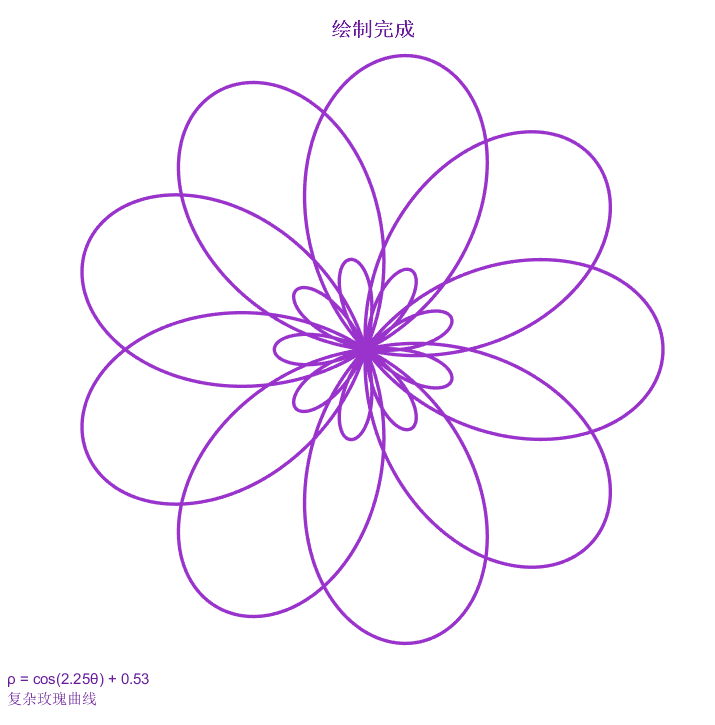
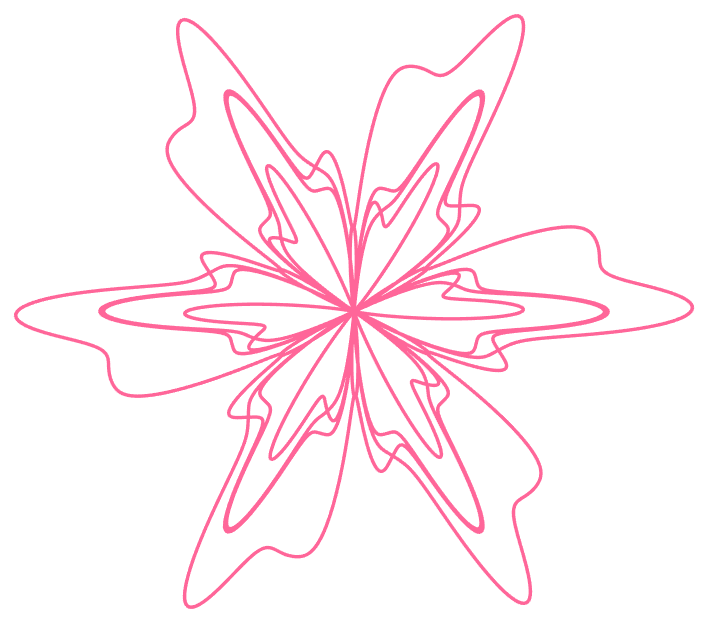
rho=sin(1.2 theta)^(8)+cos(6theta)^(5)+1
公式:
% rho=sin(1.2 theta)^(8)+cos(6theta)^(5)+1
clc;            % 清空命令窗口
clear;          % 清空工作區變量
close all;      % 關閉所有圖形窗口% 參數設置
theta_max = 20*pi;
theta_full = linspace(0, theta_max, 5000);% 計算完整圖形
sin_part = sin(1.2 * theta_full);
cos_part = cos(6 * theta_full);
rho_full = abs(sin_part).^8 .* sign(sin_part) + abs(cos_part).^5 .* sign(cos_part) + 1;
x_full = rho_full .* cos(theta_full);
y_full = rho_full .* sin(theta_full);% 創建最終結果窗口(無坐標軸,粉色線條)
finalFig = figure('Position', [100, 100, 700, 700], 'Name', '最終結果', ...'NumberTitle', 'off', 'Color', 'white');
movegui(finalFig, 'center');plot(x_full, y_full, 'Color', [1, 0.4, 0.6], 'LineWidth', 2); % 粉色線條
axis equal;
axis off; % 關閉坐標軸
title('最終圖形 (θ = 0 到 20π)', 'FontSize', 14, 'Color', [0.5, 0, 0.5]);% 創建動畫窗口
animFig = figure('Position', [300, 300, 700, 700], 'Name', '圖形形成過程', ...'NumberTitle', 'off', 'Color', 'white');
movegui(animFig, 'center');
hold on;
axis equal;
grid on;
title('圖形形成過程');
xlabel('x');
ylabel('y');% 預繪制完整圖形(淺色背景)
plot(x_full, y_full, 'Color', [0.9, 0.9, 0.9], 'LineWidth', 0.5);% 動畫繪制(粉色線條)
theta_steps = linspace(0, theta_max, 150);
h = plot(NaN, NaN, 'Color', [1, 0.4, 0.6], 'LineWidth', 2); % 粉色線條for i = 1:length(theta_steps)current_theta = linspace(0, theta_steps(i), 1000);sin_current = sin(1.2 * current_theta);cos_current = cos(6 * current_theta);current_rho = abs(sin_current).^8 .* sign(sin_current) + abs(cos_current).^5 .* sign(cos_current) + 1;current_x = current_rho .* cos(current_theta);current_y = current_rho .* sin(current_theta);set(h, 'XData', current_x, 'YData', current_y);title(sprintf('θ = %.1fπ', theta_steps(i)/pi));drawnow;pause(0.02);
end% 優先顯示最終結果的窗口
figure(finalFig);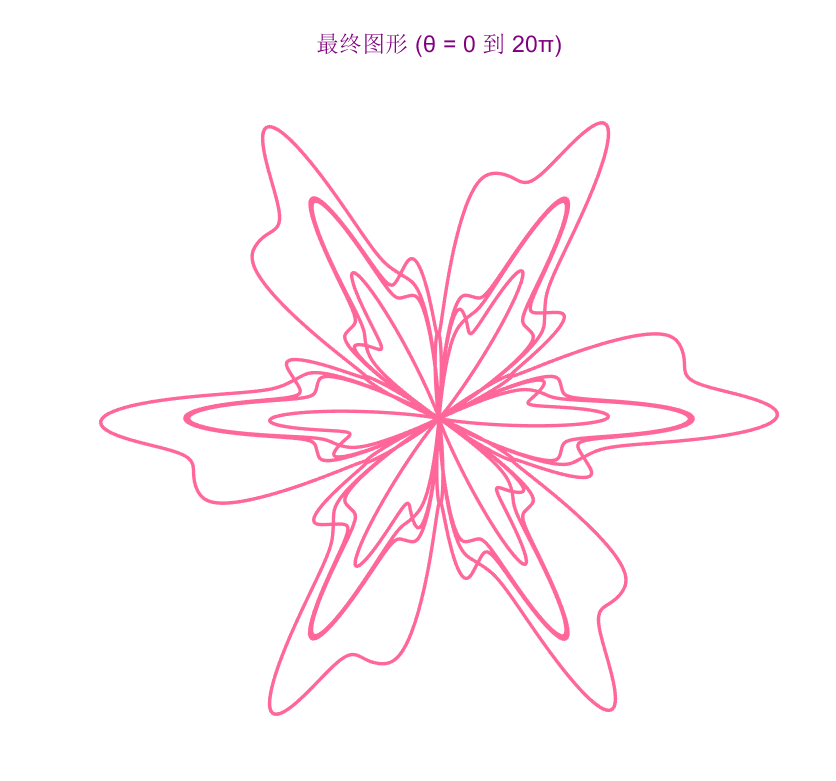
rho=1+((|cos(-5.63 theta)|)+2(0.25-|sin(-5.63 theta)|))/(2+8|sin(-11.26 theta)|)
公式:
% rho=1+((|cos(-5.63 theta)|)+2(0.25-|sin(-5.63 theta)|))/(2+8|sin(-11.26 theta)|)
clc;            % 清空命令窗口
clear;          % 清空工作區變量
close all;      % 關閉所有圖形窗口% 參數設置
theta_max = 6*pi;
theta_full = linspace(0, theta_max, 5000);% 計算完整圖形
cos_full = cos(-5.63 * theta_full);
sin1_full = sin(-5.63 * theta_full);
sin2_full = sin(-11.26 * theta_full);
numerator_full = abs(cos_full) + 2*(0.25 - abs(sin1_full));
denominator_full = 2 + 8*abs(sin2_full);
rho_full = 1 + numerator_full ./ denominator_full;
x_full = rho_full .* cos(theta_full);
y_full = rho_full .* sin(theta_full);% 創建最終結果窗口(無坐標軸,綠色線條)
finalFig = figure('Position', [100, 100, 700, 700], 'Name', '最終結果', ...'NumberTitle', 'off', 'Color', 'white');
movegui(finalFig, 'center');plot(x_full, y_full, 'Color', [0, 0.8, 0], 'LineWidth', 2.5); % 綠色線條
axis equal;
axis off; % 關閉坐標軸
title('最終圖形 (θ = 0 到 6π)', 'FontSize', 14, 'Color', [0, 0.5, 0]);% 創建動畫窗口
animFig = figure('Position', [300, 300, 700, 700], 'Name', '圖形形成過程', ...'NumberTitle', 'off', 'Color', 'white');
movegui(animFig, 'center');
hold on;
axis equal;
grid on;
title('圖形形成過程');
xlabel('x');
ylabel('y');% 預繪制完整圖形(淺色背景)
plot(x_full, y_full, 'Color', [0.9, 0.9, 0.9], 'LineWidth', 0.5);% 動畫繪制(綠色線條)
theta_steps = linspace(0, theta_max, 200);
h = plot(NaN, NaN, 'Color', [0, 0.8, 0], 'LineWidth', 2); % 綠色線條for i = 1:length(theta_steps)current_theta = linspace(0, theta_steps(i), 1000);cos_current = cos(-5.63 * current_theta);sin1_current = sin(-5.63 * current_theta);sin2_current = sin(-11.26 * current_theta);numerator_current = abs(cos_current) + 2*(0.25 - abs(sin1_current));denominator_current = 2 + 8*abs(sin2_current);current_rho = 1 + numerator_current ./ denominator_current;current_x = current_rho .* cos(current_theta);current_y = current_rho .* sin(current_theta);set(h, 'XData', current_x, 'YData', current_y);title(sprintf('θ = %.1fπ', theta_steps(i)/pi));drawnow;pause(0.03);
end% 優先顯示最終結果的窗口
figure(finalFig);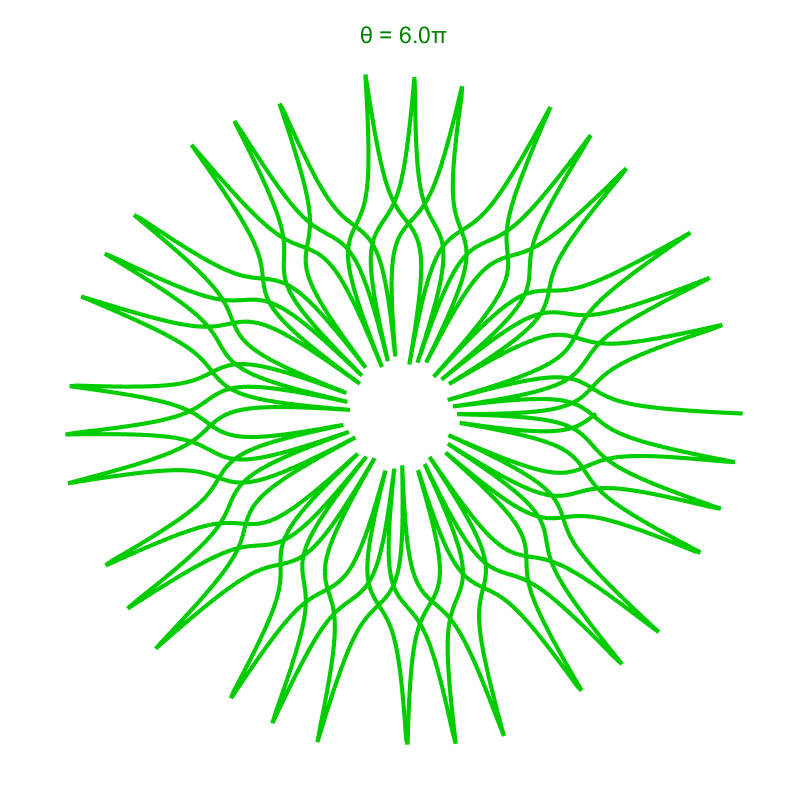
去掉圖注和標題版本


)
