基于機器學習的川崎病輔助診斷工具,結合了數據預處理、模型訓練、特征解釋和交互式可視化。以下是深度解讀:
1. 技術架構
- 框架:使用?Streamlit?構建 Web 應用,適合快速開發交互式數據科學應用。
- 核心算法:
- XGBoost:用于分類的集成學習模型,參數(如?
learning_rate=0.01,?max_depth=5)模仿論文中的設置。 - SHAP(SHapley Additive exPlanations):用于解釋模型預測的可解釋性工具。
- XGBoost:用于分類的集成學習模型,參數(如?
- 數據預處理:生成模擬數據(實際應替換為醫院真實數據),并劃分訓練/測試集。
2. 模塊化設計
2.1 數據加載與模型訓練
@st.cache_resource
def load_model_and_data():# 生成模擬數據(實際應替換為真實數據)data = pd.DataFrame({ ... })# 特征選擇selected_features = [ ... ]X = data[selected_features]y = data['KD_diagnosis']# 劃分訓練/測試集X_train, X_test, y_train, y_test = train_test_split(X, y, test_size=0.2, random_state=42)# 訓練 XGBoost 模型model = xgb.XGBClassifier(...)model.fit(X_train, y_train)# 創建 SHAP 解釋器explainer = shap.TreeExplainer(model)return model, explainer, X_train, selected_features- 關鍵點:
@st.cache_resource?緩存模型和數據,提高性能。- 使用論文參數(如?
subsample=0.8,?n_estimators=300)確保結果可復現。 TreeExplainer?是 SHAP 對樹模型的專用解釋器。
2.2 輔助函數
def anonymize_data(input_data):"""數據脫敏:使用 SHA-256 哈希保護隱私"""hashed_data = {}for key, value in input_data.items():hasher = hashlib.sha256(f"{key}_{value}".encode())hashed_data[key] = hasher.hexdigest()[:8]return hashed_data- 隱私保護:對用戶輸入的敏感數據(如年齡、血清鈉)進行哈希處理,生成唯一匿名ID。
def generate_shap_plot(input_array):"""生成 SHAP 特征重要性圖"""shap_values = explainer.shap_values(input_array)plt.figure()shap.summary_plot(shap_values, input_array, feature_names=features, show=False)plt.tight_layout()return plt- 可視化:使用?
shap.summary_plot?展示每個特征對模型預測的貢獻,幫助醫生理解診斷依據。
3. 用戶界面設計
3.1 布局與交互
- 分列布局:左側輸入數據,右側展示診斷結果和研究信息。
- 輸入組件:使用?
st.slider、st.number_input?等組件收集10項關鍵指標(如年齡、CRP、白蛋白等)。 - 按鈕觸發:點擊 "執行川崎病診斷" 按鈕觸發預測邏輯。
3.2 診斷結果展示
if st.button("執行川崎病診斷", use_container_width=True):input_array = pd.DataFrame([input_data], columns=features)proba = model.predict_proba(input_array)[0][1]risk = "高" if proba > 85 else "中" if proba > 60 else "低"# 動態建議if proba > 85:st.success("強烈建議進行冠狀動脈超聲檢查并啟動IVIG治療")# SHAP 圖與表格fig = generate_shap_plot(input_array)st.pyplot(fig)contrib_df = pd.DataFrame({ ... })st.dataframe(contrib_df)- 風險分類:根據預測概率(
proba)分為高/中/低風險,提供不同級別的建議。 - 可解釋性:通過 SHAP 圖和表格展示每個特征對診斷的貢獻(如 "CRP 升高促進診斷")。
完整代碼
import streamlit as st
import pandas as pd
import numpy as np
import xgboost as xgb
import shap
import joblib
from sklearn.model_selection import train_test_split
import matplotlib.pyplot as plt
import base64
import hashlib# ========================
# 數據預處理與模型加載模塊
# ========================
@st.cache_resource
def load_model_and_data():# 模擬論文中的臨床數據集(實際應替換為醫院真實數據)data = pd.DataFrame({'age_months': np.random.randint(1, 120, 1000), # 月齡'fibrinogen': np.random.uniform(1.0, 10.0, 1000), # 纖維蛋白原(FIB)'crp': np.random.uniform(0.1, 200.0, 1000), # C反應蛋白(CRP)'esr': np.random.randint(5, 120, 1000), # 血沉(ESR)'wbc': np.random.uniform(3.0, 30.0, 1000), # 白細胞計數(WBC)'plt': np.random.randint(100, 800, 1000), # 血小板計數(PLT)'alb': np.random.uniform(25.0, 50.0, 1000), # 白蛋白(ALB)'alt': np.random.randint(10, 300, 1000), # 谷丙轉氨酶(ALT)'na': np.random.uniform(130.0, 150.0, 1000), # 血清鈉(Na)'duration_fever': np.random.randint(1, 14, 1000), # 發熱持續時間'KD_diagnosis': np.random.choice([0, 1], 1000, p=[0.7, 0.3]) # 診斷標簽})# 選擇論文確定的10個關鍵特征selected_features = ['age_months', 'fibrinogen', 'crp', 'esr', 'wbc','plt', 'alb', 'alt', 'na', 'duration_fever']X = data[selected_features]y = data['KD_diagnosis']# 劃分訓練測試集(論文方法)X_train, X_test, y_train, y_test = train_test_split(X, y, test_size=0.2, random_state=42)# 訓練XGBoost模型(論文參數)model = xgb.XGBClassifier(learning_rate=0.01,max_depth=5,n_estimators=300,subsample=0.8,eval_metric='logloss',use_label_encoder=False)model.fit(X_train, y_train)# 創建SHAP解釋器(論文方法)explainer = shap.TreeExplainer(model)return model, explainer, X_train, selected_features# 初始化模型和解釋器
model, explainer, X_train, features = load_model_and_data()# ========================
# 輔助函數模塊
# ========================
def anonymize_data(input_data):"""數據脫敏處理(符合醫療隱私要求)"""hashed_data = {}for key, value in input_data.items():hasher = hashlib.sha256(f"{key}_{value}".encode())hashed_data[key] = hasher.hexdigest()[:8]return hashed_datadef generate_shap_plot(input_array):"""生成SHAP解釋圖(論文圖3方法)"""shap_values = explainer.shap_values(input_array)plt.figure()shap.summary_plot(shap_values, input_array, feature_names=features, show=False)plt.tight_layout()return plt# ========================
# Streamlit 應用界面
# ========================
st.set_page_config(page_title="川崎病輔助診斷",page_icon="dao",layout="wide"
)# 標題和介紹(符合論文描述)
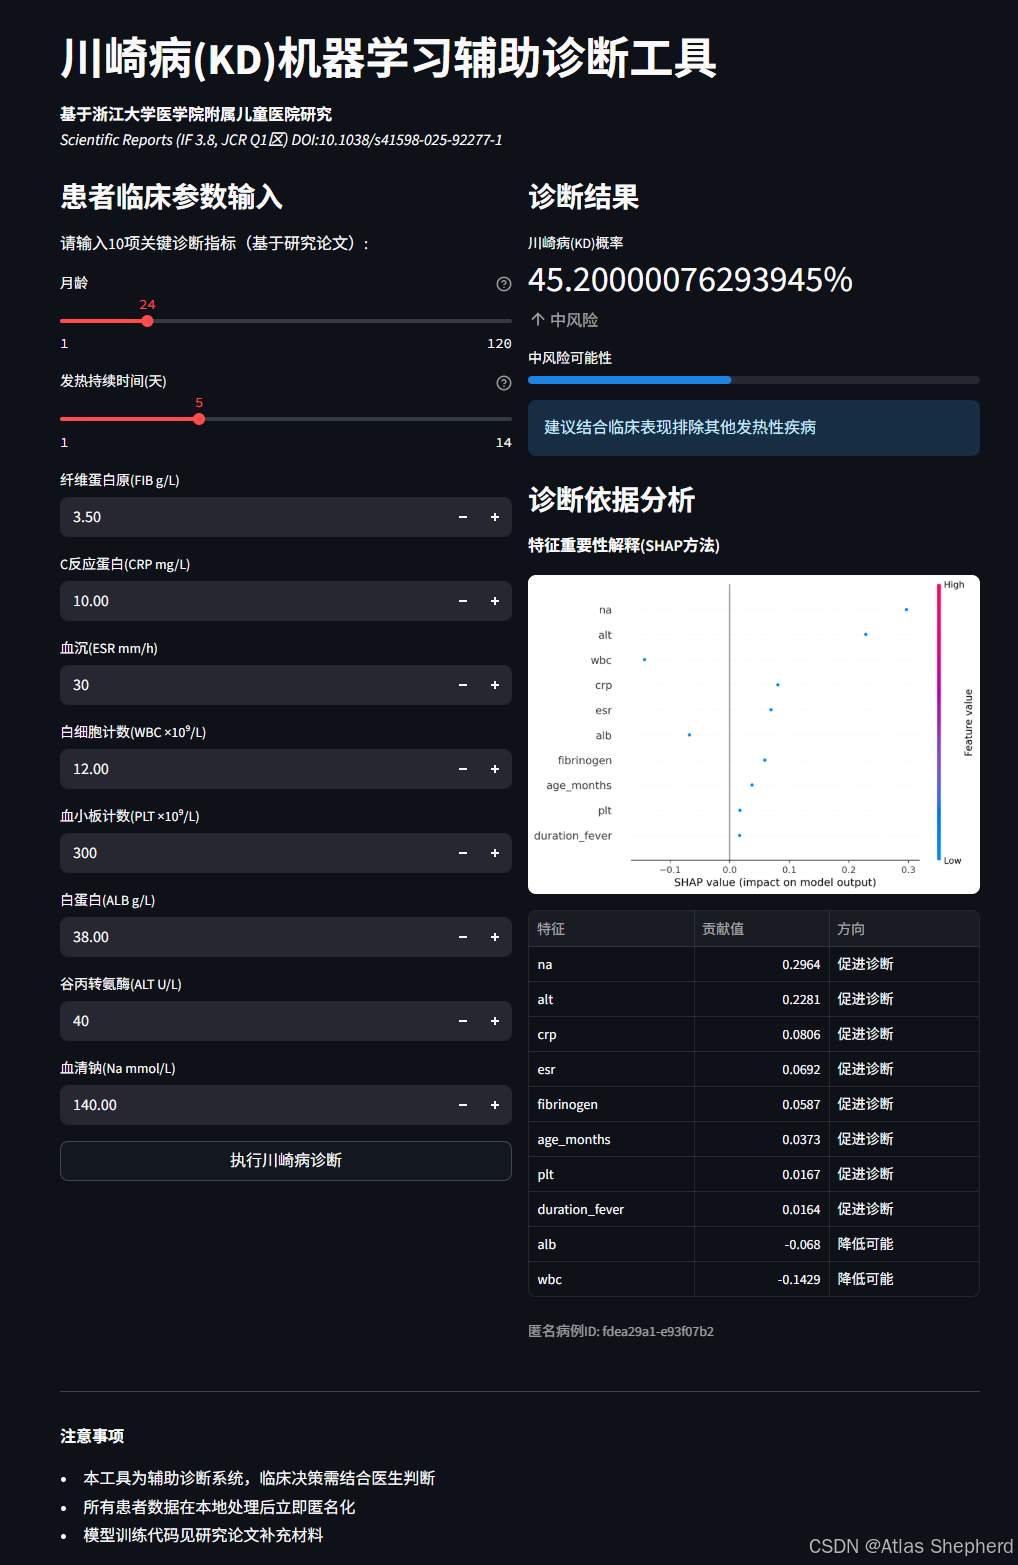
st.title("川崎病(KD)機器學習輔助診斷工具")
st.markdown("""
**基于浙江大學醫學院附屬兒童醫院研究**
*Scientific Reports (IF 3.8, JCR Q1區) DOI:10.1038/s41598-025-92277-1*
""")# 創建兩列布局
col1, col2 = st.columns([1, 1])# ========================
# 左側:患者數據輸入
# ========================
with col1:st.subheader("患者臨床參數輸入")st.markdown("請輸入10項關鍵診斷指標(基于研究論文):")# 創建輸入表單input_data = {}input_data['age_months'] = st.slider("月齡", 1, 120, 24, help="患者當前月齡")input_data['duration_fever'] = st.slider("發熱持續時間(天)", 1, 14, 5, help="持續發熱天數")input_data['fibrinogen'] = st.number_input("纖維蛋白原(FIB g/L)", 1.0, 10.0, 3.5, step=0.1)input_data['crp'] = st.number_input("C反應蛋白(CRP mg/L)", 0.1, 200.0, 10.0, step=0.1)input_data['esr'] = st.number_input("血沉(ESR mm/h)", 5, 120, 30)input_data['wbc'] = st.number_input("白細胞計數(WBC ×10?/L)", 3.0, 30.0, 12.0, step=0.1)input_data['plt'] = st.number_input("血小板計數(PLT ×10?/L)", 100, 800, 300)input_data['alb'] = st.number_input("白蛋白(ALB g/L)", 25.0, 50.0, 38.0, step=0.1)input_data['alt'] = st.number_input("谷丙轉氨酶(ALT U/L)", 10, 300, 40)input_data['na'] = st.number_input("血清鈉(Na mmol/L)", 130.0, 150.0, 140.0, step=0.1)# 診斷按鈕if st.button("執行川崎病診斷", use_container_width=True):# 轉換為模型輸入格式input_array = pd.DataFrame([input_data], columns=features)# 預測診斷概率proba = model.predict_proba(input_array)[0][1]kd_prob = round(proba * 100, 1)# 右側顯示診斷結果with col2:st.subheader("診斷結果")# 顯示風險指標(論文方法)risk_level = "高風險" if kd_prob > 70 else "中風險" if kd_prob > 30 else "低風險"color = "#ff4b4b" if risk_level == "高風險" else "#f0a929" if risk_level == "中風險" else "#0f9d58"st.metric("川崎病(KD)概率", f"{kd_prob}%",delta=risk_level, delta_color="off")# 修復:確保傳入的值是Python float類型progress_value = float(kd_prob / 100)st.progress(progress_value, text=f"{risk_level}可能性")# 診斷建議(基于論文臨床意義)if kd_prob > 85:st.success("強烈建議進行冠狀動脈超聲檢查并啟動IVIG治療")elif kd_prob > 60:st.warning("建議復查實驗室指標并觀察臨床癥狀進展")else:st.info("建議結合臨床表現排除其他發熱性疾病")# SHAP解釋可視化st.subheader("診斷依據分析")st.markdown("**特征重要性解釋(SHAP方法)**")# 生成SHAP圖fig = generate_shap_plot(input_array)st.pyplot(fig)# 特征貢獻表格shap_values = explainer.shap_values(input_array)[0]contrib_df = pd.DataFrame({'特征': features,'貢獻值': shap_values,'方向': ['促進診斷' if x > 0 else '降低可能' for x in shap_values]}).sort_values('貢獻值', ascending=False)st.dataframe(contrib_df, hide_index=True, use_container_width=True)# 數據脫敏保存(符合醫療規范)anonymized = anonymize_data(input_data)st.caption(f"匿名病例ID: {anonymized['age_months']}-{anonymized['crp']}")# 設置session狀態,表示已診斷st.session_state.diagnosed = True# ========================
# 右側:研究信息展示
# ========================
with col2:if not st.session_state.get('diagnosed', False):st.subheader("研究背景")st.markdown("""**研究亮點** - 基于XGBoost的機器學習模型(AUC=0.9757)- 10項關鍵臨床指標組合診斷- SHAP可解釋性算法支持臨床決策- 國家兒童健康與疾病臨床醫學研究中心驗證""")st.image("https://mmbiz.qpic.cn/mmbiz_jpg/C9DH9oqiay9Q490wNo0m7xIqBY2RLu5icB8yeTRLC229mUdW9t6vw0cib2wtcibicy0mnjuoAQL7FH0VEvaXsu7drMw/640?wx_fmt=jpeg&randomid=6ulh0iwi&tp=wxpic&wxfrom=5&wx_lazy=1",caption="SU")st.markdown("""**使用方法** 1. 在左側輸入患者臨床參數2. 點擊"執行川崎病診斷"按鈕3. 查看右側診斷結果和解釋分析""")# ========================
# 道;
# ========================
st.divider()
st.markdown("""
**注意事項**
- 本工具為輔助診斷系統,臨床決策需結合醫生判斷
- 所有患者數據在本地處理后立即匿名化
- 模型訓練代碼見研究論文補充材料
""")


)


)


