一、使用echarts
1.引入 Apache ECharts
<!DOCTYPE html> <html> <head> <meta charset="utf-8" /> <!-- 引入剛剛下載的 ECharts 文件 --> <script src="echarts.js"></script> </head> </html>
2.ECharts 準備一個定義了高寬的 DOM 容器
?<body> <!-- 為 ECharts 準備一個定義了寬高的 DOM --> <div id="main" style="width: 600px;height:400px;"></div> </body>
3.基于準備好的dom,初始化echarts實例
var myChart = echarts.init(document.getElementById('main'));
4.指定圖表配置項
var option = { }
5.主要配置項
series – 系列列表。每個系列通過 type 決定自己的圖表類型 – 通俗的理解:圖標數據,指定什么類型的圖標,可以多個圖表重疊。
xAxis:直角坐標系 grid 中的 x 軸
– boundaryGap: 坐標軸兩邊留白策略 true,這時候刻度只是作為分隔線,標簽和數據點都會在兩個刻度之間的帶(band)中間。
yAxis:直角坐標系 grid 中的 y 軸
grid:直角坐標系內繪圖網格。
title:標題組件
tooltip:提示框組件
legend:圖例組件
color:調色盤顏色列表
stack:數據堆疊,同個類目軸上系列配置相同的stack值后 后一個系列的值會在前一個系列的值上相加。
myChart.resize :為圖表設置特定的大小
啟動echarts
myChart.setOption(option)
?二、柱狀圖
1.serises:{}
2.itemStyle:{}
柱條的樣式可以通過 series.itemStyle 設置,包括:
柱條的顏色(color);
柱條的描邊顏色(borderColor)、
寬度(borderWidth)、
樣式(borderType);
柱條圓角的半徑(barBorderRadius);
柱條透明度(opacity);
陰影(shadowBlur、shadowColor、shadowOffsetX、shadowOffsetY)
3.barWidth:20% 柱條寬度和高度
4.barGap: 不同系列在同一類目下的距離 barCategoryGap: 類目與類目的距離
設置 barGap 及 barCategoryGap 后,就不需要設置 barWidth 了,這時候的寬度會自動調整。如果有需要的話,可以設置 barMaxWidth 作為柱條寬度的上限,當圖表寬度很大的時候,柱條寬度也不會太寬。
5.showBackground:true 開啟背景色;
backgroundStyle:{cokor:'ragb(,,,,)'} 配置顏色。
三、柱狀圖
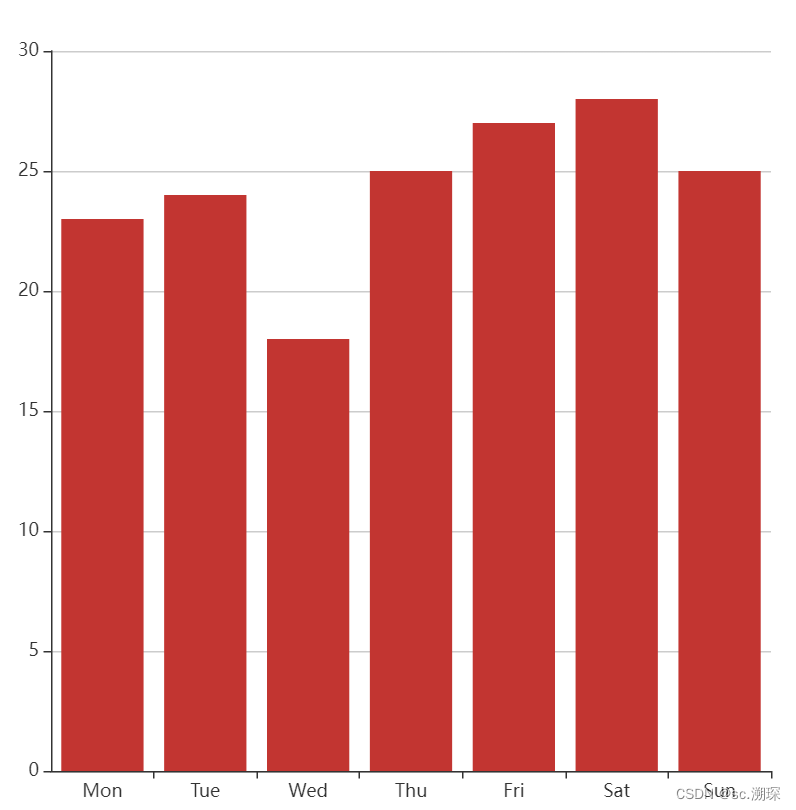
1.基礎柱狀圖
option = {xAxis: {data: ['Mon', 'Tue', 'Wed', 'Thu', 'Fri', 'Sat', 'Sun']},yAxis: {},series: [{type: 'bar',data: [23, 24, 18, 25, 27, 28, 25]}]
};
2.
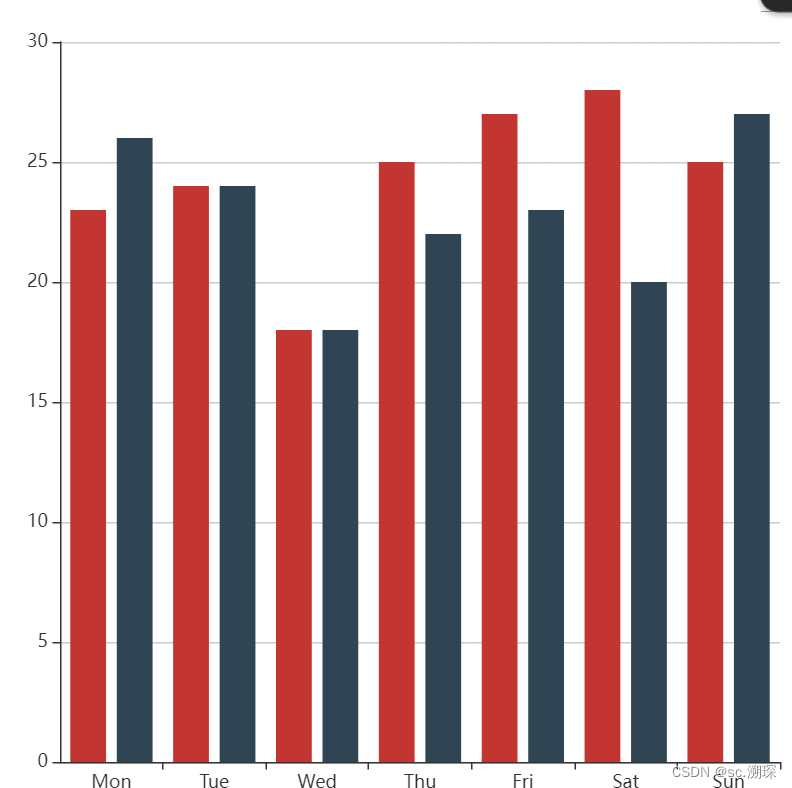
多系列的柱狀圖
option = {xAxis: {data: ['Mon', 'Tue', 'Wed', 'Thu', 'Fri', 'Sat', 'Sun']},yAxis: {},series: [{type: 'bar',data: [23, 24, 18, 25, 27, 28, 25]},{type: 'bar',data: [26, 24, 18, 22, 23, 20, 27]}]
};
3.
堆疊柱狀圖(通過stack進行疊加)
option = {xAxis: {data: ['A', 'B', 'C', 'D', 'E']},yAxis: {},series: [{data: [10, 22, 28, 43, 49],type: 'bar',stack: 'x'},{data: [5, 4, 3, 5, 10],type: 'bar',stack: 'x'}]
};
5.4.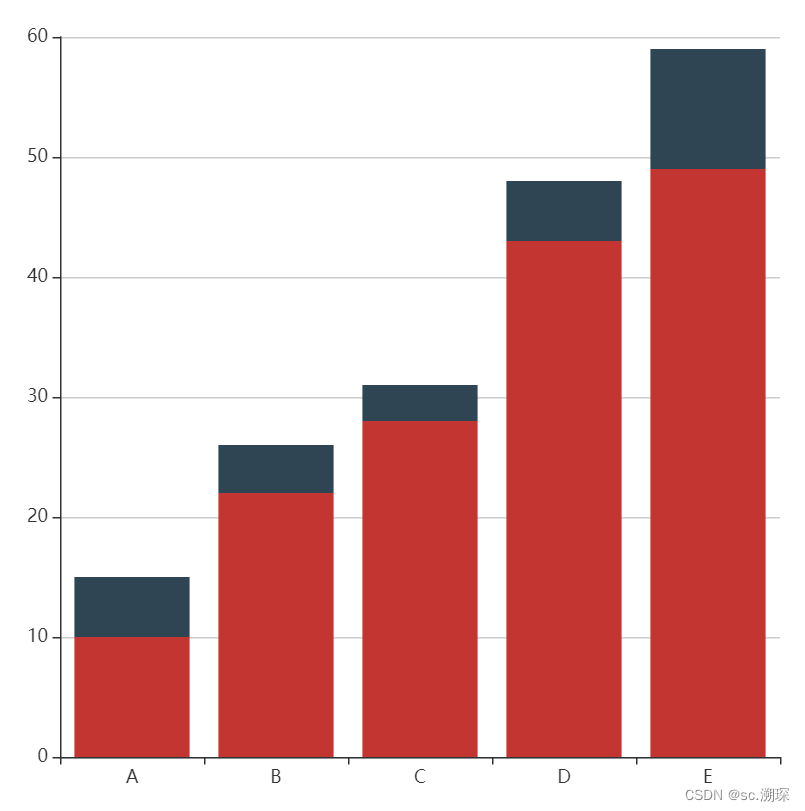
?4.階梯瀑布圖(這里用的是itemstyle實現瀑布圖)
var option = {title: {text: "不同城市消費總金額(單位:元)",show: true,},xAxis: {type: "category",data: ["廣州", "佛山", "深圳", "東莞"]},yAxis: {type: "value",max: 3500},toolbox: {feature: {dataView: {},restore: {},saveAsImage: {},}},series: [{name: "輔助",type: "bar",data: [0, 801, 1094, 635],stack: 'fy',itemStyle: {borderColor: 'rgba(20,20,0,0.5)',borderWidth:5,color: 'rgba(0,220,0,0.8)'},},{name: "生活費",type: "bar",data: [3076, 2275, 1181, 546],stack: 'fy',label: {show: true,rotate: 0, }, },] }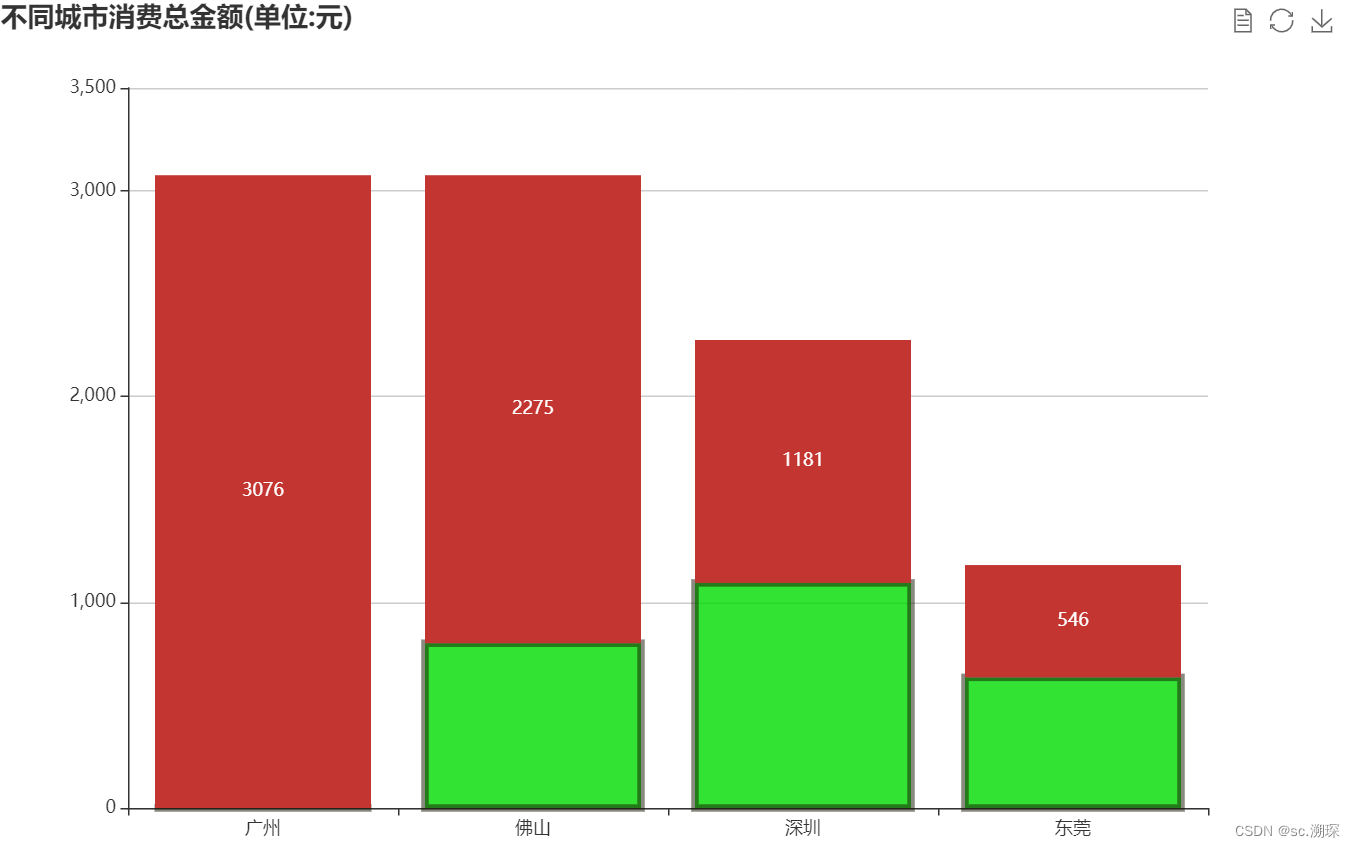
?
三、折線圖
?
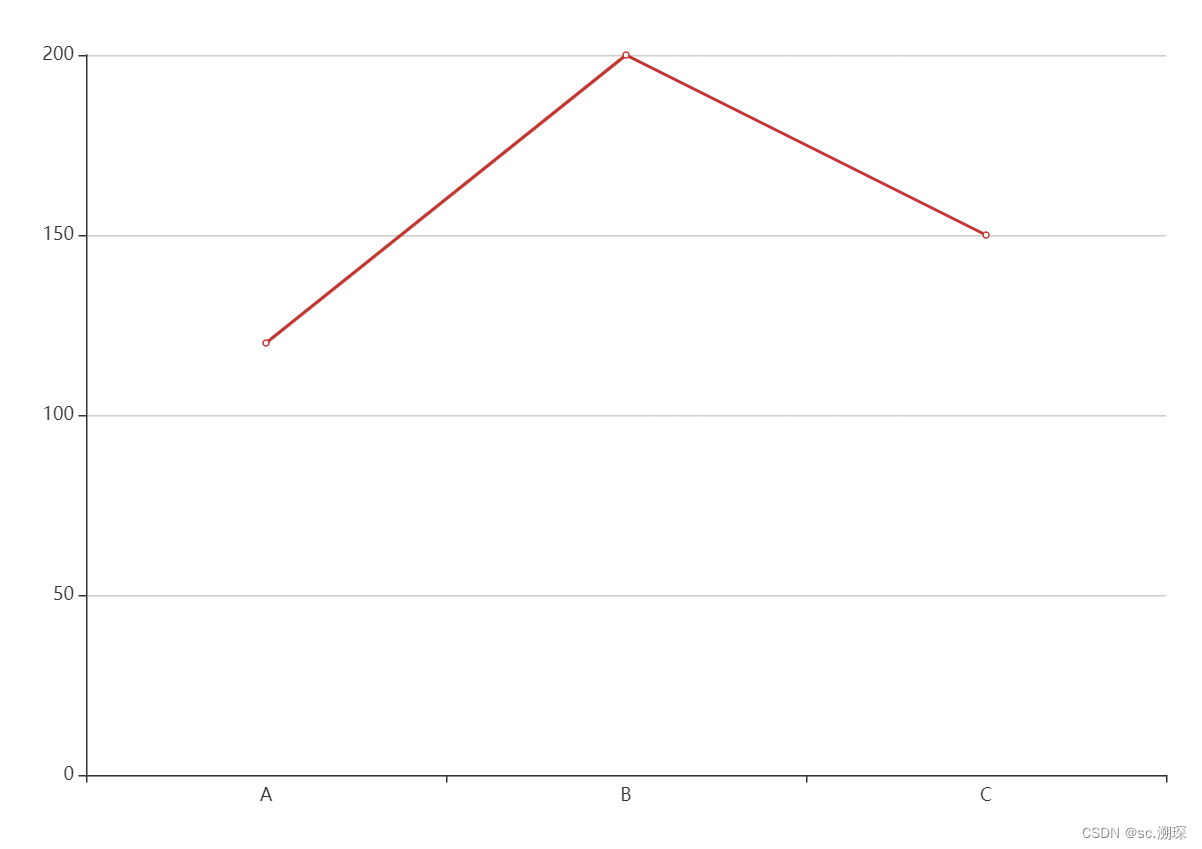
1.基礎折線圖
option = { xAxis: { type: 'category', data: ['A', 'B', 'C'] }, yAxis: { type: 'value' }, series: [ { data: [120, 200, 150], type: 'line' } ] };
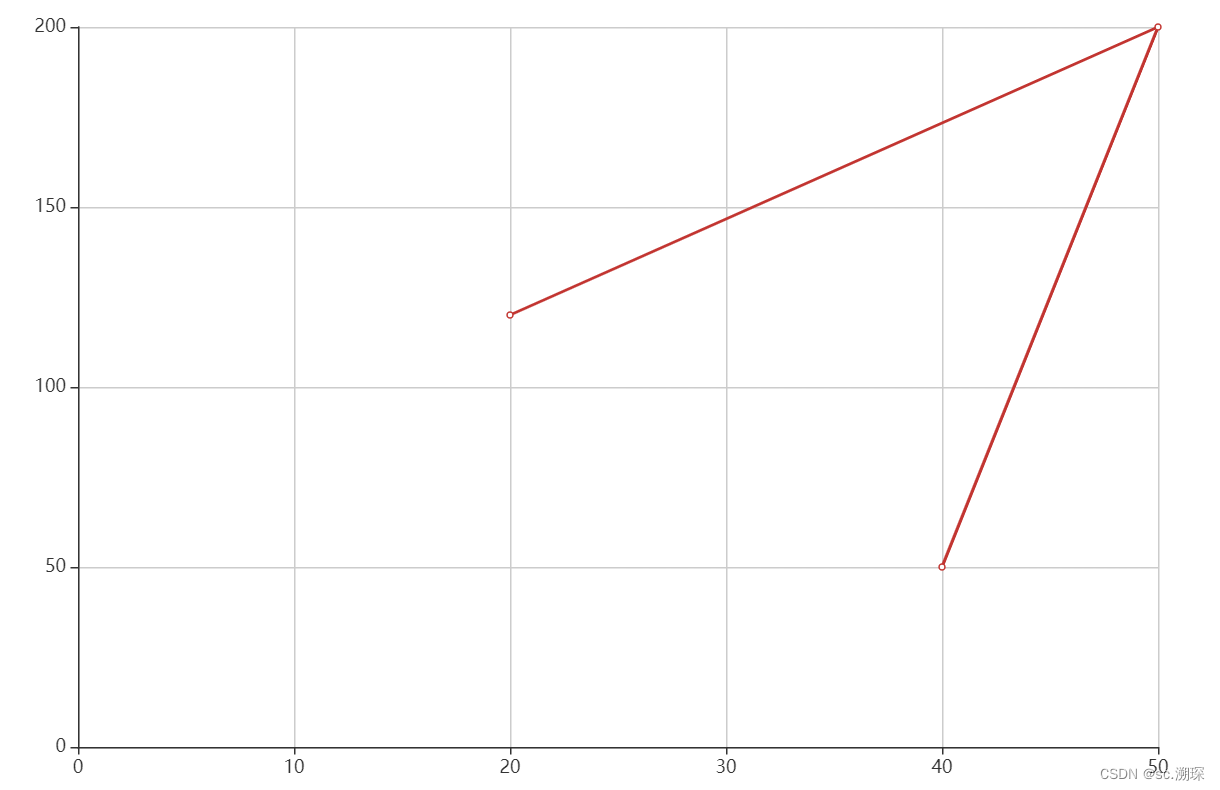
2.笛卡爾坐標系中的折線圖
option = { xAxis: {}, yAxis: {}, series: [ { data: [ [20, 120], [50, 200], [40, 50] ], type: 'line' } ] };
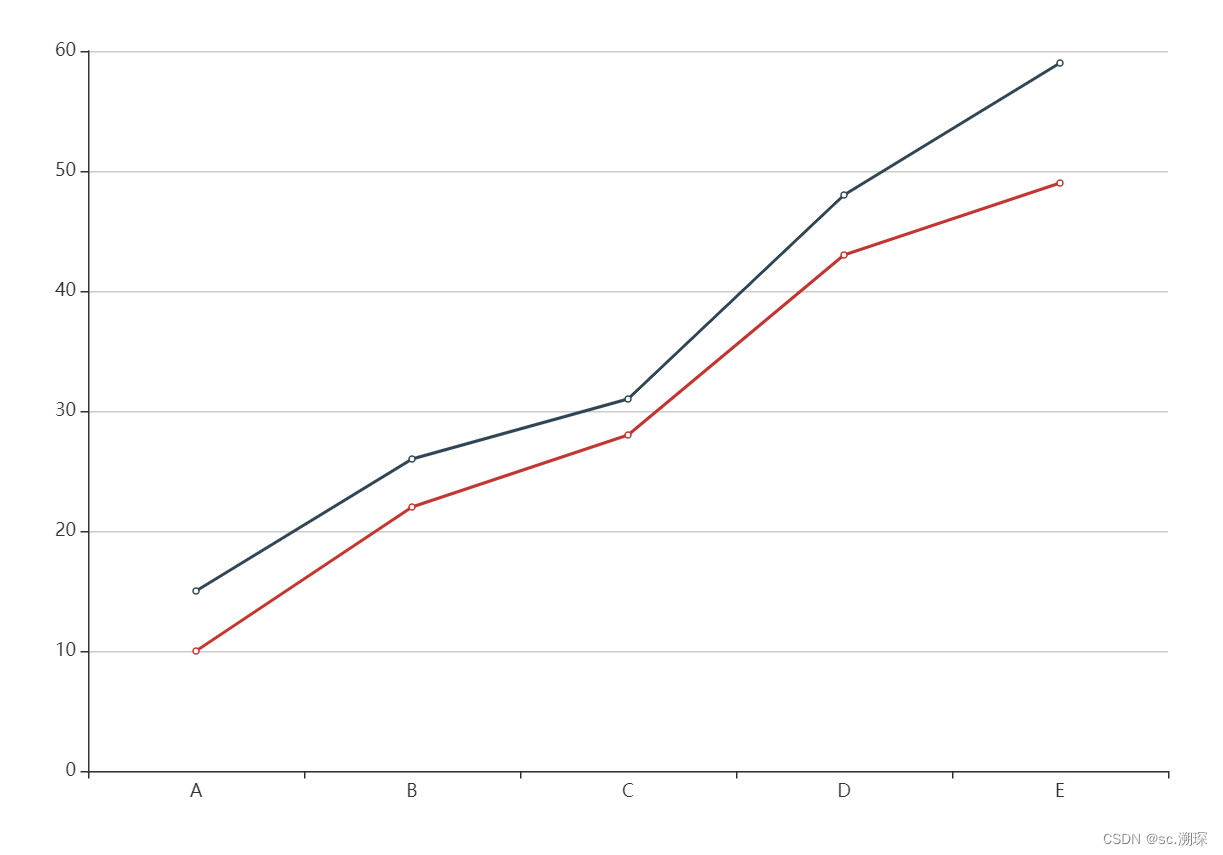
3.堆疊折線圖
option = { xAxis: { data: ['A', 'B', 'C', 'D', 'E'] }, yAxis: {}, series: [ { data: [10, 22, 28, 43, 49], type: 'line', stack: 'x' }, { data: [5, 4, 3, 5, 10], type: 'line', stack: 'x' } ] };
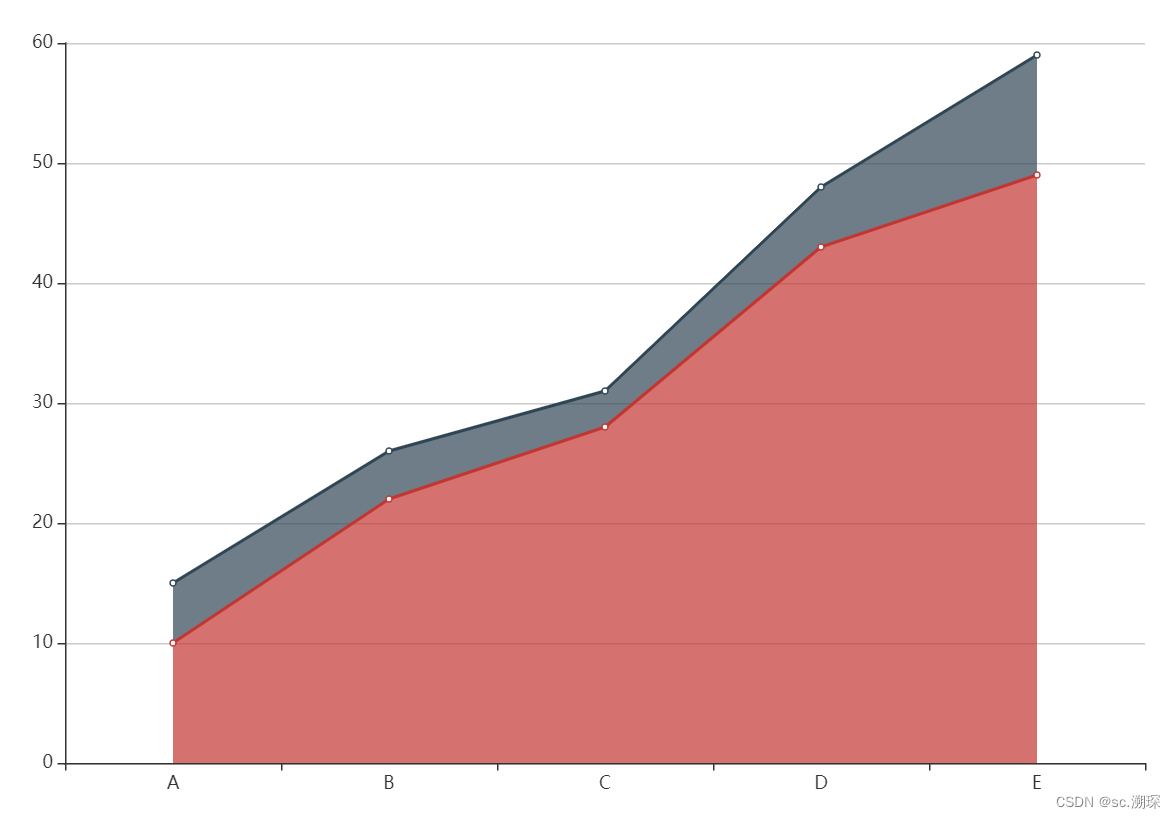
4.堆疊折線圖(areastyle)填色
option = { xAxis: { data: ['A', 'B', 'C', 'D', 'E'] }, yAxis: {}, series: [ { data: [10, 22, 28, 43, 49], type: 'line', stack: 'x', areaStyle: {} }, { data: [5, 4, 3, 5, 10], type: 'line', stack: 'x', areaStyle: {} } ] };
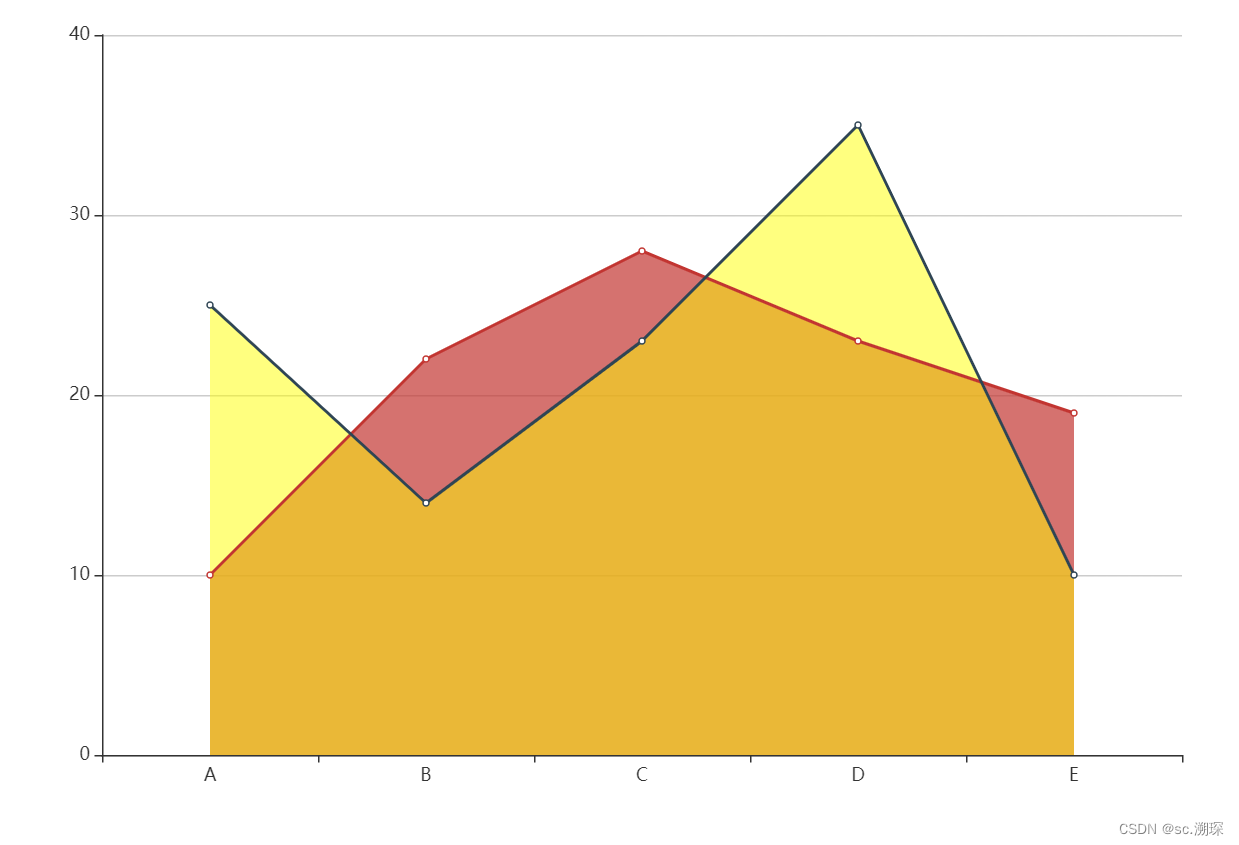
5.區域面積圖(用areastyle) color 顏色 opacity 圖型透明度 (0-1)0不繪制
option = { xAxis: { data: ['A', 'B', 'C', 'D', 'E'] }, yAxis: {}, series: [ { data: [10, 22, 28, 23, 19], type: 'line', areaStyle: {} }, { data: [25, 14, 23, 35, 10], type: 'line', areaStyle: { color: '#ff0', opacity: 0.5 } } ] };
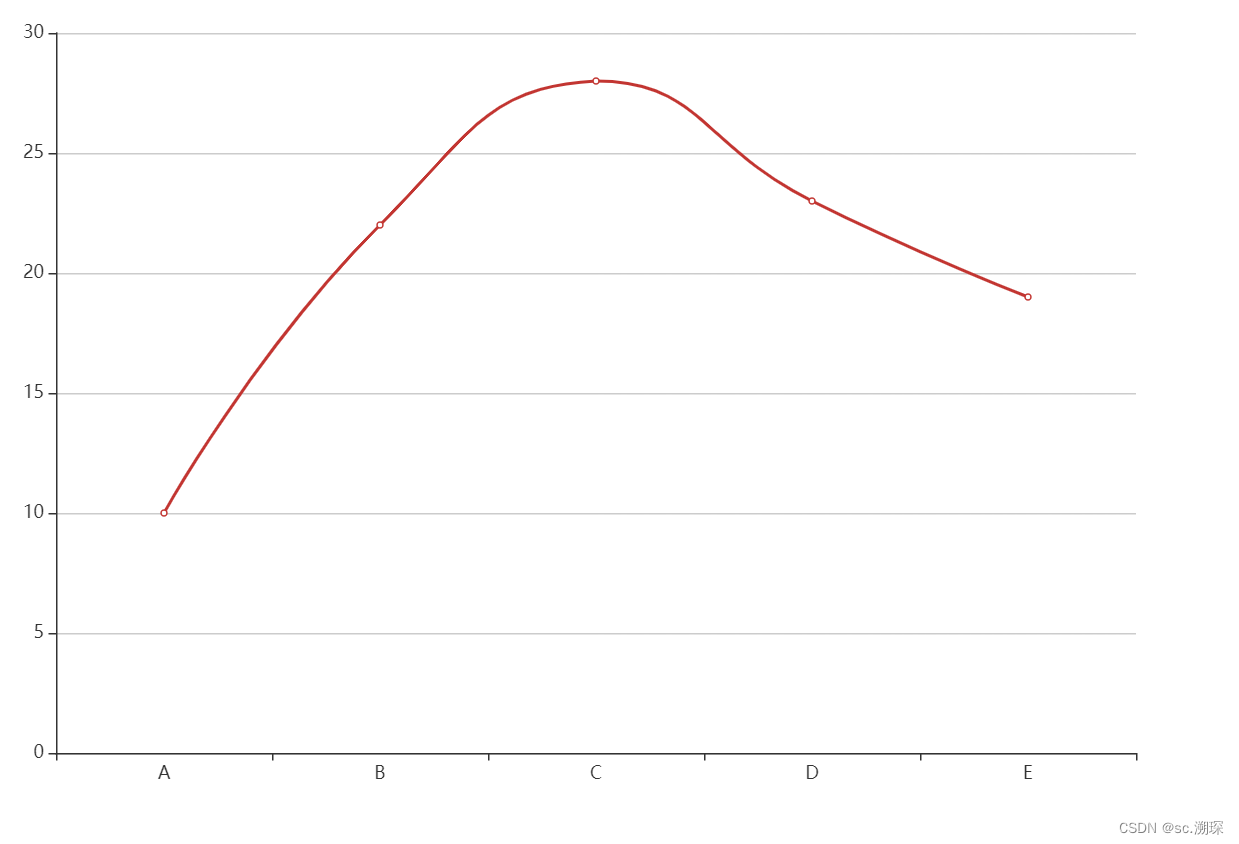
6.平滑曲線圖 (smooth)
option = { xAxis: { data: ['A', 'B', 'C', 'D', 'E'] }, yAxis: {}, series: [ { data: [10, 22, 28, 23, 19], type: 'line', smooth: true } ] };
7.階梯線圖 (step)
option = { xAxis: { type: 'category', data: ['Mon', 'Tue', 'Wed', 'Thu', 'Fri', 'Sat', 'Sun'] }, yAxis: { type: 'value' }, series: [ { name: 'Step Start', type: 'line', step: 'start', data: [120, 132, 101, 134, 90, 230, 210] }, { name: 'Step Middle', type: 'line', step: 'middle', data: [220, 282, 201, 234, 290, 430, 410] }, { name: 'Step End', type: 'line', step: 'end', data: [450, 432, 401, 454, 590, 530, 510] } ] };
三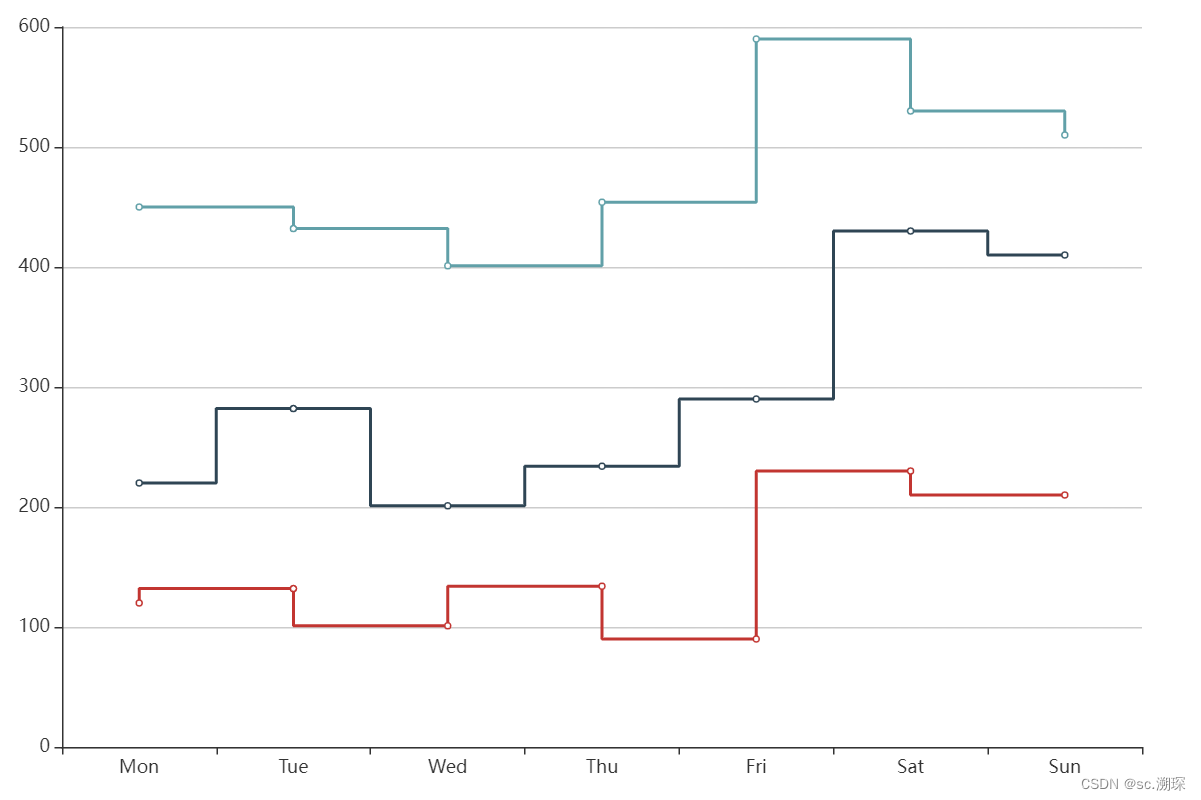
?三、圓餅圖
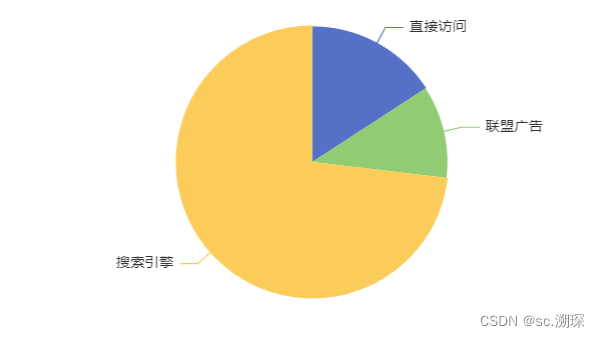
餅圖
最簡單的餅狀圖
option = { series: [ { type: 'pie', data: [ { value: 335, name: '直接訪問' }, { value: 234, name: '聯盟廣告' }, { value: 1548, name: '搜索引擎' } ] } ] };
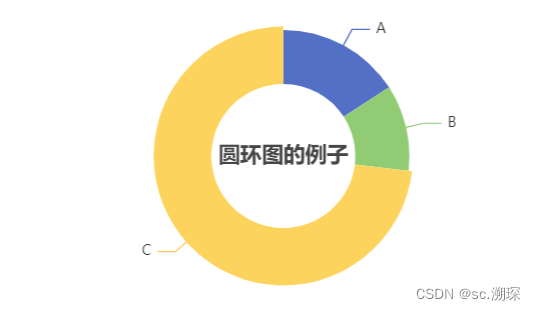
圓環圖
option = { title: { text: '圓環圖的例子', left: 'center', top: 'center' }, series: [ { type: 'pie', data: [ { value: 335, name: 'A' }, { value: 234, name: 'B' }, { value: 1548, name: 'C' } ], radius: ['40%', '70%'] } ] };
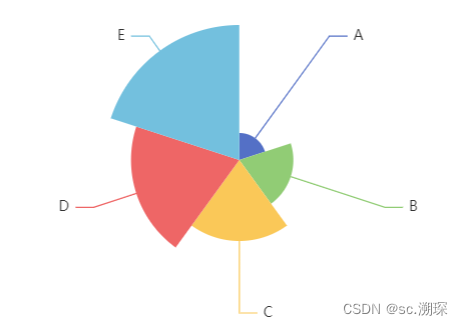
南丁格爾圖(玫瑰圖)
option = { series: [ { type: 'pie', data: [ { value: 100, name: 'A' }, { value: 200, name: 'B' }, { value: 300, name: 'C' }, { value: 400, name: 'D' }, { value: 500, name: 'E' } ], roseType: 'area' } ] };
散點圖
基礎散點圖
option = { xAxis: { data: ['Sun', 'Mon', 'Tue', 'Wed', 'Thu', 'Fri', 'Sat'] }, yAxis: {}, series: [ { type: 'scatter', data: [220, 182, 191, 234, 290, 330, 310] } ] };
標記(mark)、
數據區域縮放(dataZoom)、
數據視圖(dataView)、
動態類型切換(magicType)、
重置(restore)、
導出圖片(saveAsImage)。
toolbox: { feature: { dataZoom: {}, dataView: {}, magicType: {}, restore: {}, saveAsImage: {} } }
?=========================================================================
-
文本樣式
-
字體基本樣式設置:fontStyle、fontWeight、fontSize、fontFamily。 文字顏色:color。 文字描邊:textBorderColor、textBorderWidth。 文字陰影:textShadowColor、textShadowBlur、textShadowOffsetX、textShadowOffsetY。 文本塊或文本片段大小:lineHeight、width、height、padding。 文本塊或文本片段的對齊:align、verticalAlign。 文本塊或文本片段的邊框、背景(顏色或圖片):backgroundColor、borderColor、borderWidth、borderRadius。 文本塊或文本片段的陰影:shadowColor、shadowBlur、shadowOffsetX、shadowOffsetY。 文本塊的位置和旋轉:position、distance、rotate。
-
-
文本、文本框、文本片段的基本樣式和裝飾
-
每個文本可以設置基本的字體樣式:fontStyle、fontWeight、fontSize、fontFamily。 可以設置文字的顏色 color 和邊框的顏色 textBorderColor、textBorderWidth。 文本框可以設置邊框和背景的樣式:borderColor、borderWidth、backgroundColor、padding。 文本片段也可以設置邊框和背景的樣式:borderColor、borderWidth、backgroundColor、padding。
-


)
)


)


)

