介紹
prometheaus 一個定時輸出指標數據的巡檢組件?
grafana 一個讀取指標,可視化的提供了好看界面的組件?
教程
如何和springboot項目集成 【IT老齊153】超級實用!十分鐘掌握Prometheus與Grafana監控SpringBoot應用_嗶哩嗶哩_bilibili
- 其中用到了docker來引入Prometheus與Grafana,我直接跟著底下教程 本機安裝了,
- 學到了 springboot項目暴露監控指標的配置(配置文件放在最后)
如何監控windows【小速通】速通windows平臺部署prometheus+grafana監控自機_嗶哩嗶哩_bilibili
四分鐘的教程
安裝了個windows_exporter 可以讓普羅米修斯監聽windows的性能指標
配置文件
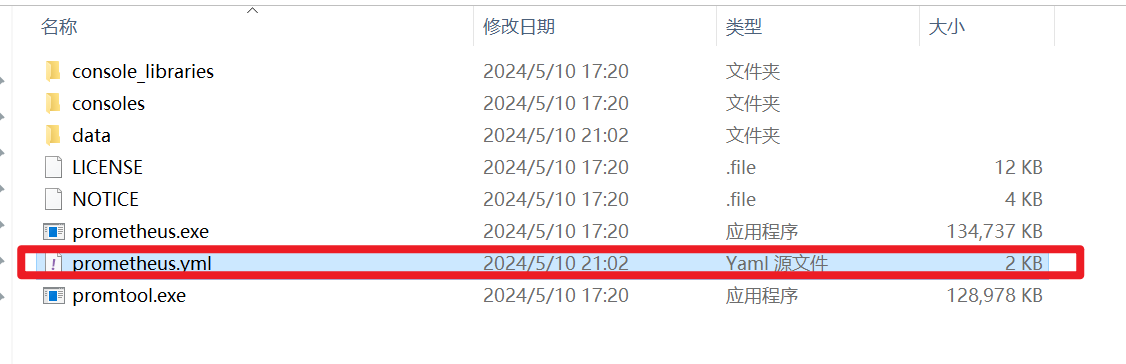
global:scrape_interval: 15s # Set the scrape interval to every 15 seconds. Default is every 1 minute.evaluation_interval: 15s # Evaluate rules every 15 seconds. The default is every 1 minute.alerting:alertmanagers:- static_configs:- targets:# - alertmanager:9093rule_files:# - "second_rules.yml"scrape_configs:- job_name: "prometheus"static_configs:- targets: ["localhost:9090"]#windows_exporter的配置- job_name: "windows_exporter"static_configs:- targets: ["localhost:9182"]#springboot項目的配置- job_name: "springboot_prometheus" scrape_interval: 5s metrics_path: '/actuator/prometheus' static_configs: - targets: ['localhost:81']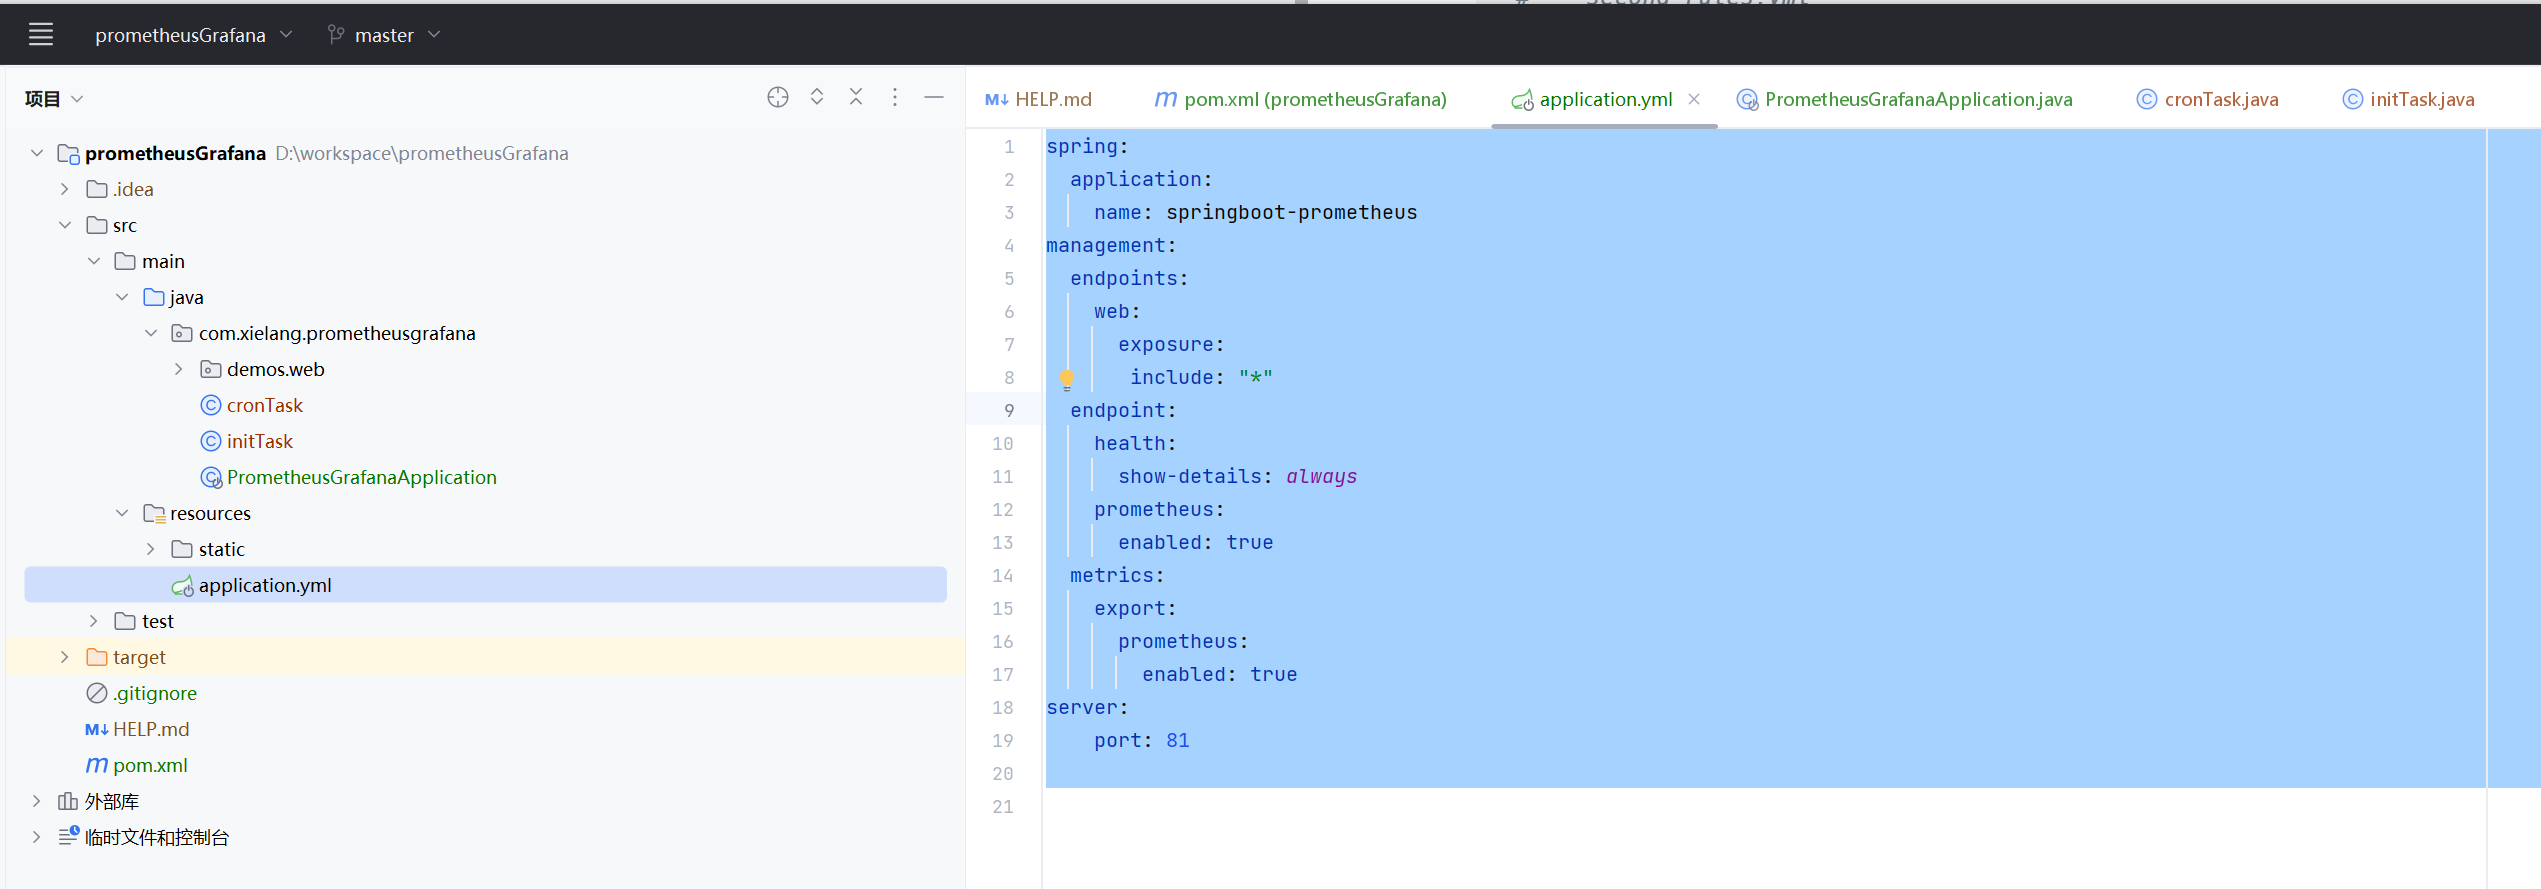
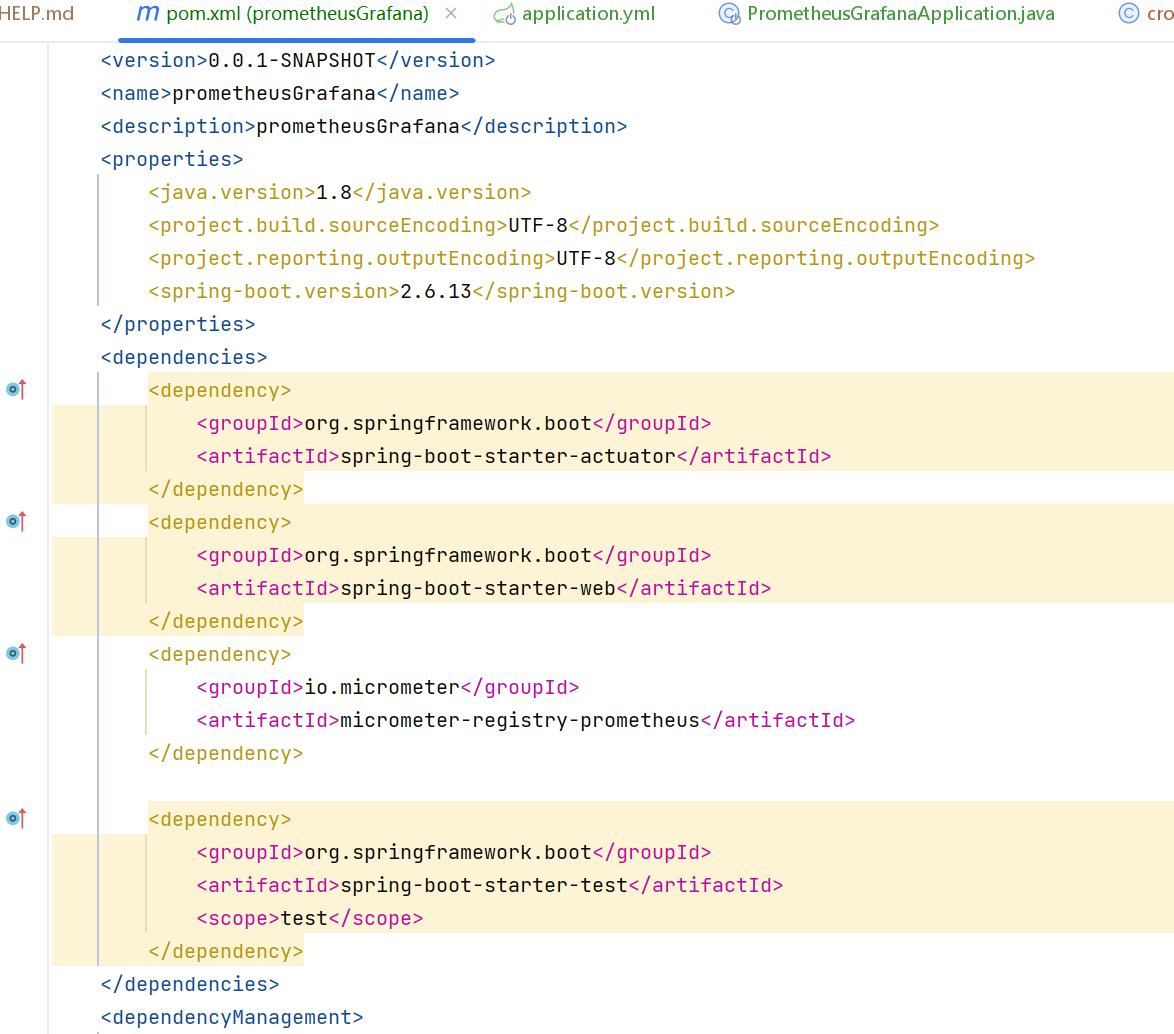
pom文件
#springboot yaml 配置
spring:application:name: springboot-prometheus
management:endpoints:web:exposure:include: "*"endpoint:health:show-details: alwaysprometheus:enabled: truemetrics:export:prometheus:enabled: true
server:port: 81
實操截圖
-
springboot項目 actuator本身可以暴露出來的指標
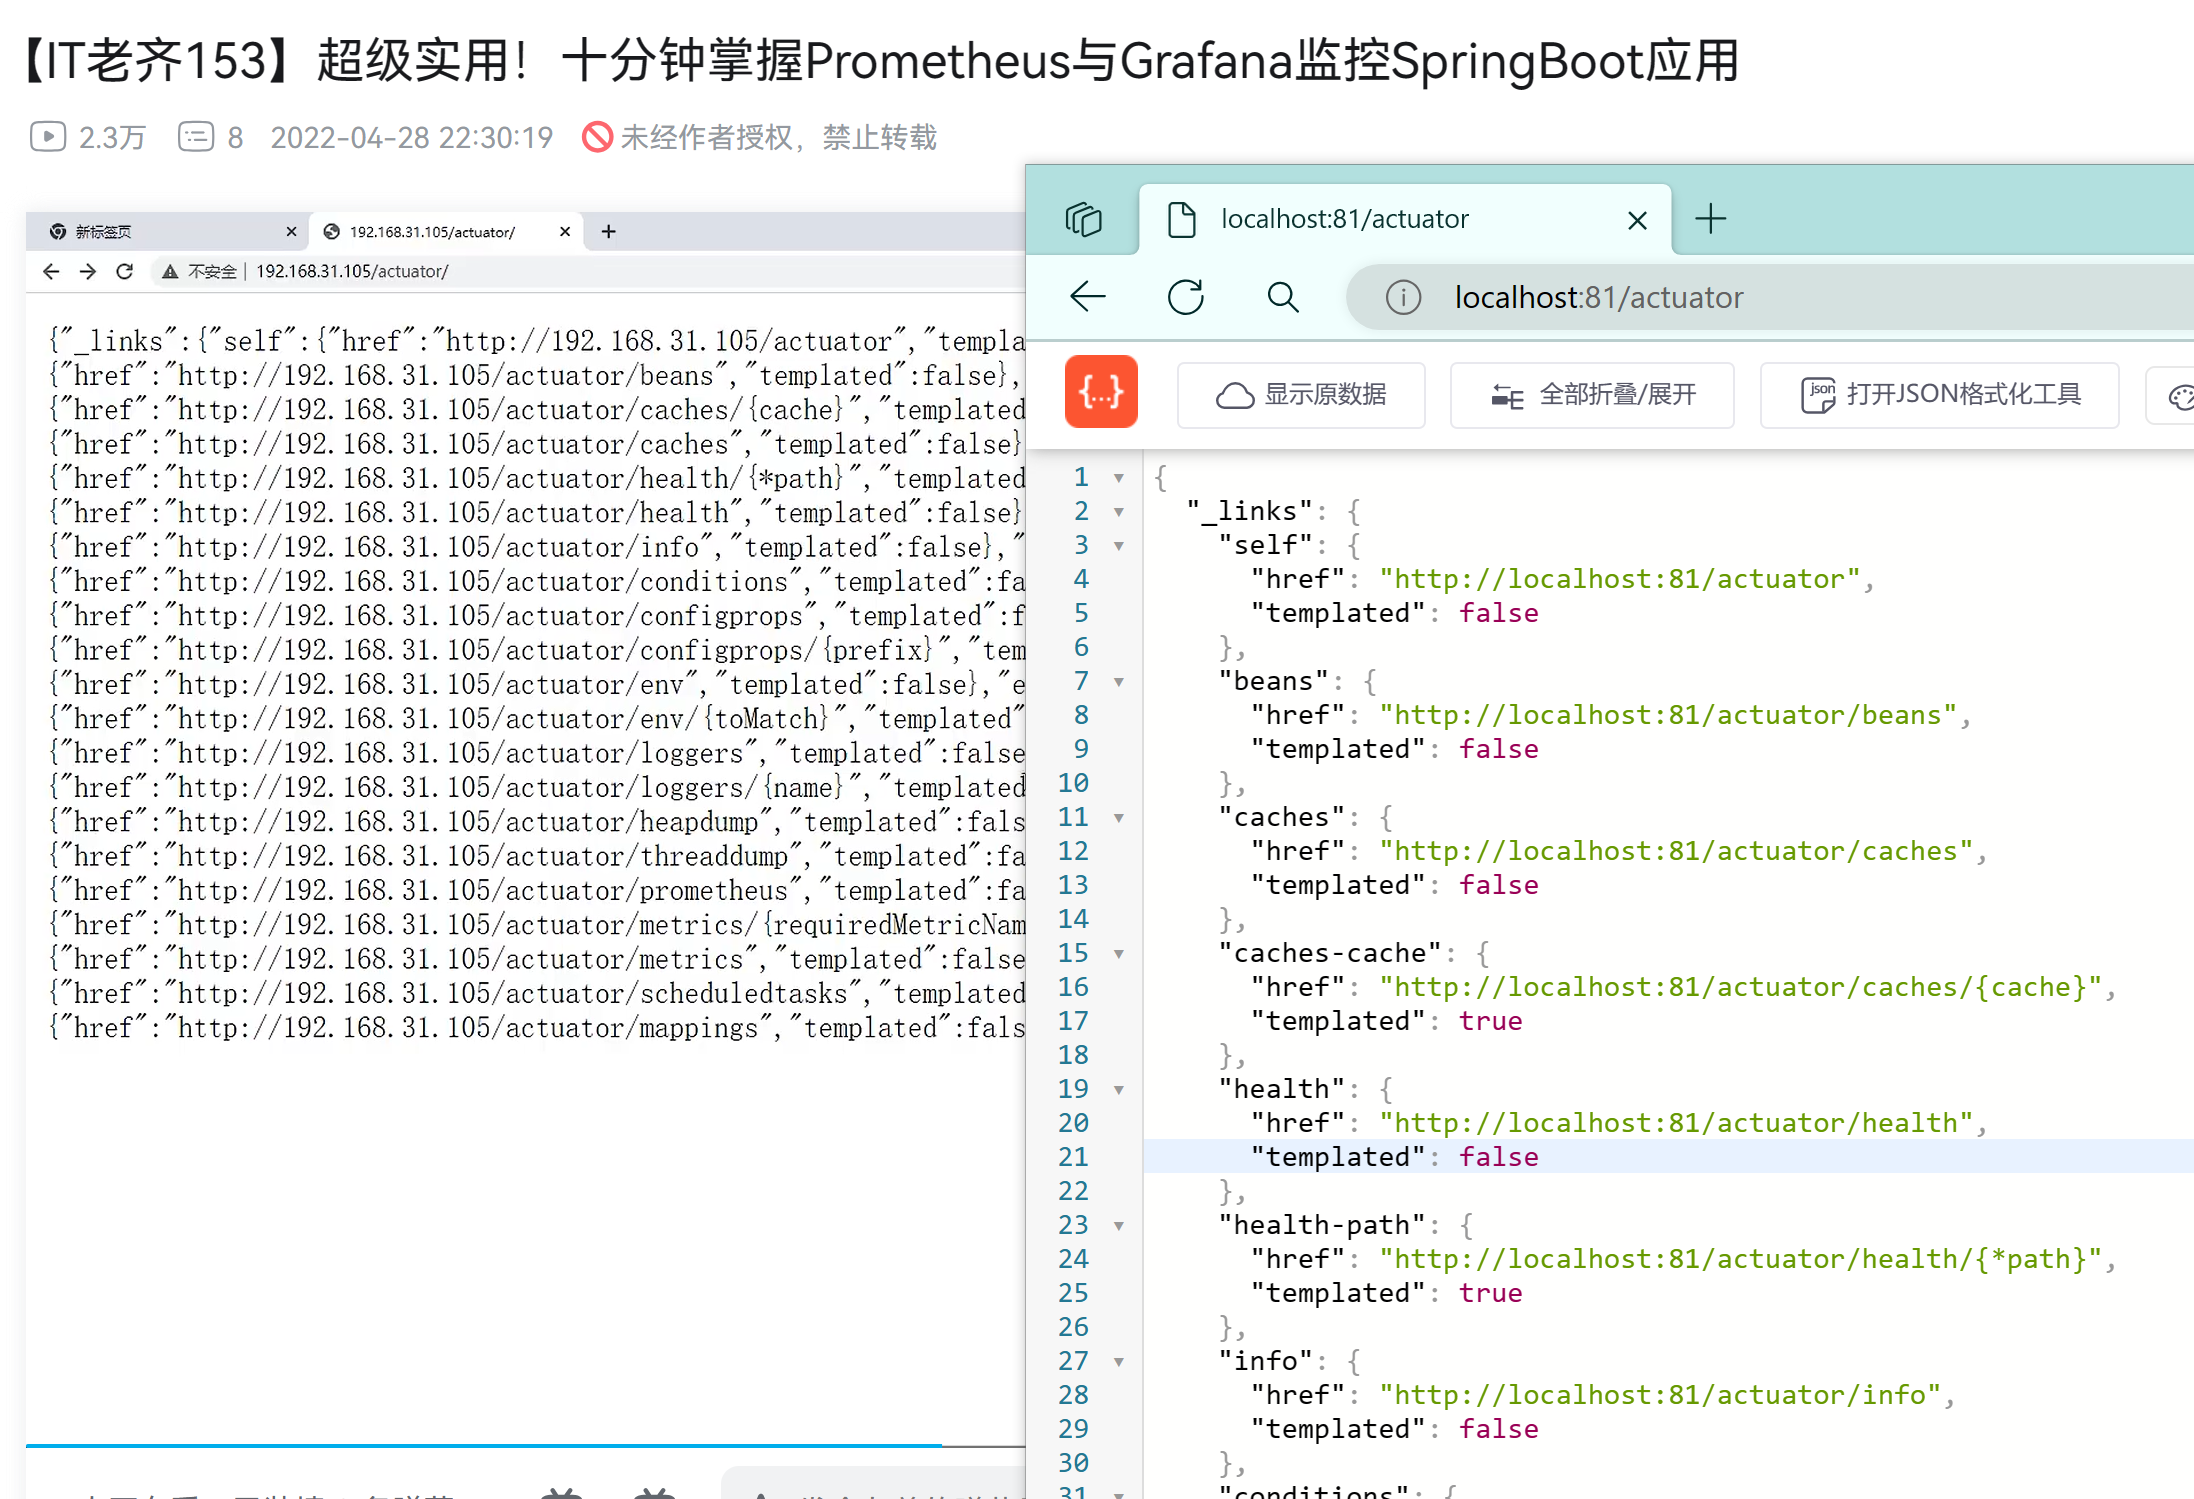
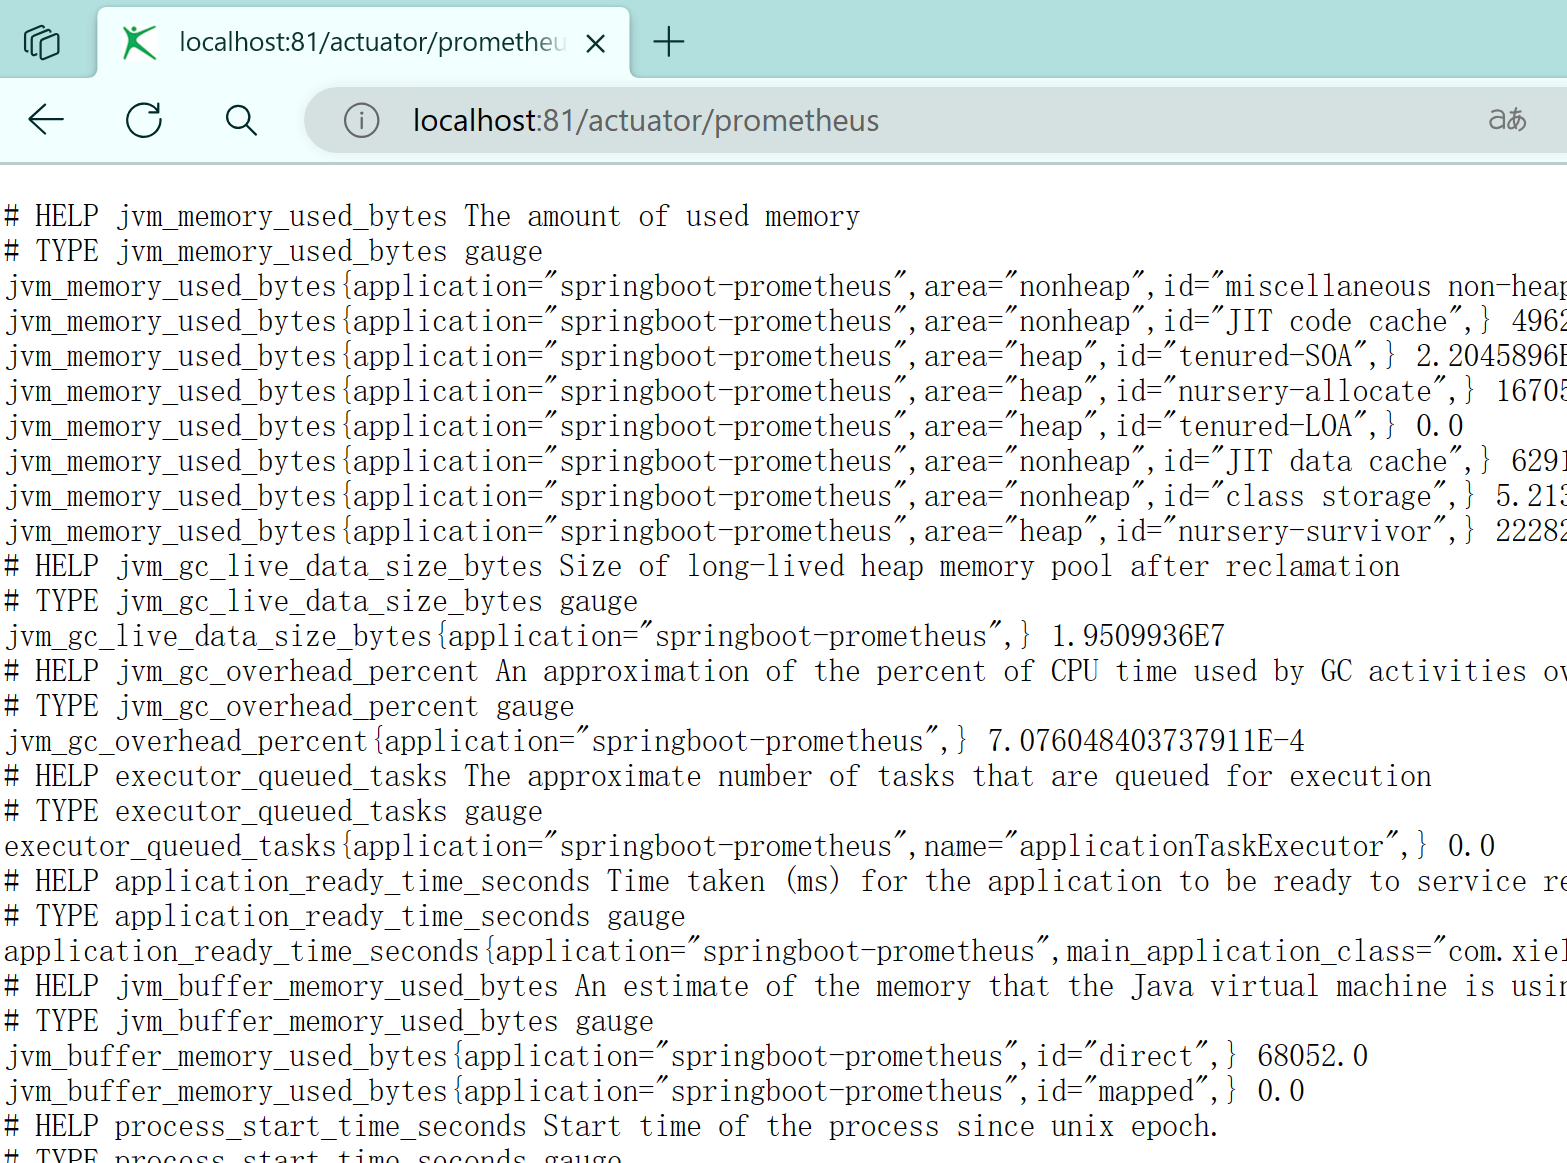
-
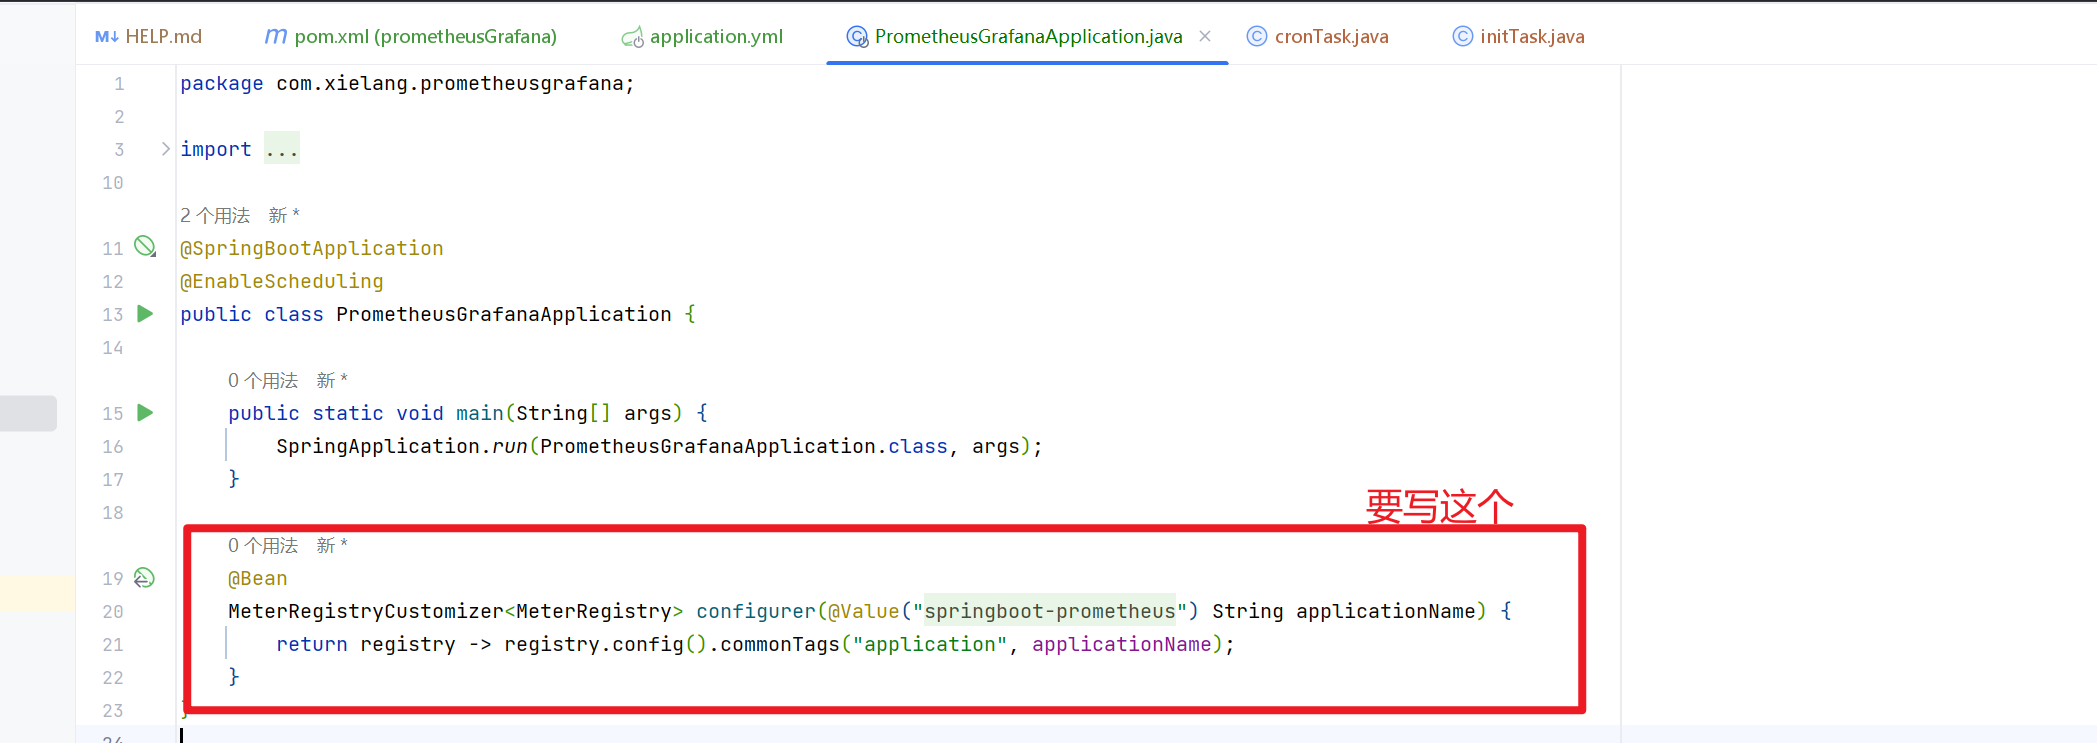
加了prometheus依賴后,可以更規范的返回
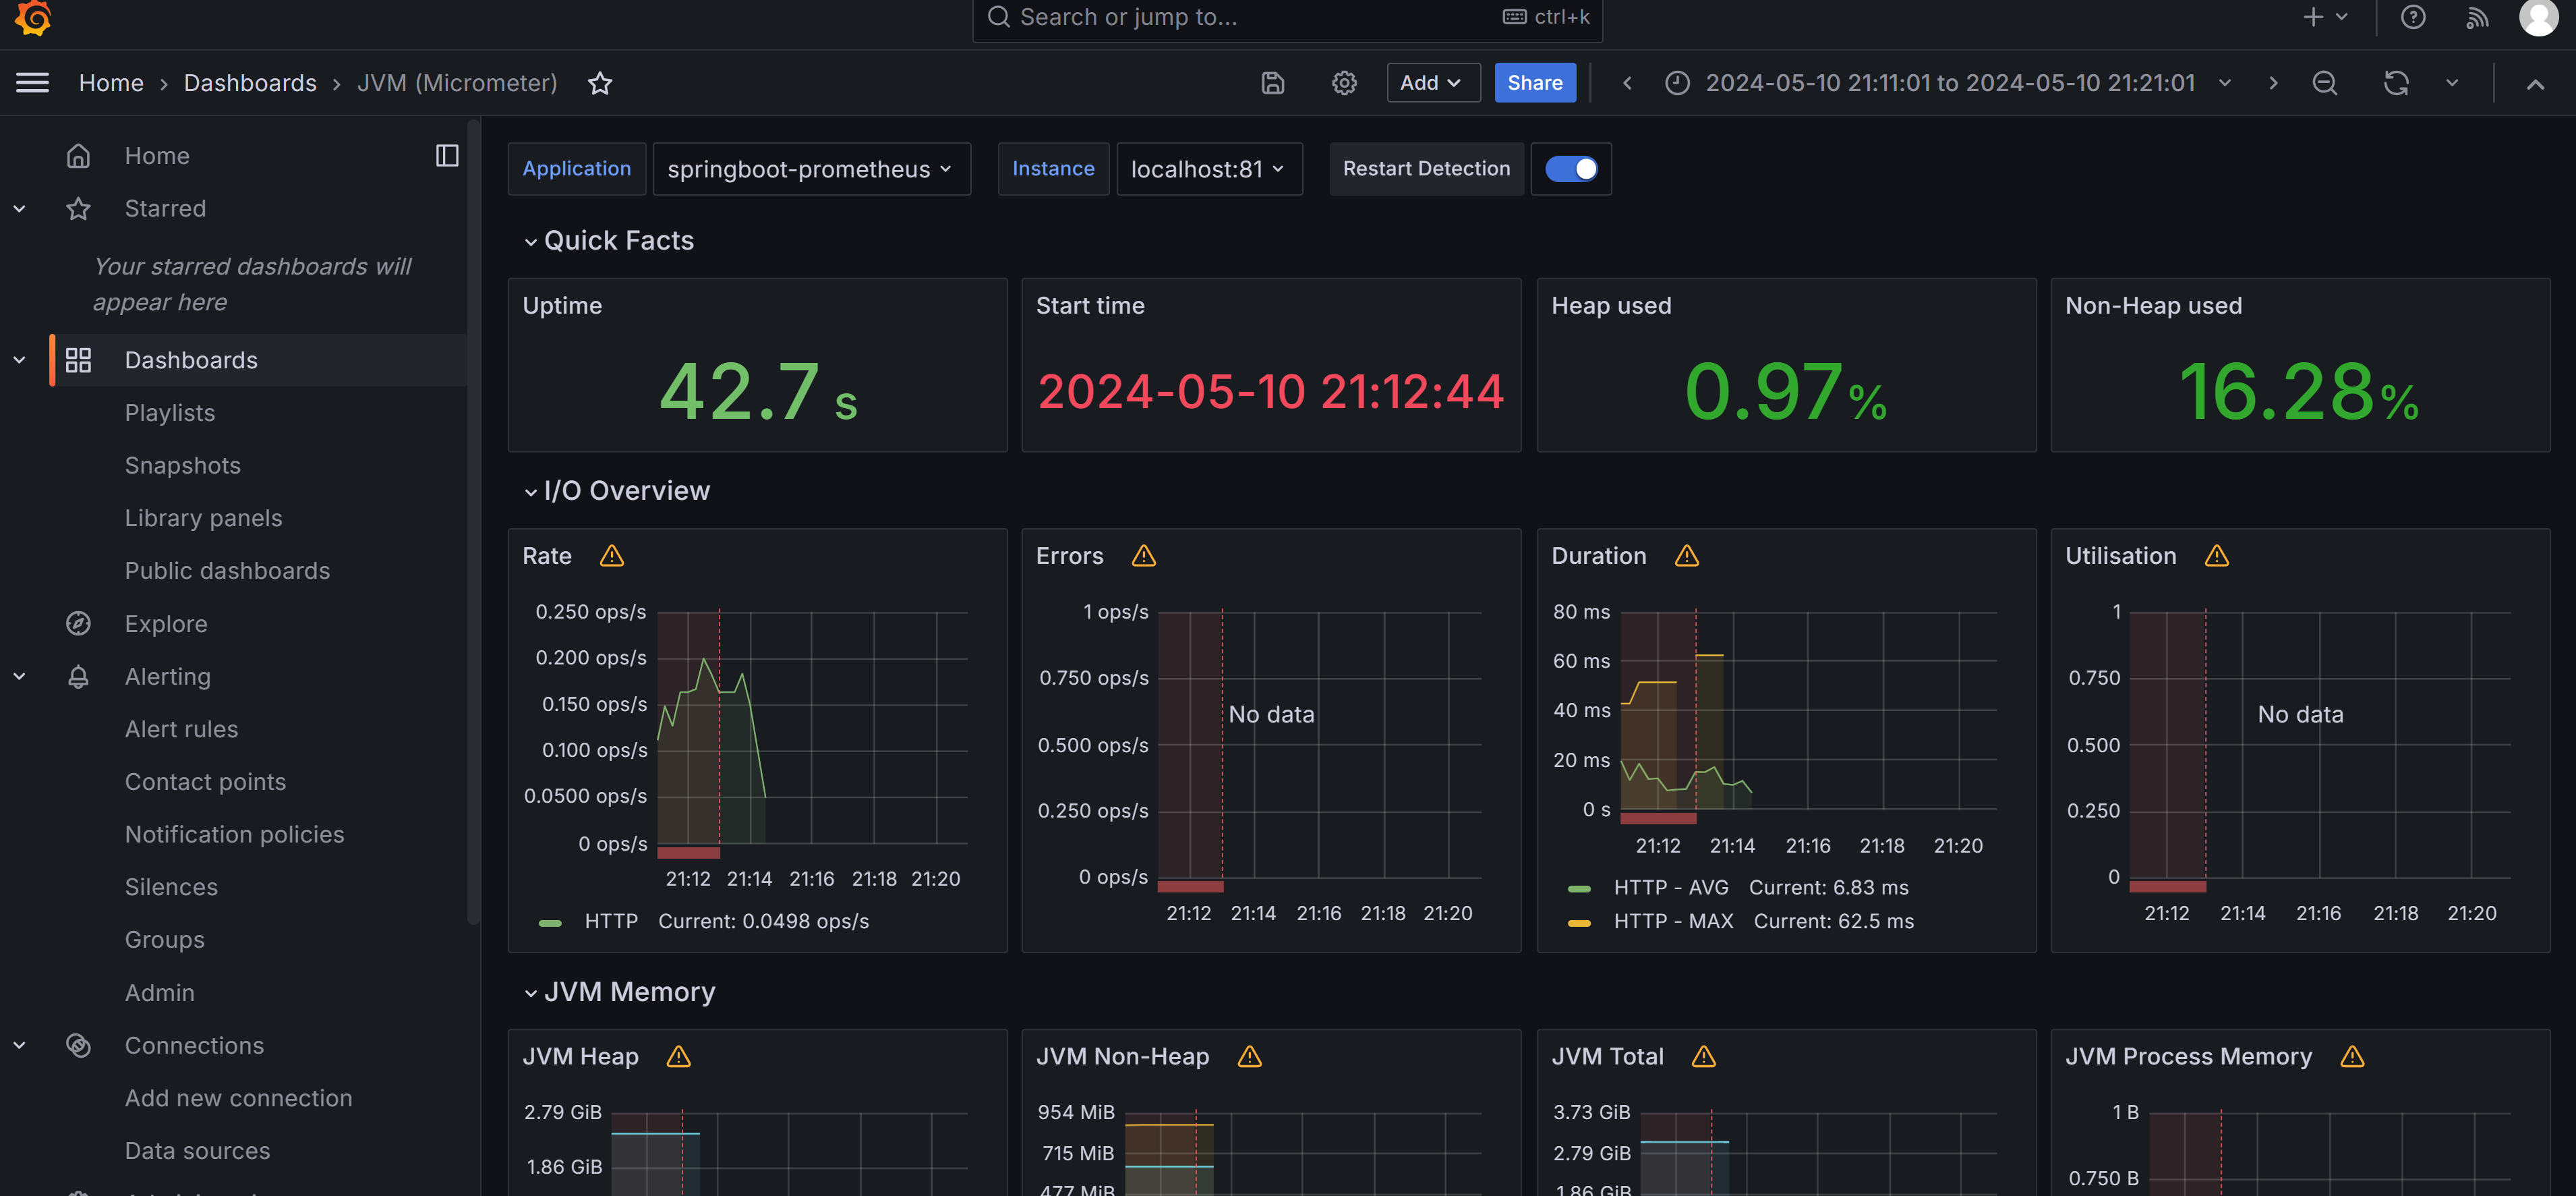
-
上述這個項目的監控界面(用的dashboard id是 4701)
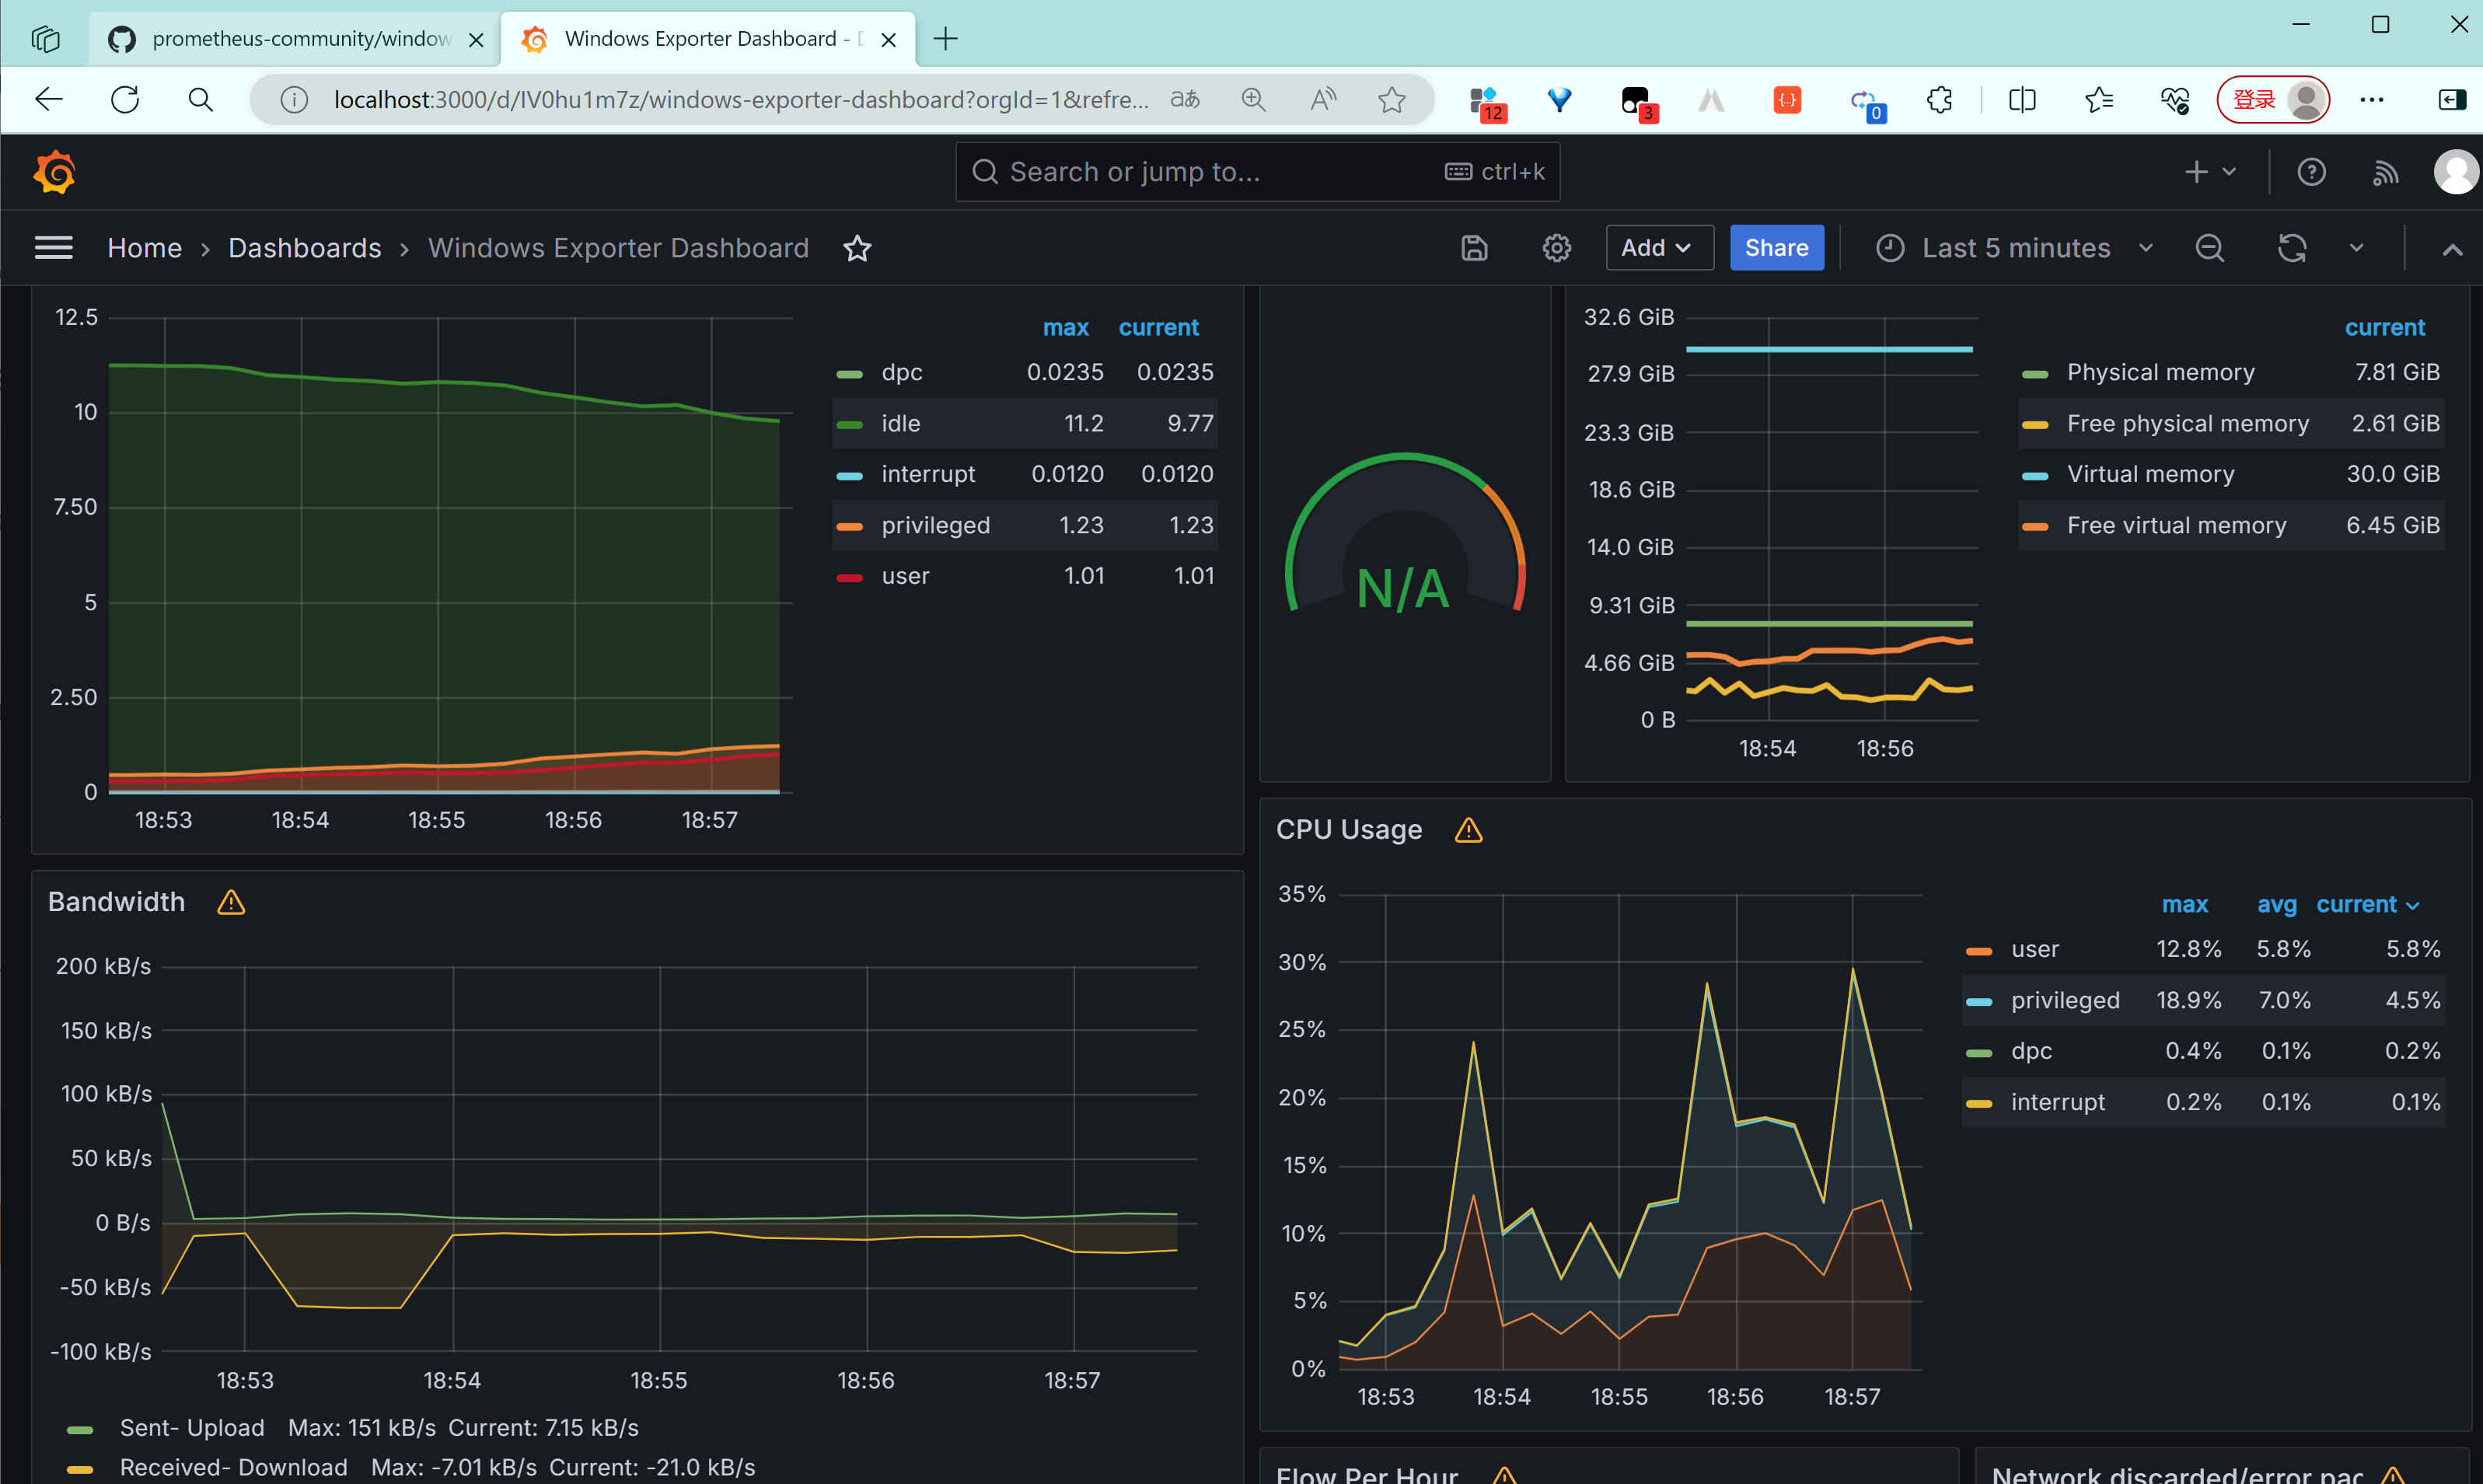
-
windows_exporter的監控界面(搜windows_exporter 第一個)
開源項目地址
aiwandianao/prometheusGrafanaTinySpringbootDemo: 最基礎的普羅米修斯和 Grafana 集成springboot 配置的項目,配有詳盡的教程 (github.com)

)


)


——Imagic)


