目錄
一、gdb/strace 跟蹤程序系統調用
二、實現原理
三、代碼實現
四、總結
(代碼:linux 6.3.1,架構:arm64)
One look is worth a thousand words. ?—— Tess Flanders
相關鏈接:
linux ptrace 圖文詳解(一)基礎介紹
linux ptrace 圖文詳解(二) PTRACE_TRACEME 跟蹤程序
linux ptrace 圖文詳解(三) PTRACE_ATTACH 跟蹤程序
linux ptrace 圖文詳解(四) gdb設置軟斷點
linux ptrace 圖文詳解(五) gdb設置硬斷點、觀察點
linux ptrace 圖文詳解(六) gdb單步調試
一、gdb/strace 跟蹤程序系統調用
? ? ? ? gdb、strace都能夠跟蹤被調試程序在執行過程中的所有系統調用,其底層依賴的就是ptrace(PTRACE_SYSCALL) 的能力。當使用 PTRACE_SYSCALL 時,被跟蹤的進程會在每次系統調用的開始或結束時被暫停掛起,并通知父進程(gdb、strace)。這使得開發者能夠詳細地監控和分析程序的系統調用行為,對于調試和性能分析非常有用。
? ? ? ? 下圖是strace跟蹤ls命令執行期間,用到的所有系統調用信息:

二、實現原理
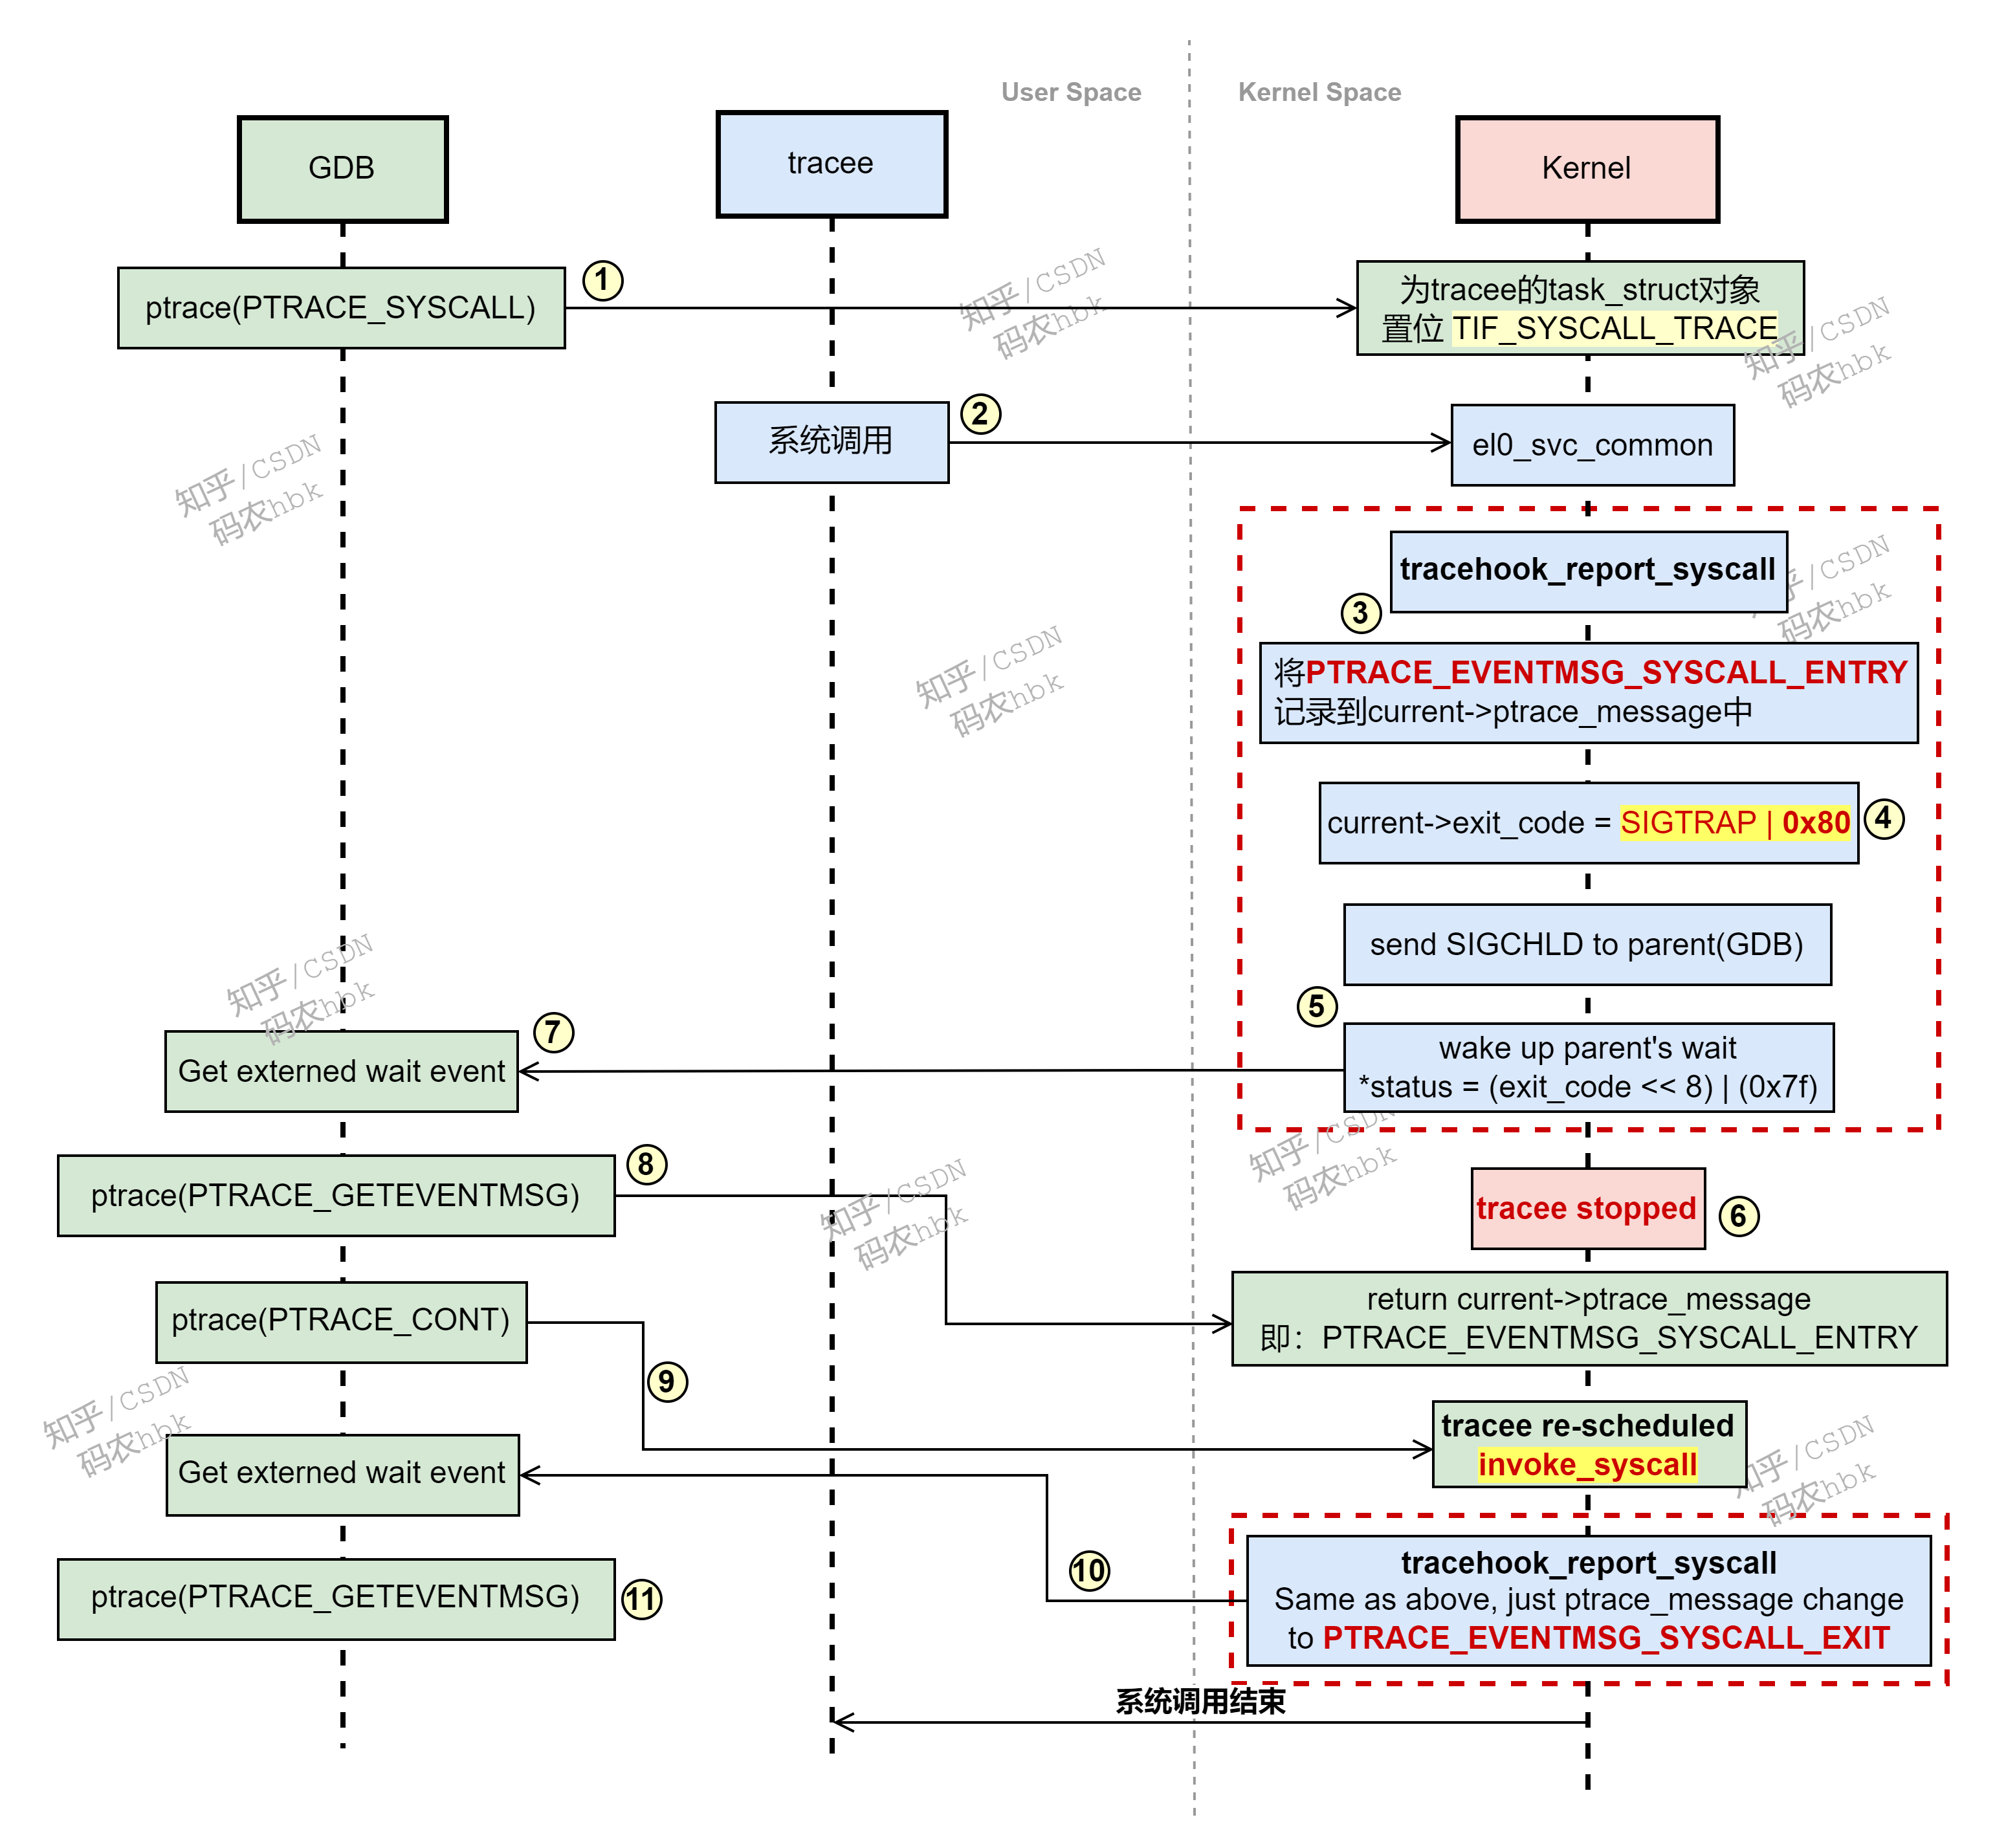
? ? ? ? 上圖是gdb跟蹤被調試程序執行過程中所有系統調用的原理:
? ? ? ? 1)gdb通過ptrace(PTRACE_SYSCALL),為被調試程序的task置位TIF_SYSCALL_TRACE,然后返回;
? ? ? ? 2)被調試程序執行系統調用陷入內核;
? ? ? ? 3)在系統調用的入口,調用tracehook_report_syscall,判斷當前task是否置位TIF_SYSCALL_TRACE;
? ? ? ? 4)若置位,則將PTRACE_EVENTMSG_SYSCALL_ENTRY記錄到被調試程序task的ptrace_message中;
? ? ? ? 5)隨后給父進程gdb發送SIGCHLD信號,并喚醒gdb的wait操作,同時設置父進程gdb wait操作的status值 ( (SIGTRAP | 0x80) << 8) | 0X70;其中,0x80代表被調試程序觸發了syscall!
? ? ? ? 6)被調試程序將自己掛起;
? ? ? ? 7)gdb被喚醒后,檢查wait的status返回值內容,發現置位了0x80,說明被調試程序執行了syscall;
? ? ? ? 8)gdb通過ptrace(PTRACE_GETEVENTMSG) 獲取被調試任務內核中的task->ptrace_message內容,來判斷當前被調試程序是剛進入syscall、還是已經執行完畢syscall;
? ? ? ? 9)gdb喚醒被調試程序繼續運行,被調試程序被調度運行后,調用invoke_syscall執行真正的系統調用任務;
? ? ? ? 10)當invoke_syscall執行完畢后,會再次調用tracehook_report_syscall,將自身掛起并通知gdb(這個流程與上述3~6步一致),唯一的區別是:此時設置到被調試任務task->ptrace_message中的字段是PTRACE_EVENTMSG_SYSCALL_EXIT;
? ? ? ? 11)gdb被喚醒后,判斷出被調試程序是因為syscall掛起的,通過ptrace(PTRACE_GETEVENTMSG)可以獲取到被調試程序執行完畢系統調用的信息;
是
三、代碼實現
1、gdb、strace 通過 ptrace(PTRACE_SYSCALL) 為被調試程序置位標志
ptrace_requestcase PTRACE_SYSCALL:return ptrace_resume(child, request, data) {if (request == PTRACE_SYSCALL)set_task_syscall_work(child, SYSCALL_TRACE) {set_ti_thread_flag(task_thread_info(t), TIF_SYSCALL_TRACE)}}2、被調試程序進入系統調用前夕,將自己暫停下來并通知gdb
el0t_64_sync_handler {el0_svcdo_el0_svcel0_svc_common {unsigned long flags = current_thread_info()->flagsif (has_syscall_work(flags)) {syscall_trace_enter {if (flags & (_TIF_SYSCALL_EMU | _TIF_SYSCALL_TRACE))tracehook_report_syscall(struct pt_regs *regs        = regs,enum ptrace_syscall_dir dir = PTRACE_SYSCALL_ENTER) {regno = (is_compat_task() ? 12 : 7)saved_reg = regs->regs[regno]regs->regs[regno] = dirif (dir == PTRACE_SYSCALL_ENTER) {tracehook_report_syscall_entry(regs){ptrace_report_syscall(regs, unsigned long message = PTRACE_EVENTMSG_SYSCALL_ENTRY) {
/* 保存syscall entry/exit event */			current->ptrace_message = message		// 保存 PTRACE_EVENTMSG_SYSCALL_ENTRY 到ptrace_message, 之后gdb會調用ptrace來獲取該信息
>>>>>>>>>>>>>>>>>>>>>>>>>>>>>>>>>>			ptrace_notify(int exit_code = SIGTRAP | 0x80) {ptrace_do_notify(int signr = SIGTRAP, int exit_code = exit_code, int why = CLD_TRAPPED) {ptrace_stop(exit_code, why, int clear_code = 1, &info) {	// 通知tracer, 并將自己掛起current->last_siginfo = infocurrent->exit_code = exit_codedo_notify_parent_cldstop(current, true, why = CLD_TRAPPED)info.si_signo  = SIGCHLDinfo.si_code   = why			// A.K.A: CLD_TRAPPEDinfo.si_status = tsk->exit_code & 0x7f__group_send_sig_info(SIGCHLD, &info, parent)send_signal(sig, info, p, PIDTYPE_TGID)__send_signal(sig, info, t, type, force)__wake_up_parentfreezable_schedulecurrent->last_siginfo = NULL	// after wake up by gdb, clear last_siginfo}}}if (current->exit_code) {send_sig(current->exit_code, current, 1)current->exit_code = 0}current->ptrace_message = 0return fatal_signal_pending(current)}//ptrace_report_syscall}//tracehook_report_syscall_entry}regs->regs[regno] = saved_reg}return regs->syscallno}//syscall_trace_enter}invoke_syscall...}
}
3、被調試程序系統調用執行完畢后,將自己暫停下來并通知gdb
el0t_64_sync_handler {el0_svcdo_el0_svcel0_svc_common {unsigned long flags = current_thread_info()->flagsif (has_syscall_work(flags)) {syscall_trace_enter}invoke_syscallsyscall_trace_exit {unsigned long flags = READ_ONCE(current_thread_info()->flags)if (flags & (_TIF_SYSCALL_TRACE | _TIF_SINGLESTEP))tracehook_report_syscall(regs, PTRACE_SYSCALL_EXIT) {tracehook_report_syscall_exit(regs, step = 0) {ptrace_report_syscall(regs, unsigned long message = PTRACE_EVENTMSG_SYSCALL_EXIT) {current->ptrace_message = messageptrace_notify(exit_code = SIGTRAP | 0x80)ptrace_do_notify(SIGTRAP, exit_code, why = CLD_TRAPPED) {kernel_siginfo_t infoinfo.si_signo = signrinfo.si_code  = exit_code  // A.K.A: SIGTRAP | 0x80ptrace_stop(exit_code, why, 1, &info) {current->last_siginfo = infocurrent->exit_code = exit_codedo_notify_parent_cldstop(current, true, why) {info.si_signo  = SIGCHLDinfo.si_code   = why			// A.K.A: CLD_TRAPPEDinfo.si_status = tsk->exit_code & 0x7f__group_send_sig_info(SIGCHLD, &info, parent)send_signal(sig, info, p, PIDTYPE_TGID)__send_signal(sig, info, t, type, force)}current->last_siginfo = NULL	// after wake up by gdb, clear last_siginfo}}//ptrace_do_notify}//ptrace_report_syscall}//tracehook_report_syscall_exit}//tracehook_report_syscall	}//syscall_trace_exit}//el0_svc_common
}
四、總結
? ? ? ? gdb、strace監控被調試程序的系統調用,主要是依賴系統調用的路徑上,根據被調試程序是否置位TIF_SYSCALL_TRACE,通過tracehook_report_syscall將自身暫停,并記錄相應的信息(PTRACE_EVENTMSG_SYSCALL_ENTRY、PTRACE_EVENTMSG_SYSCALL_EXIT)到current->ptrace_message中供后續gdb、strace通過ptrace(PTRACE_GETEVENTMSG)獲取,最后通知gdb。
)
)


: てあります。)


)