電腦端

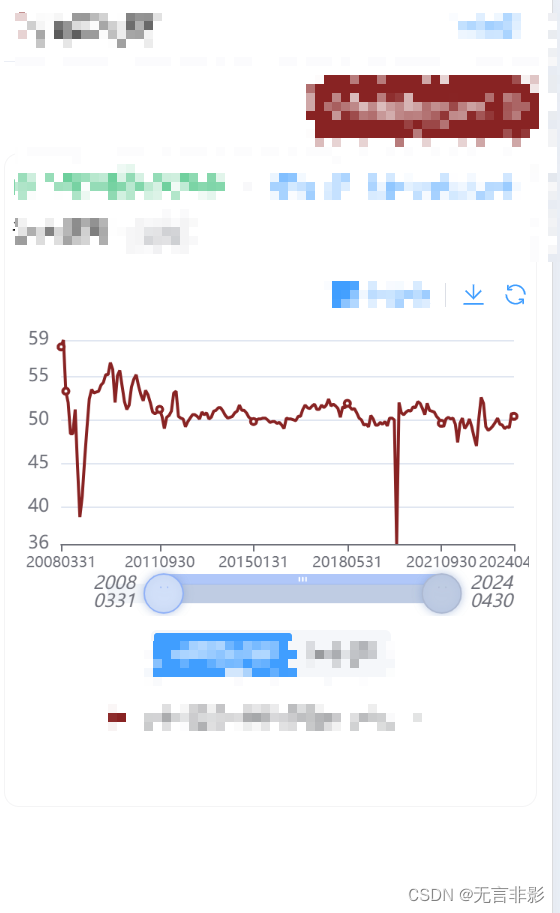
移動端
代碼片段
dataZoom: [{type: 'inside',start: 0,end: 100},{type: 'slider',backgroundColor: '#F2F5F9',fillerColor: '#BFCCE3',height: 13, // 設置slider的高度為15start: 0,end: 100,right: 60,left: 60,bottom: 15,handleIcon:'path://M30.9,53.2C16.8,53.2,5.3,41.7,5.3,27.6S16.8,2,30.9,2C45,2,56.4,13.5,56.4,27.6S45,53.2,30.9,53.2z M30.9,3.5M36.9,35.8h-1.3z M27.8,35.8 h-1.3H27L27.8,35.8L27.8,35.8z', // 使用類似 axisPointer 的圖標handleSize: '200%', // 放大按鈕borderColor: 'none',handleStyle: {color: '#BFCCE3',shadowBlur: 6,shadowColor: 'rgba(123, 154, 204, 0.5)',shadowOffsetX: 0, // 陰影偏移x軸多少shadowOffsetY: 0 // 陰影偏移y軸多少},// 顯示的label的格式化器// 20050101 變為 2005\n0101labelFormatter: function (index, value) {const year = value.slice(0, 4);const date = value.slice(4);return year + '\n' + date;},textStyle: {fontStyle: 'italic' // 設置字體傾斜},showDataShadow: false // 隱藏數據陰影}]
思路:
- showDataShadow: false // 隱藏數據陰影
是把數據預覽去掉 - 移動端不太方便,所以把按鈕進行了修改方便用戶拖拽。
handleIcon:'path://M30.9,53.2C16.8,53.2,5.3,41.7,5.3,27.6S16.8,2,30.9,2C45,2,56.4,13.5,56.4,27.6S45,53.2,30.9,53.2z M30.9,3.5M36.9,35.8h-1.3z M27.8,35.8 h-1.3H27L27.8,35.8L27.8,35.8z', // 使用類似 axisPointer 的圖標handleSize: '200%', // 放大按鈕borderColor: 'none',handleStyle: {color: '#BFCCE3',shadowBlur: 6,shadowColor: 'rgba(123, 154, 204, 0.5)',shadowOffsetX: 0, // 陰影偏移x軸多少shadowOffsetY: 0 // 陰影偏移y軸多少},
- 因為 日期格式是 YYYYMMDD, 手機上顯示太長了,這里做了換行處理。
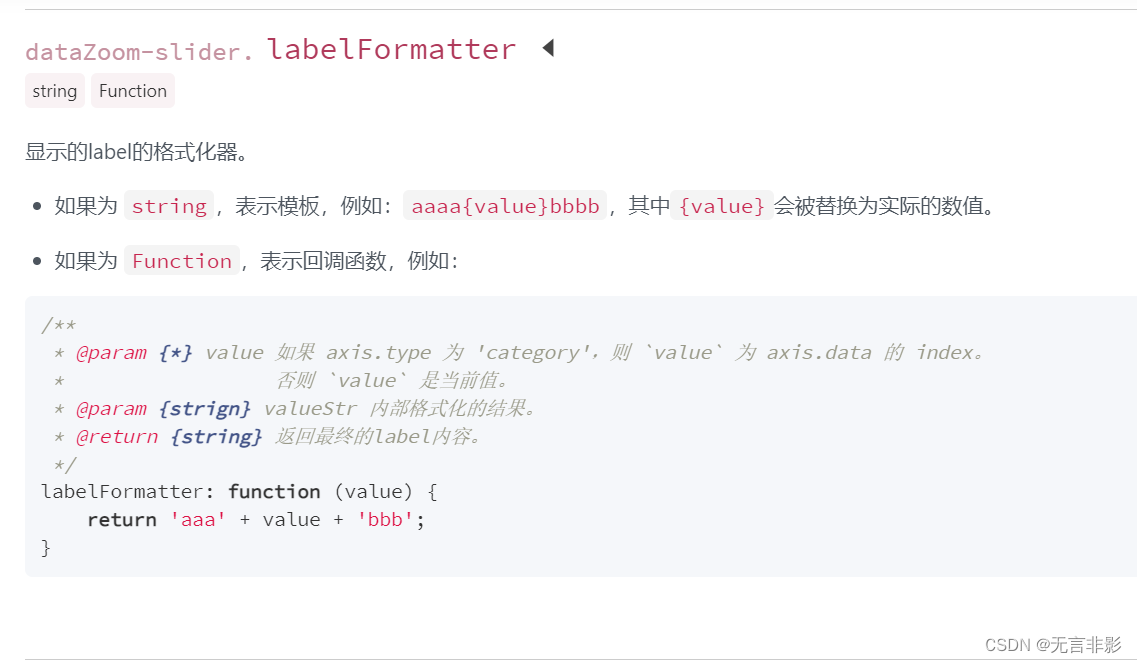
// 顯示的label的格式化器// 20050101 變為 2005\n0101labelFormatter: function (index, value) {const year = value.slice(0, 4);const date = value.slice(4);return year + '\n' + date;},
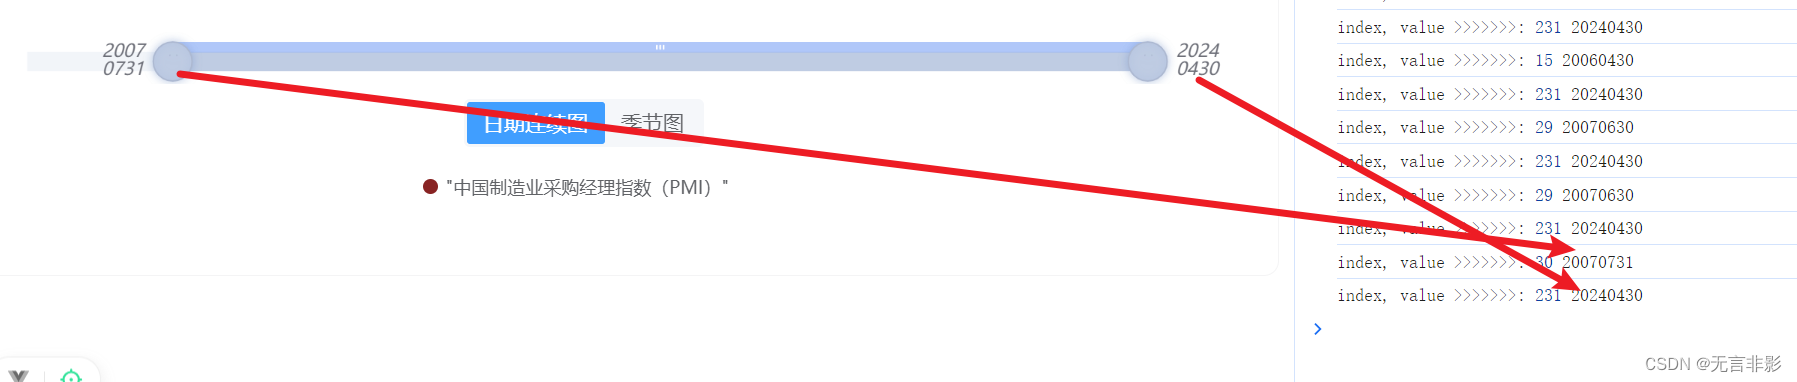
這里有個坑:labelFormatter
labelFormatter官網說,value在type 為 'category’的時候,是索引值。
但我實際看到的效果不是。
比如我有7000個數據點,每次拖拽的時候,索引index只有200多個,導致我獲取不到數據。
因為只想拖拽的時候,格式化顯示的label,第二個參數就是當時顯示的label,但是文檔里沒有標出來。
https://echarts.apache.org/zh/option.html#dataZoom-slider.labelFormatter


接入身份認證(3完結篇))


