調試Electron+js
調試Electron+js: https://www.electronjs.org/zh/docs/latest/tutorial/debugging-vscode
調試Electron+ts
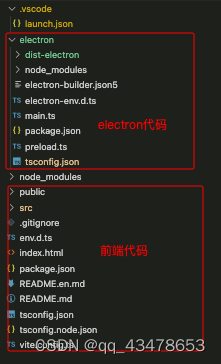
首先看一下,我的目錄結構。目錄結構決定了launch.json中的路徑部分。我將在項目根目錄下進行調試,項目根目錄下包含electron代碼部分,和src等前端代碼部分。
1.創建.vscode,創建launch.json。調試Electron+ts代碼部分。
{"version": "0.2.0","configurations": [{"type": "node","request": "launch","name": "Main","runtimeExecutable": "${workspaceRoot}/electron/node_modules/.bin/electron",	// 我的electron外部庫放在./electron/node_modules下面。如果你的放在./根目錄下,改成'${workspaceRoot}/node_modules/.bin/electron'"runtimeArgs": ["./electron",	// 這里也是,我的electron的入口文件main.ts放在./electron目錄下。如果你的在根目錄./,改成'.'// this args for attaching render process"--remote-debugging-port=9222"],"windows": {"runtimeExecutable": "${workspaceRoot}/electron/node_modules/.bin/electron.cmd"},"protocol": "legacy"}]
}
2.設置如下tsconfig.json(重要,且我的tsconfig.json在./electron/目錄下)
{"compilerOptions": {"module": "commonjs","target": "es2015","noImplicitAny": false,"sourceMap": true,	// 經過試驗,這個一定要開啟"moduleResolution": "node","lib": ["es2016", "dom"],"baseUrl": "."}
}
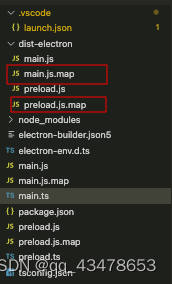
3.經過以上配置后,如下的的main.ts文件,經過ts編譯后(cd electron && tsc --module commonjs),ts將被編譯到./electron/dist-electron中。查看dist-electron中,是否有.sourcemap后綴的文件,如果有應該就沒有問題了。ts中打個斷點,試一下。
import { app, BrowserWindow } from 'electron/main'
import path from 'node:path'// 🚧 Use ['ENV_NAME'] avoid vite:define plugin - Vite@2.x
const VITE_DEV_SERVER_URL = 'http://localhost:8080/'const createWindow = () => {const win = new BrowserWindow({width: 800,height: 600,webPreferences: {preload: path.join(__dirname, 'preload.js')}})if (!app.isPackaged) {win.loadURL('https://www.baidu.com')} else {win.loadFile(path.resolve(__dirname, '../dist-vite/index.html'))}
}app.whenReady().then(() => {createWindow()app.on('activate', () => {if (BrowserWindow.getAllWindows().length === 0) {createWindow()}})
})app.on('window-all-closed', () => {if (process.platform !== 'darwin') {app.quit()}
})
如何調試渲染進程
1.更改launch.json為如下內容。
{"version": "0.2.0","configurations": [{"type": "node","request": "launch","name": "Main","runtimeExecutable": "${workspaceRoot}/electron/node_modules/.bin/electron","runtimeArgs": ["./electron",// this args for attaching render process"--remote-debugging-port=9222"],"windows": {"runtimeExecutable": "${workspaceRoot}/electron/node_modules/.bin/electron.cmd"},"protocol": "legacy"},{"type": "chrome","request": "attach","name": "Renderer","port": 9222,"webRoot": "${workspaceRoot}"	// Renderer 配置中的 webRoot 參數直接使用了 ${workspaceFolder},是因為在這個工程中,HTML 引用的靜態資源位于根目錄下。}],"compounds": [	// configurations 中的兩項分別對應主進程和渲染進程。compounds 中指定了一個組合會話 All,選擇 All 將會同時啟動這兩個會話。{"name": "All","configurations": ["Main", "Renderer"]}]
}
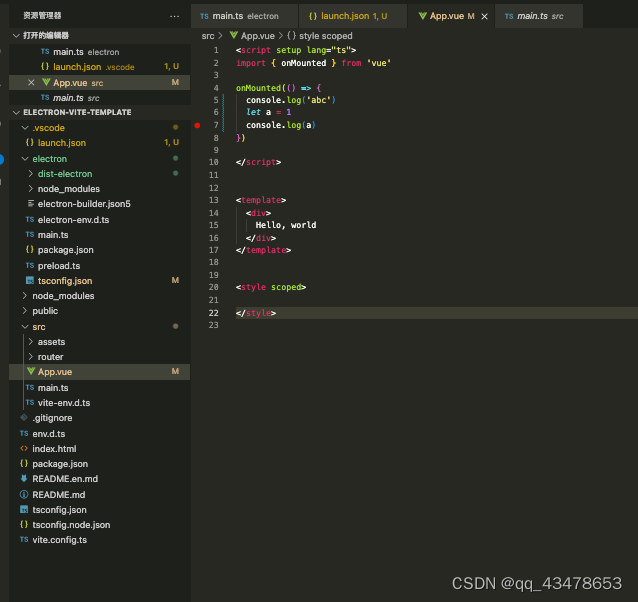
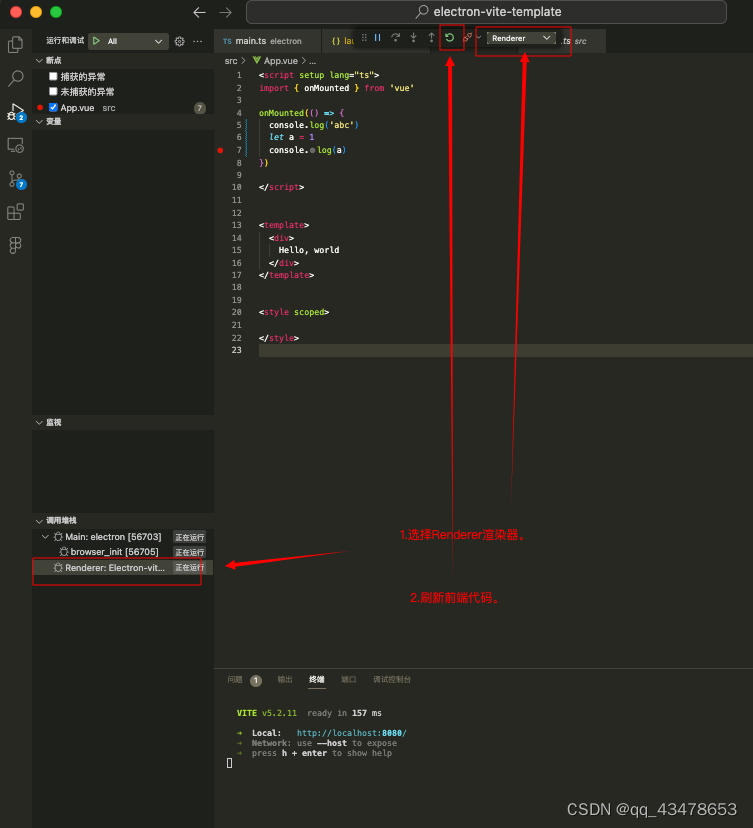
2.在渲染進程中打一個斷點。
3.啟動前端調試服務器。根目錄下直接啟動Vite服務器(重要,不然前端代碼無法執行到斷點)。
npm run dev
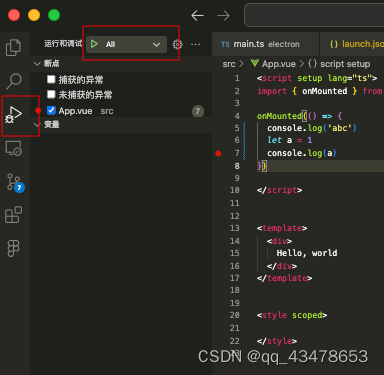
4.新建一個cmd,選擇debug標簽頁下的All,再按F5,啟動兩個調試器。
5.這個時候,前段代碼中的斷點可能沒法打到(因為服務器已經啟動了,已經過了斷點的執行點了)。此時,刷新前段代碼,就可以執行到了。
完整代碼參考
Electron-vite-template
參考
VS Code debug specs - Electron Java Script & Type Script
Electron 應用調試指南

:Pandas餐飲信息表分析——交叉表、離群點分析,多維分析等高級操作)


)
】)


)

 | 應用程序入口并不是main)


![[240514] OpenAI 發布 GPT-4o,人機交互的歷史性時刻 | 蘋果芯片進軍服務器劍指AI? | 谷歌大會以AI為主](http://pic.xiahunao.cn/[240514] OpenAI 發布 GPT-4o,人機交互的歷史性時刻 | 蘋果芯片進軍服務器劍指AI? | 谷歌大會以AI為主)


