目錄
五、添加被監控端
1、在web1[192.168.88.100]上部署node exporter
2、在Prometheus服務器上添加監控節點
3、瀏覽器查看添加結果
六、Grafana的部署
概述
部署步驟
七、監控MySQL數據庫
1、配置MySQL
2、配置mysql exporter
3、配置prometheus監控mysql
五、添加被監控端
監控方式:
????Prometheus客戶端分為pull和push兩種提交數據的方式
????Pull——服務端主動向客戶端拉取數據,客戶端要安裝導出器exporters作為守護進程
Push——客戶端安裝pushgateway插件,然后運維人員用腳本把監控數據組織成鍵值形式提交給pushgateway,再由它提交給服務端
node-exporter用于監控硬件和系統的常用指標
exporter運行于被監控端,以服務的形式存在。每個exporter所使用的端口號都不一樣。
服務名:node_exporter
服務端口:9100
1、在web1[192.168.88.100]上部署node exporter
# 拷貝node_exporter到web1
[root@prometheus ~]# scp prometheus_soft/node_exporter-1.5.0.linux-amd64.tar.gz 192.168.88.100:/root/
# 解壓即部署
[root@web1 ~]# tar xf node_exporter-1.5.0.linux-amd64.tar.gz
[root@web1 ~]# mv node_exporter-1.5.0.linux-amd64 /usr/local/node_exporter
#創建服務文件,并啟動服務
[root@web1 ~]# vim /usr/lib/systemd/system/node_exporter.service
[Unit]
Description=node_exporter
After=network.target
[Service]
Type=simple
ExecStart=/usr/local/node_exporter/node_exporter
[Install]
WantedBy=multi-user.target
[root@web1 ~]# systemctl daemon-reload
[root@web1 ~]# systemctl enable node_exporter.service --now
[root@web1 ~]# ss -tlnp | grep :9100
LISTEN 0 ? ? ?128 ? ? ? ? ? ? ? ?*:9100 ? ? ? ? ? ? *:* ? ?users:(("node_exporter",pid=7371,fd=3)) ?
2、在Prometheus服務器上添加監控節點
#修改配置文件,追加以下內容。特別注意縮進
[root@prometheus ~]# vim /usr/local/prometheus/prometheus.yml
...略...
??- job_name: "web1"
?? ?static_configs:
?? ? ?- targets: ["192.168.88.100:9100"]
?? ? ?
#重啟服務
[root@prometheus ~]# systemctl restart prometheus.service
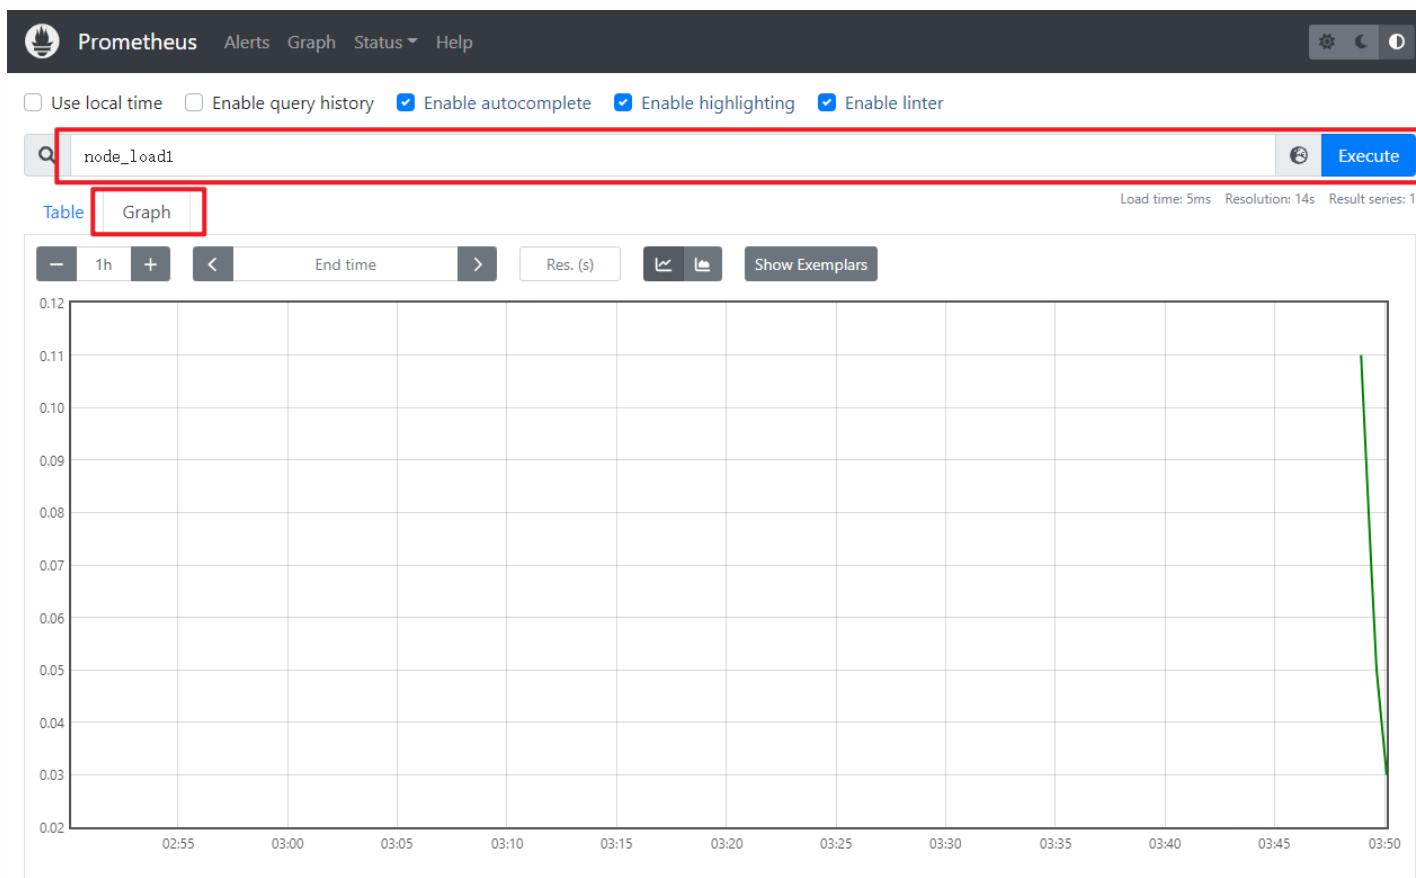
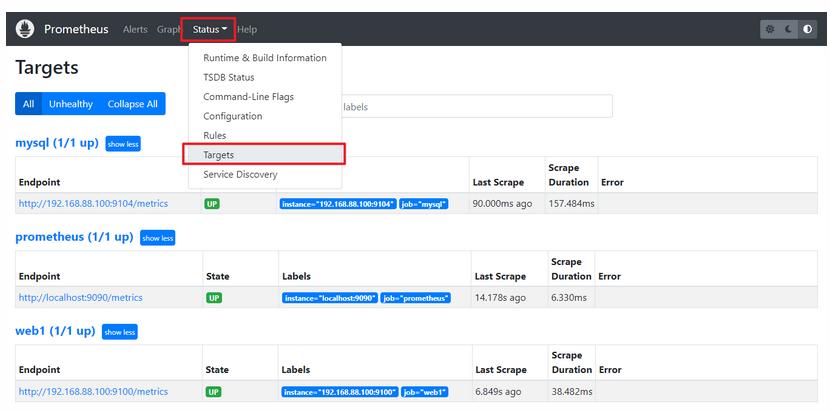
3、瀏覽器查看添加結果
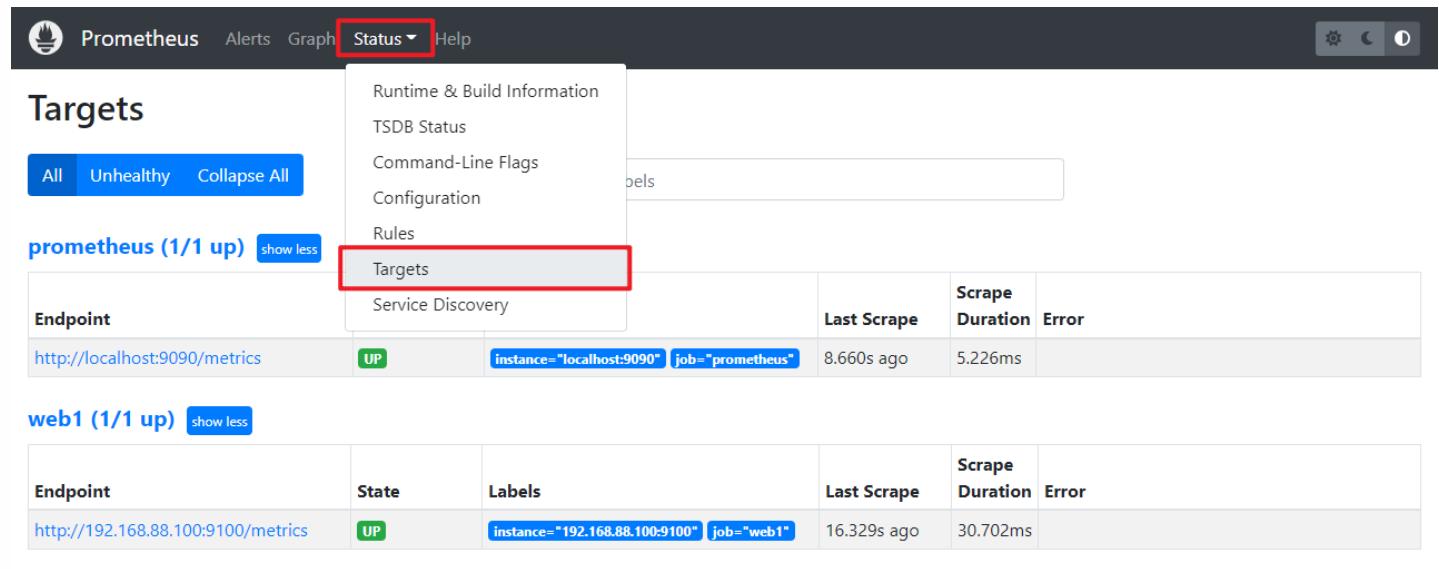
六、Grafana的部署
概述
Grafana是一個跨平臺的開源的度量分析和可視化工具,通過將采集的數據查詢然后可視化的展示
展示方式: 快速靈活的客戶端圖表,面板插件有熱圖、折線圖、圖表等
數據源:Graphite,InfluxDB,OpenTSDB、Prometheus、Elasticsearch、CloudWatch、KairosDB等
服務名:grafana-server
服務端口:3000
部署步驟
1、裝包、啟服務
[root@prometheus ~]# yum install -y prometheus_soft/grafana-enterprise-9.3.2-1.x86_64.rpm
[root@prometheus ~]# systemctl enable grafana-server.service --now
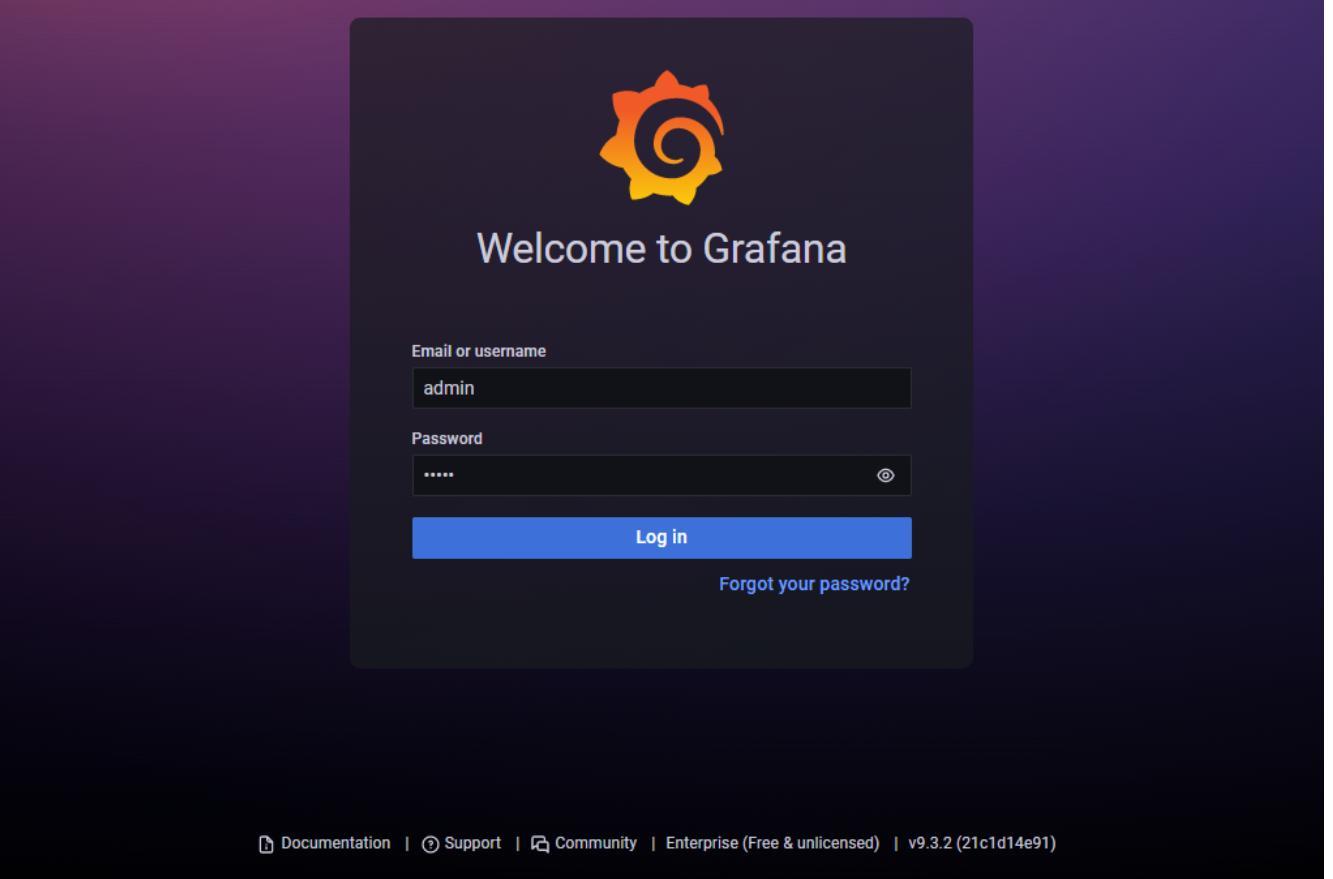
2、登錄grafana
訪問http://192.168.88.5:3000。初始用戶名和密碼都是admin。第一次登陸時,要求改密碼,本例中密碼改為tedu.cn。如果登陸報錯,請更換其他瀏覽器。
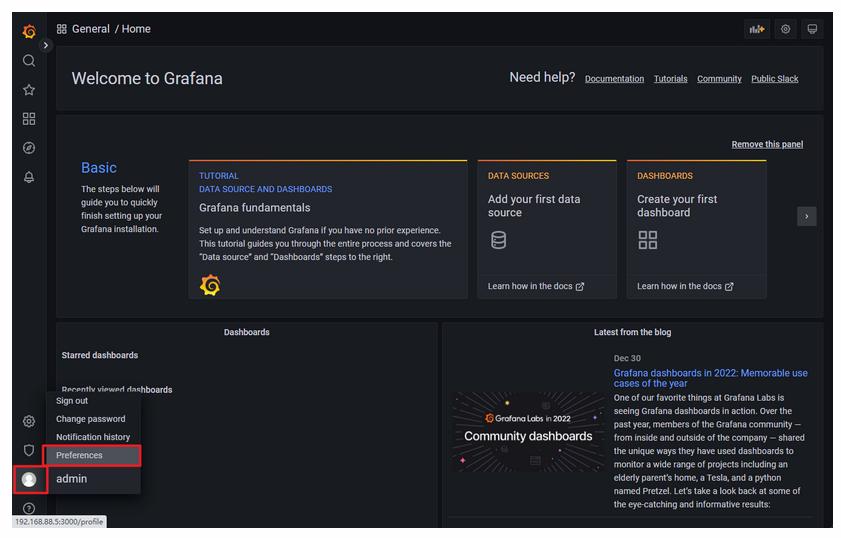
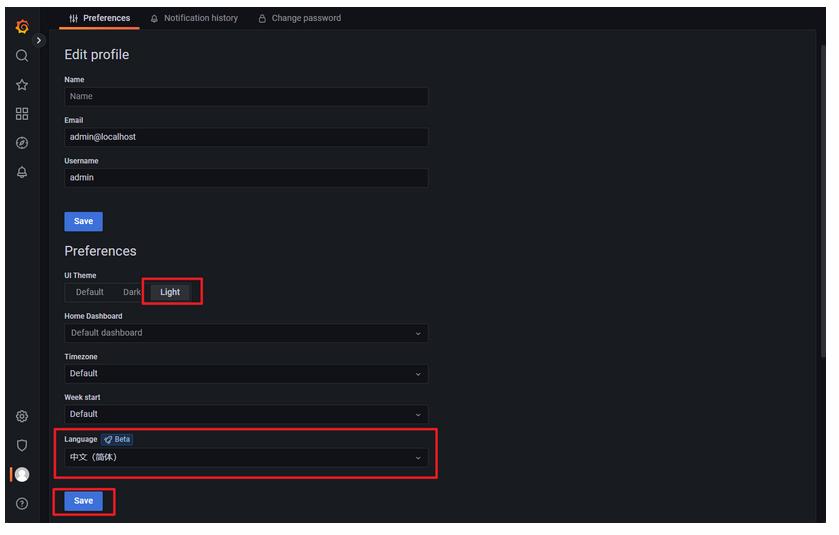
修改主題
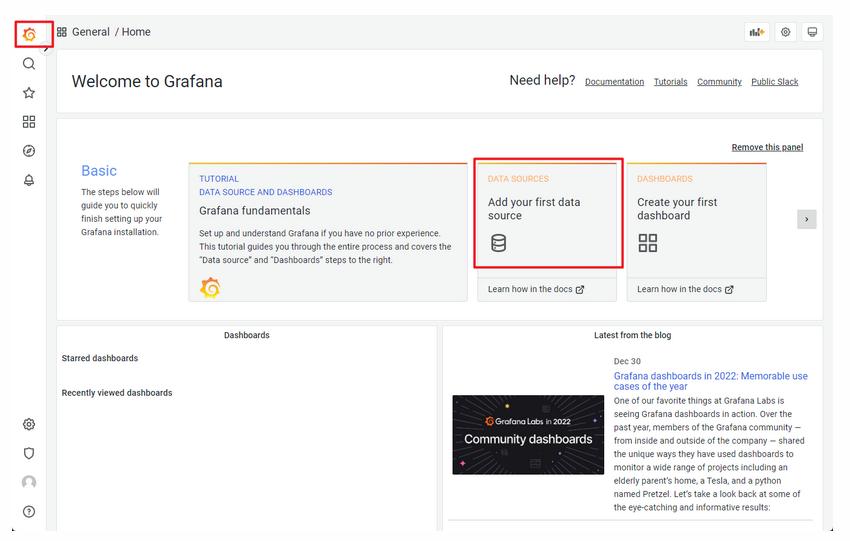
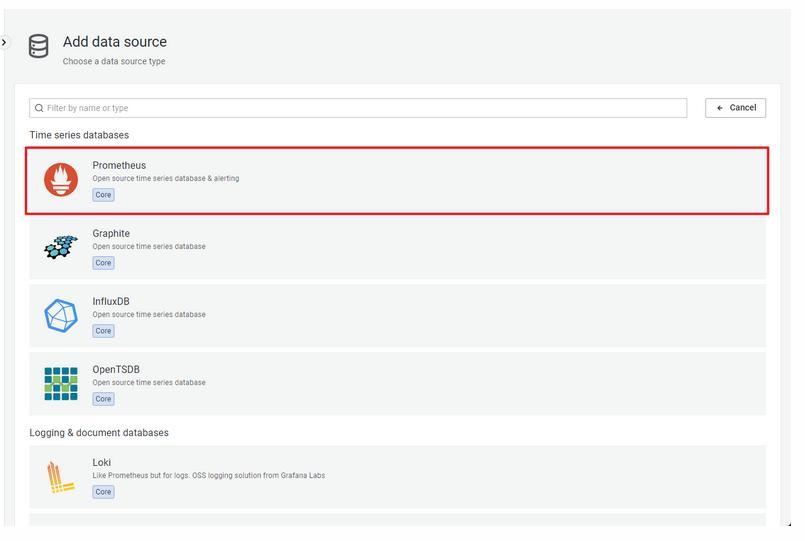
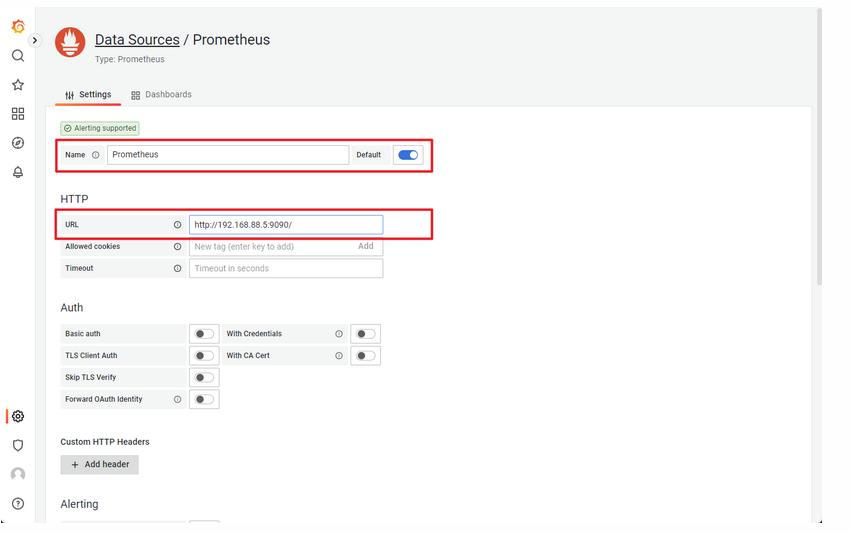
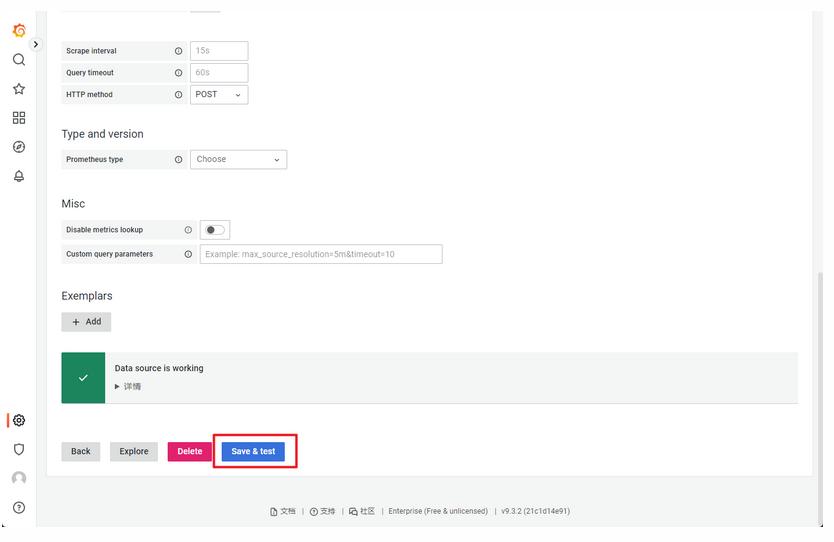
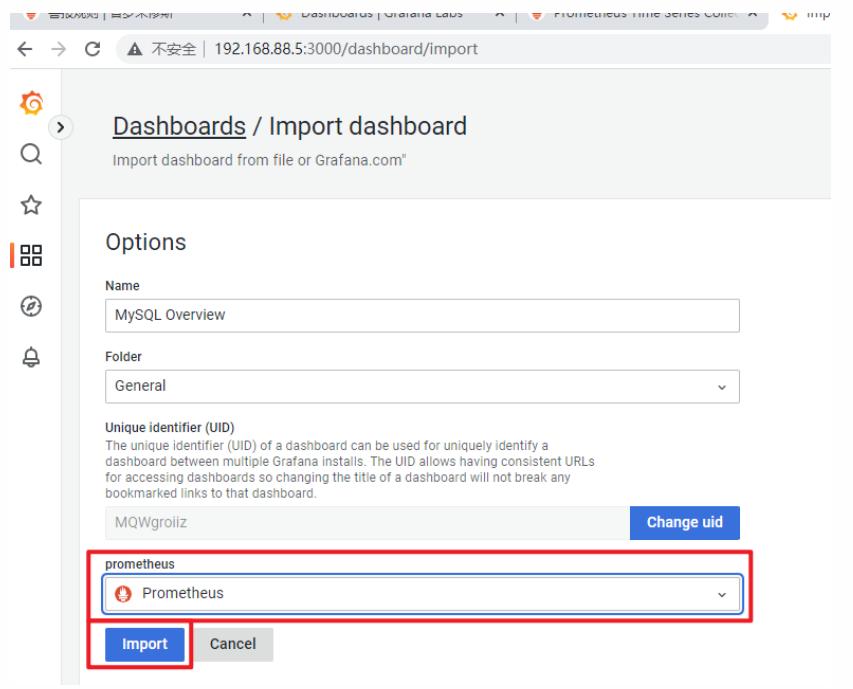
對接Prometheus
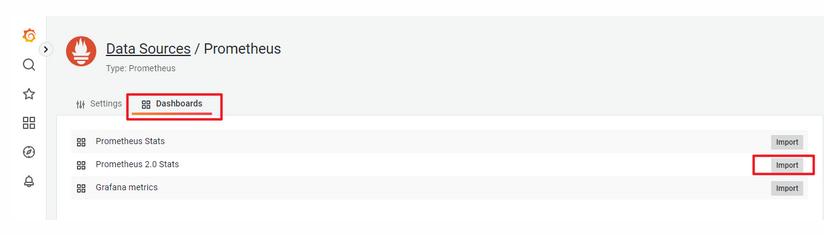
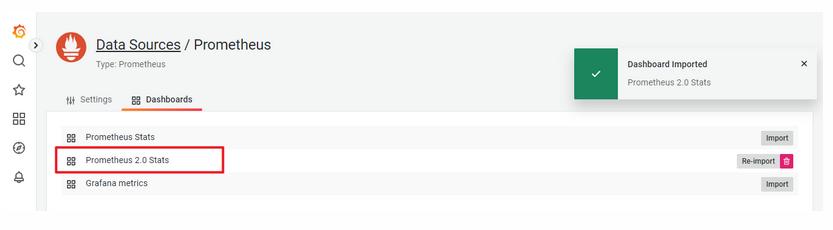
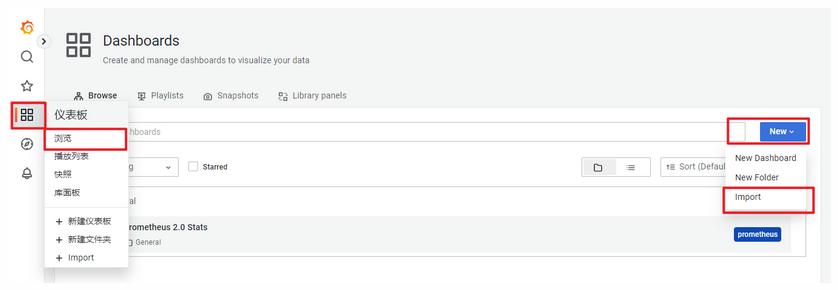
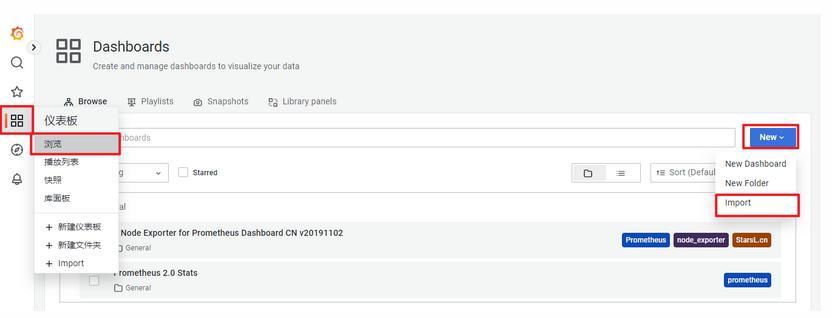
添加儀表盤
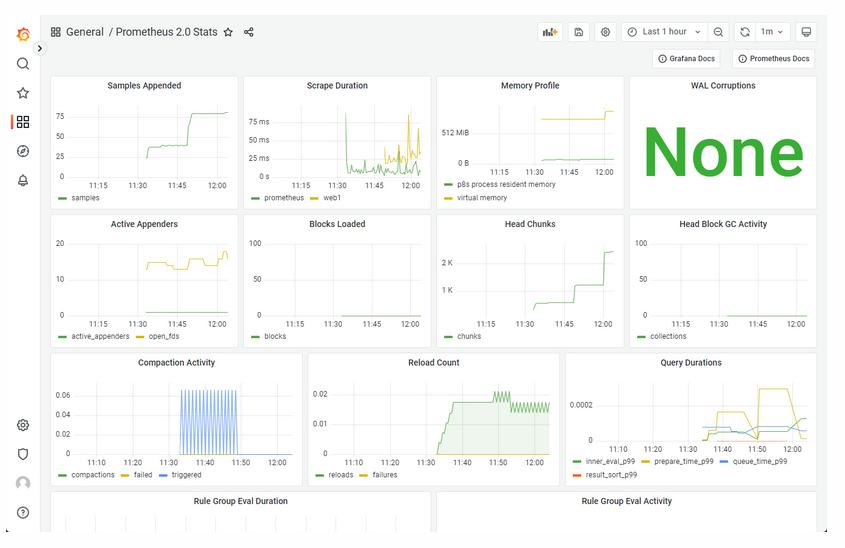
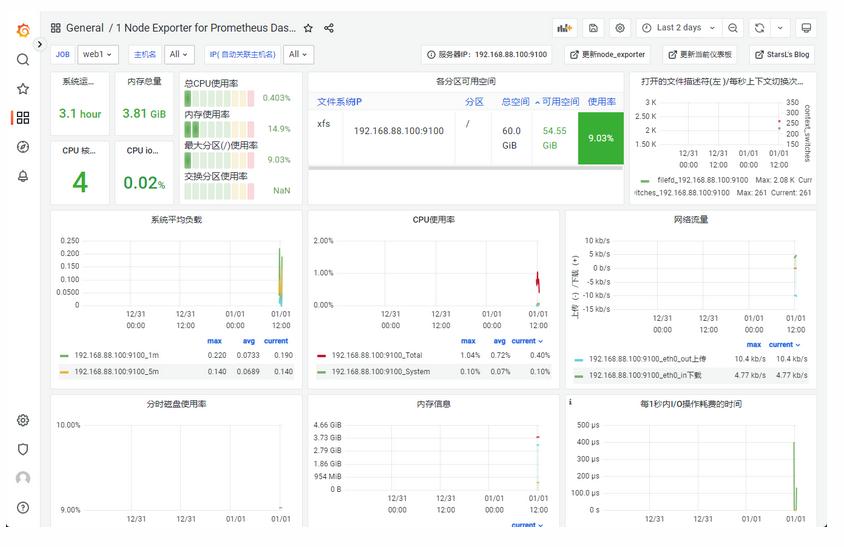
查看儀表盤
3.展示node1的監控信息
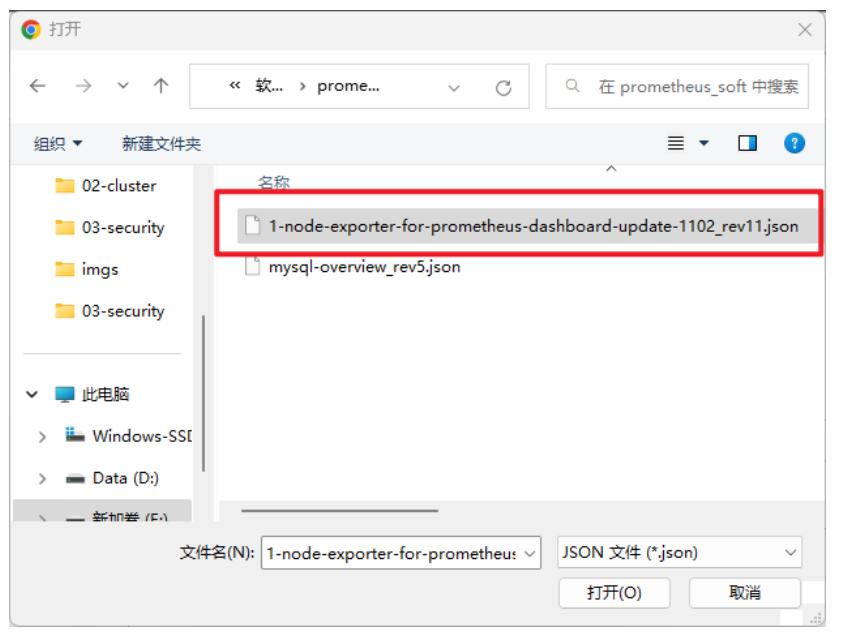
grafana模板下載:Grafana dashboards | Grafana Labs
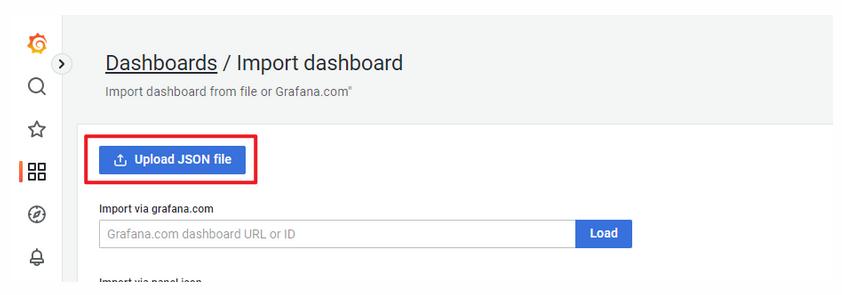
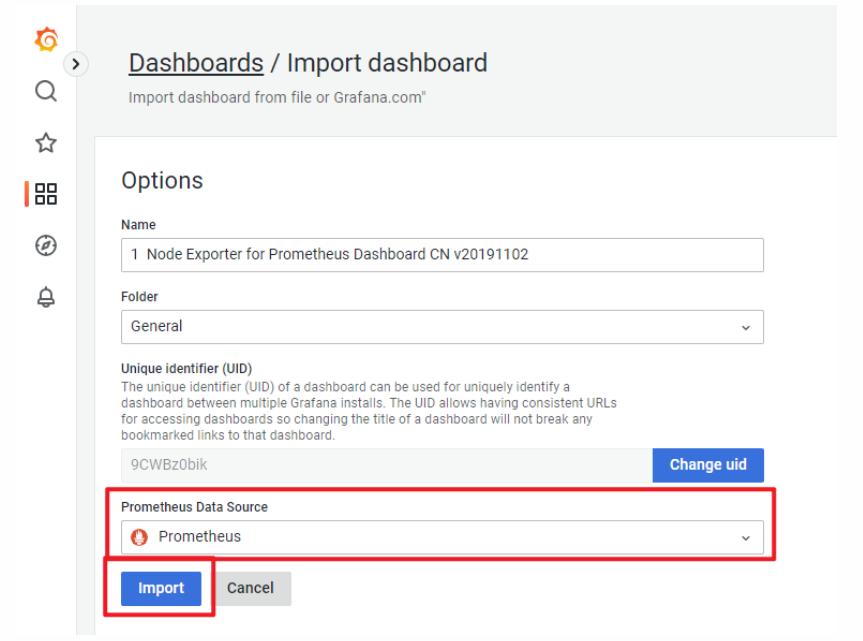
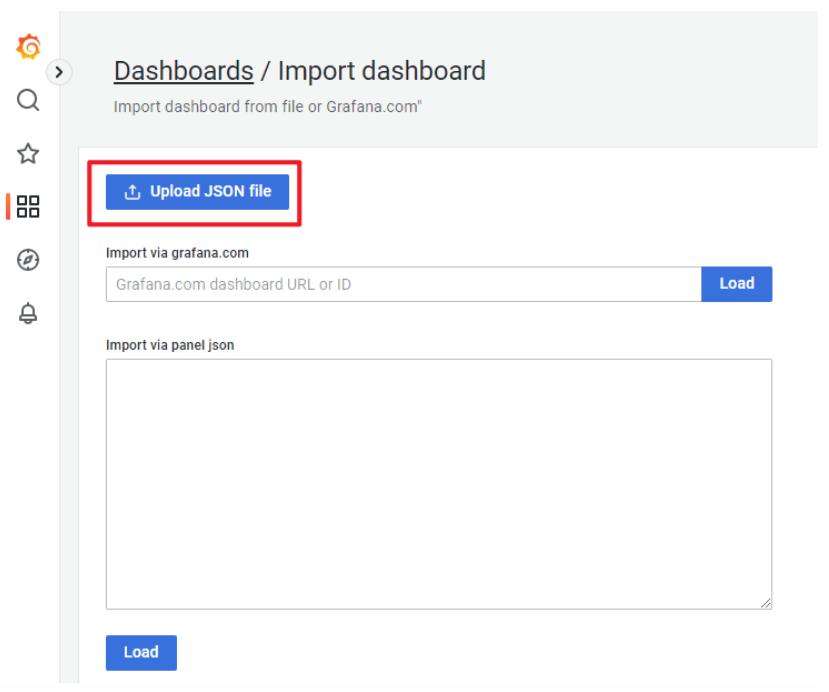
導入主機監控模板。
`
七、監控MySQL數據庫
服務名:mysqld_exporter
端口:9104
1、配置MySQL
[root@web1 ~]# yum install -y mysql-server
[root@web1 ~]# systemctl enable mysqld --now
[root@web1 ~]# mysql
mysql> create user dbuser1@localhost identified by '123456';
mysql> grant all privileges on *.* to dbuser1@localhost;
mysql> quit
2、配置mysql exporter
# 安裝
[root@prometheus ~]# scp prometheus_soft/mysqld_exporter-0.14.0.linux-amd64.tar.gz 192.168.88.100:/root/
[root@web1 ~]# tar xf mysqld_exporter-0.14.0.linux-amd64.tar.gz
[root@web1 ~]# mv mysqld_exporter-0.14.0.linux-amd64 /usr/local/mysqld_exporter
# 編寫用于連接mysql服務的配置文件
[root@web1 ~]# vim /usr/local/mysqld_exporter/.my.cnf
[client]
host=127.0.0.1
port=3306
user=dbuser1
password=123456
# 創建service文件
[root@web1 ~]# vim /usr/lib/systemd/system/mysqld_exporter.service
[Unit]
Description=mysqld_exporter
After=network.target
[Service]
ExecStart=/usr/local/mysqld_exporter/mysqld_exporter \
--config.my-cnf=/usr/local/mysqld_exporter/.my.cnf
[Install]
WantedBy=multi-user.target
[root@web1 ~]# systemctl daemon-reload
[root@web1 ~]# systemctl enable mysqld_exporter.service --now
3、配置prometheus監控mysql
#在配置文件中追加內容
[root@prometheus ~]# vim /usr/local/prometheus/prometheus.yml
...略...
??- job_name: "mysql"
?? ?static_configs:
?? ? ?- targets: ["192.168.88.100:9104"]
?? ? ?
#重啟服務
[root@prometheus ~]# systemctl restart prometheus.service
- 查看狀態
5、在Grafana中展示數據
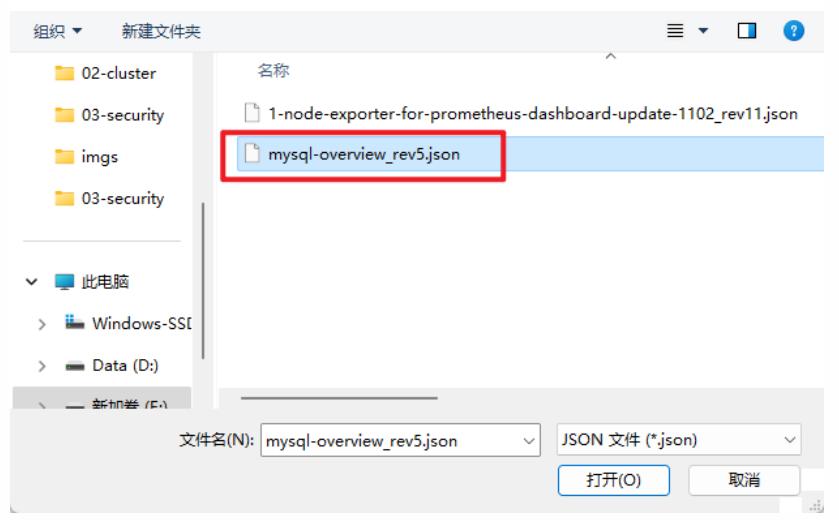
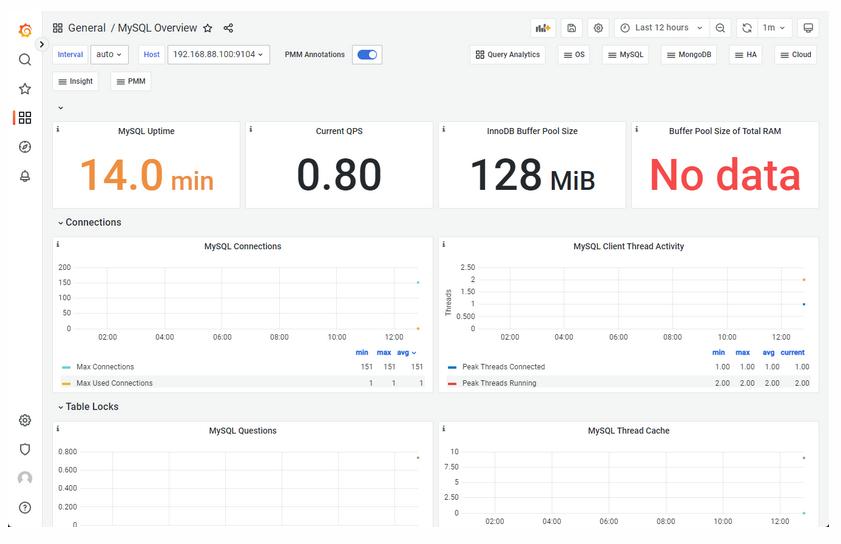


)
】 需求工程之:面向對象需求分析方法:統一建模語言(UML)(下))
)


圖表--儀表盤)

)
:如何快速創建一個組件)
