軟件說明:
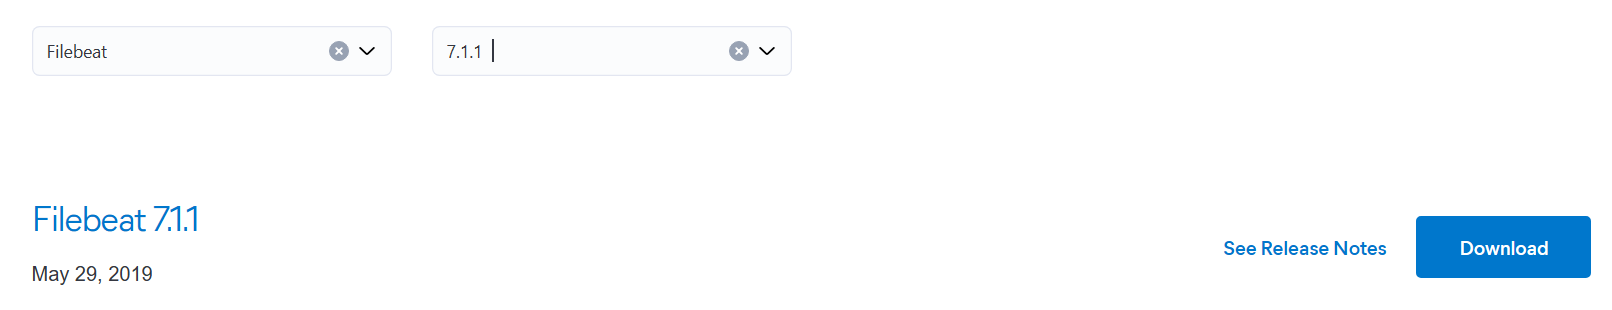
所有軟件包下載地址:Past Releases of Elastic Stack Software | Elastic
打開頁面后選擇對應的組件及版本即可!
所有軟件包名稱如下:
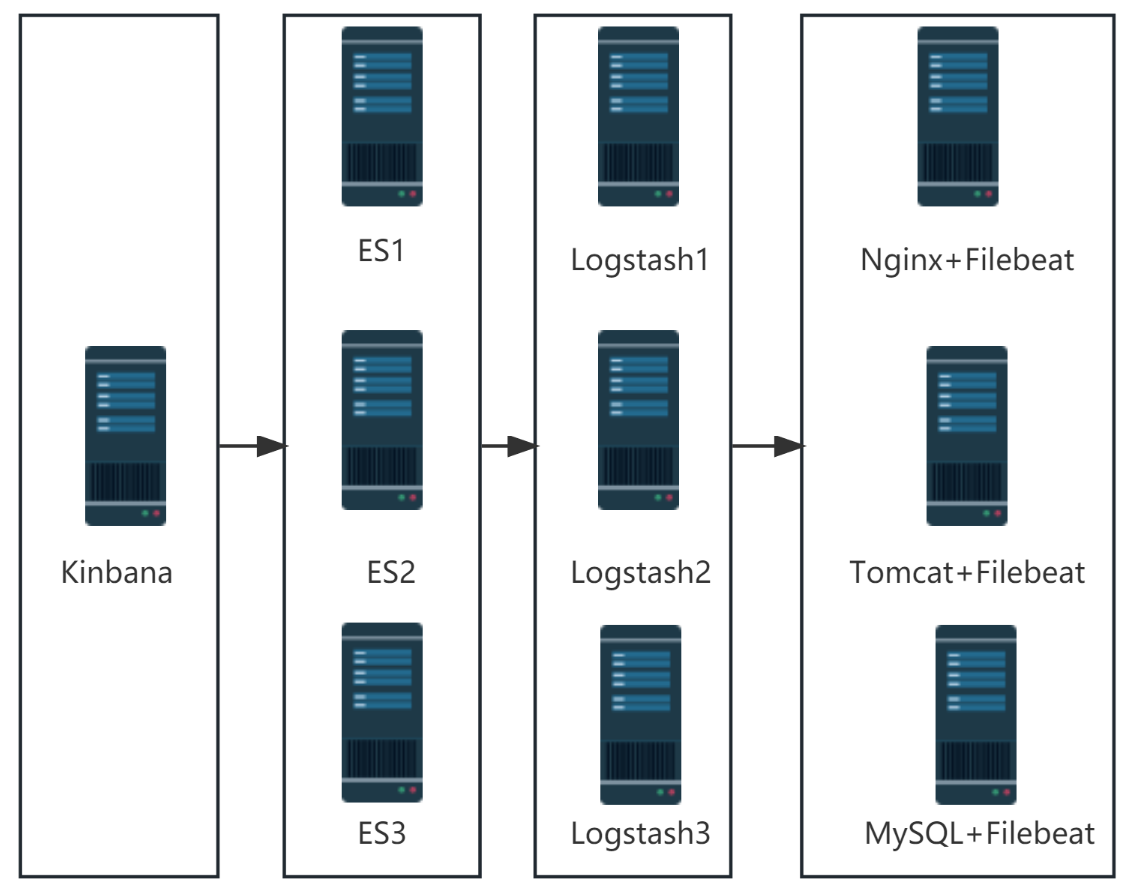
 架構拓撲:
架構拓撲:
-
集群模式:
-
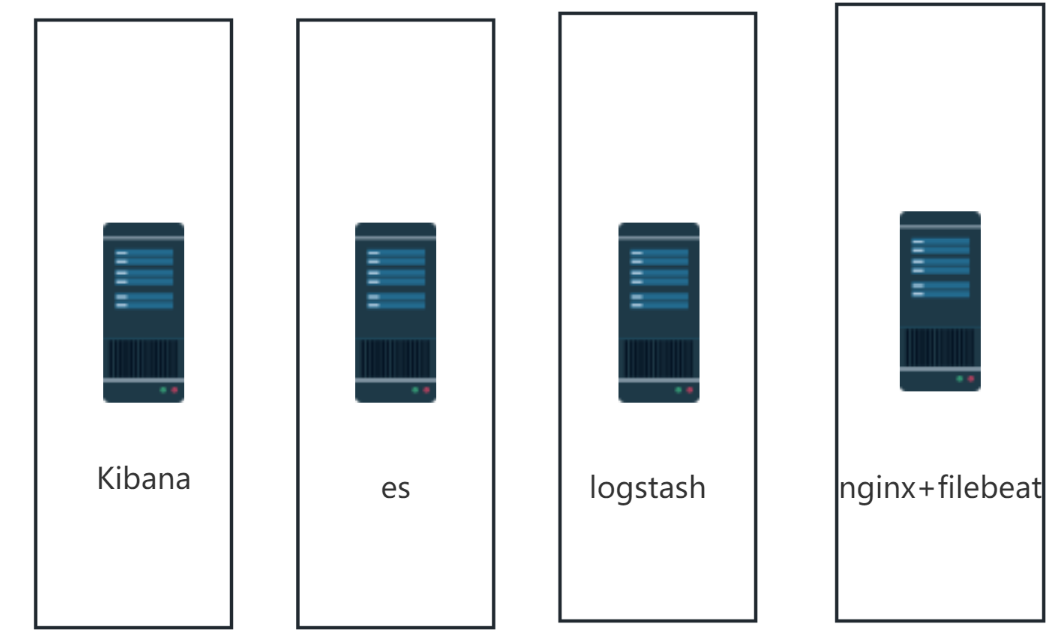
單機模式
架構規劃:
-
集群模式
| 角色 | 主機名 | IP地址 |
|---|---|---|
| 圖形展示 | kibana | 192.168.166.111 |
| 日志存儲 | es1 | 192.168.158.6 |
| es2 | 192.168.166.113 | |
| es3 | 192.168.166.114 | |
| 日志收集分析 | lostash1 | 192.168.166.166 |
| lostash2 | 192.168.166.116 | |
| lostash3 | 192.168.166.117 | |
| 日志采集 | access、error | 192.168.166.118 |
-
單機模式
角色 主機名 IP地址 圖形展示 kibana 192.168.166.111 日志存儲 es 192.168.158.6 日志收集分析 lostash 192.168.166.113 日志采集 access、error 192.168.166.114 說明:以下部署過程為單機模式部署,集群模式請自行修改部署!!!
一、 Elasticsearch安裝與配置
修改主機名
[root@localhost ~]# hostnamecl set-hostname  es
[root@localhost ~]# bash
[root@es ~]#
配置主機名解析
[root@es ~]# cat /etc/hosts
192.168.166.111 kibana
192.168.158.6 es
192.168.166.113 logstash
192.168.166.114 nginx
時間同步?
[root@elk ~]# vim /etc/chrony.conf server ntp.aliyun.com iburst[root@elk ~]# systemctl restart chronyd.service
[root@elk ~]# date
2025年 07月 16日 星期三 20:48:10 CST
?
安裝JAVA8
[root@es ~]# yum install -y java(Rocky8 yum安裝版本為java-1.8.0-openjdk)??
將elasticsearch軟件包拷貝至elk主機執行安裝
[root@es ~]# yum localinstall -y elasticsearch-7.1.1-x86_64.rpm#安裝軟件包需要的依賴?
配置elasticsearch
[root@es ~]# cd /etc/elasticsearch/
[root@es elasticsearch]# cat elasticsearch.yml | grep -Ev "^#"
cluster.name: my-application #集群名稱
node.name: es #節點主機名
path.data: /var/lib/elasticsearch #數據存放目錄
path.logs: /var/log/elasticsearch #日志存放目錄
network.host: 192.168.158.6 #監聽IP地址
http.port: 9200 #監聽端口號
cluster.initial_master_nodes: ["es"] #主節點
http.cors.enabled: true
http.cors.allow-origin: "*"
?
#####集群模式下修改為如下配置:
cluster.name: my-application #集群名稱
node.name: es #節點主機名
path.data: /var/lib/elasticsearch #數據存放目錄
path.logs: /var/log/elasticsearch #日志存放目錄
network.host: 192.168.158.6 #監聽IP地址
http.port: 9200 #監聽端口號
http.cors.enabled: true #跨域訪問
http.cors.allow-origin: "*" #跨域訪問
cluster.initial_master_nodes: ["192.168.158.6","192.168.166.113","192.168.166.114"] #主節點
discovery.zen.ping.unicast.hosts: ["192.168.158.6", "192.168.166.113", "192.168.166.114"] # 配置自動發現
discovery.zen.minimum_master_nodes: 2 #防止集群“腦裂”,需要配置集群最少主節點數目,通常為 (主節點數目/2) + 1
啟動elasticsearch服務并設置開機自啟動
[root@es ~]# systemctl start elasticsearch.service
[root@es ~]# systemctl enable elasticsearch.service實驗環境開機自啟會占用大量內存,易卡頓,這里僅啟動
驗證啟動結果
[root@es ~]# systemctl status elasticsearch.service
[root@es ~]# ss -antl|grep 9200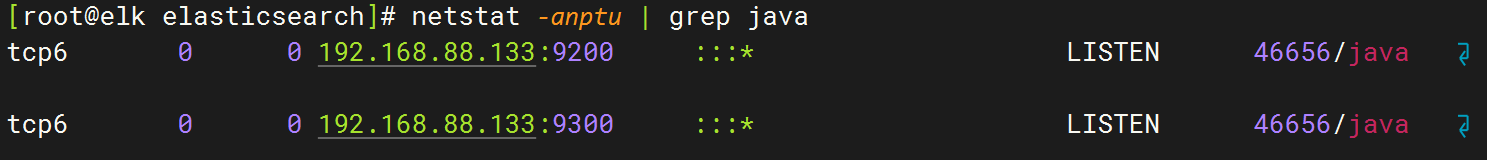 ?
?
二、 logstash安裝與配置
修改主機名
[root@localhost ~]# hostnamecl set-hostname  logstash
[root@localhost ~]# bash
[root@logstash ~]#
配置主機名解析
[root@logstash ~]# cat /etc/hosts
192.168.166.111 kibana
192.168.158.6 es
192.168.166.113 logstash
192.168.166.114 nginx
安裝JAVA8(系統自帶)
[root@logstash ~]# yum install -y java將logstash軟件包拷貝至elk主機執行安裝
[root@logstash ~]# yum localinstall -y logstash-7.1.1.rpm優化logstash命令
[root@logstash ~]# ln -s /usr/share/logstash/bin/logstash /usr/local/bin/配置logstash
[root@logstash ~]# cd /etc/logstash/
[root@logstash logstash]# cat logstash.yml
path.data: /var/lib/logstash #數據存儲路徑
http.host: "192.168.166.113" #監聽地址
http.port: 9600-9700 #監聽端口范圍
path.logs: /var/log/logstash #日志存儲路徑
測試logstash服務的數據傳輸
##標準輸入與輸出
[root@logstash ~]# logstash -e 'input{ stdin{} }output { stdout{} }'
##使用rubydebug解碼
[root@logstash ~]# logstash -e 'input { stdin{} } output { stdout{ codec=>rubydebug }}'
##輸出到elasticsearch
[root@logstash ~]# logstash -e 'input { stdin{} } output { elasticsearch{ hosts=>["192.168.158.6:9200"]} }'
創建配置文件
[root@logstash ~]# cd /etc/logstash/conf.d/logstash/conf.d
[root@logstash ~]# cat pipline.conf
input {beats {port => 5044}
}
output {if "access" in [tags] {elasticsearch {hosts => ["192.168.158.6:9200"]index => "access-%{+YYYY.MM.dd}"}}if "error" in [tags] {elasticsearch {hosts => ["192.168.158.6:9200"]index => "error-%{+YYYY.MM.dd}"}}
###日志進行標準輸出,觀察日志獲取的過程###stdout {codec => rubydebug}
}
? #####集群模式下修改問如下配置:
input {beats {port => 5044}
}
output {if "access" in [tags] {elasticsearch {hosts => ["192.168.158.6:9200"]index => "access-%{+YYYY.MM.dd}"}}if "error" in [tags] {elasticsearch {hosts => ["192.168.158.6:9200"]index => "error-%{+YYYY.MM.dd}"}}
###日志進行標準輸出,觀察日志獲取的過程###
?stdout {codec => rubydebug}
}
啟動logstash服務
[root@logstash ~]# logstash -f /etc/logstash/conf.d/pipline.conf &三、 nginx、filebeat安裝與配置
修改主機名
[root@localhost ~]# hostnamecl set-hostname  nginx
[root@localhost ~]# bash
[root@nginx ~]#
配置主機名解析
[root@logstash ~]# cat /etc/hosts
192.168.166.111 kibana
192.168.158.6 es
192.168.166.113 logstash
192.168.166.114 nginx
nginx安裝與啟動
[root@nginx ~]# yum install -y epel-release
[root@nginx ~]# yum install -y nginx
[root@nginx ~]# systemctl start nginx
filebeat安裝
[root@nginx ~]# yum localinstall -y filebeat-7.1.1-x86_64.rpmfilebeat配置項
[root@nginx ~]# cd /etc/filebeat
[root@nginx ~]# cat filebeat.yml| 配置項 | 作用 |
|---|---|
| filebeat.inputs | 輸入配置塊,用于指定 Filebeat 應該監聽哪些文件并將其作為輸入。你可以指定文件路徑、文件類型、文件格式等。 |
| filebeat.prospectors | 這是一種更靈活的輸入方式,它允許你同時監聽多個目錄或文件系統中的多個文件。它結合了輸入和輸出配置項,使得配置更加靈活。 |
| filebeat.config | 用于加載和執行自定義的配置文件。你可以使用此選項加載其他 YAML 文件,以便在 Filebeat 中使用自定義規則和插件。 |
| output.elasticsearch | 輸出配置塊,用于將日志數據發送到 Elasticsearch。你可以指定 Elasticsearch 的地址、端口、索引名稱等。 |
| output.logstash | 輸出配置塊,用于將日志數據發送到 Logstash。你可以指定 Logstash 的地址、端口、輸入格式等。 |
| filebeat.harvester | Harvester 是 Filebeat 的核心組件之一,負責監聽文件并將其拆分為事件。你可以通過配置項來調整 Harvester 的行為,例如事件級別、分隔符等。 |
| filebeat.scanner | Scanner 負責定期掃描指定路徑中的新文件并觸發事件收集。你可以通過配置項來調整 Scanner 的行為,例如掃描頻率、延遲等。 |
| filebeat.processor | 處理器用于對收集到的日志事件進行處理和解析。你可以使用內置的處理器類型(如過濾器、映射器等)來對事件進行過濾、轉換和編碼。 |
| filebeat.registry | 注冊表用于存儲 Filebeat 的配置信息、事件數據和資源狀態。你可以通過配置項來調整注冊表的行為和存儲方式。 |
日志收集
filebeat 7.1以上支持模版收集日志和傳統方式收集日志,具體每個方式的配置如下:
1、 采用filebeat的nginx模塊收集nginx日志
##filebeat模塊操作命令:
#查看支持的模塊
[root@nginx ~]# filebeat modules list
#啟用nginx模塊
[root@nginx ~]# filebeat modules enable nginx
#配置nginx模塊
[root@nginx ~]# cd /etc/filebeat/modules.d
[root@nginx ~]# cat nginx.yml
- module: nginx# Access logsaccess:enabled: truevar.paths: ["/var/log/nginx/access.log"]# Error logserror:enabled: truevar.paths: ["/var/log/nginx/error.log"]
#################測試配置文件
[root@localhost ~]# filebeat test config -e
2、傳統方式收集
【輸出給logstash】
[root@localhost ~]# cat /etc/filebeat/filebeat.yml
filebeat.inputs:
- type: logenabled: truepaths:- /var/log/access/*.logtags: "nignx1"
- type: logenabled: truepaths:- /var/log/error/*.logtags: "nignx2"
output.logstash:hosts: ["192.168.166.113:5044"]
#################測試配置文件
[root@localhost ~]# filebeat test config -e【輸出給elasticsearch】
[root@localhost ~]# cat /etc/filebeat/filebeat.yml
filebeat.inputs:
- type: logenabled: truepaths:- /var/log/nginx/access.log- /var/log/nginx/error.log
output.elasticsearch:# Array of hosts to connect to.hosts: ["192.168.166.129:9200"]index: "nginx-access-%{[host.name]}-%{+yyyy.MM.dd}"# 自定義索引名稱
setup.ilm.enabled: false ? # 索引生命周期 ilm 功能默認開啟,開啟情況下索引名稱只能為 filebeat-*
setup.template.name: "nginx1" # 定義模板名稱
setup.template.pattern: "nginx1-*" # 定義模板的匹配索引名稱
?
#####產生不同索引的方法#####
output.elasticsearch:# Array of hosts to connect to.hosts: ["192.168.166.22:9200"]indices:- index: "nginx1-access-logs"when:contains:{ "message": "GET"}- index: "nginx1-error-logs"when:contains:{ "message": "error" }
setup.ilm.enabled: false
setup.template.name: "nginx1"
setup.template.pattern: "nginx1-*"
?
#################測試配置文件
[root@localhost ~]# filebeat test config -e啟動filebeat
[root@nginx ~]# systemctl start filebeat
[root@nginx ~]# systemctl enabled filebeat
es續期
curl -XPosT 'http://192.168.88.133:9200/_license/start_trial?acknowledge=true'四、 Kibana安裝與配置
修改主機名
[root@localhost ~]# hostnamecl set-hostname  logstash
[root@localhost ~]# bash
[root@logstash ~]#
配置主機名解析
[root@logstash ~]# cat /etc/hosts
192.168.166.111 kibana
192.168.158.6 elk
192.168.166.113 logstash
192.168.166.114 nginx
192.168.166.166 tomcat
192.168.166.116 mysql
安裝JAVA8
[root@logstash ~]# yum install -y java將logstash軟件包拷貝至elk主機執行安裝
[root@logstash ~]# yum localinstall -y kibana-7.1.1-x86_64.rpm配置kibana
[root@kibana]# cd /etc/kibana/
[root@kibana kibana]# cat kibana.yml
server.port: 5601 #監聽端口
server.host: "192.168.166.111" #監聽地址
server.name: "kibana" #主機名
elasticsearch.hosts: ["http://192.168.158.6:9200"] #連接的elasticsearch服務器
kibana.index: ".kibana" #kibana的索引
i18n.locale: "zh-CN" #漢化
?
##集群模式下配置:
server.port: 5601 #監聽端口
server.host: "192.168.166.111" #監聽地址
server.name: "kibana" #主機名
elasticsearch.hosts: ["http://192.168.158.6:9200","http://192.168.166.113:9200","http://192.168.166.114:9200"] #連接的elasticsearch服務器
kibana.index: ".kibana" #kibana的索引
i18n.locale: "zh-CN" #漢化
?
訪問kibana
#在瀏覽器中輸入:
http://192.168.166.111:5601
創建索引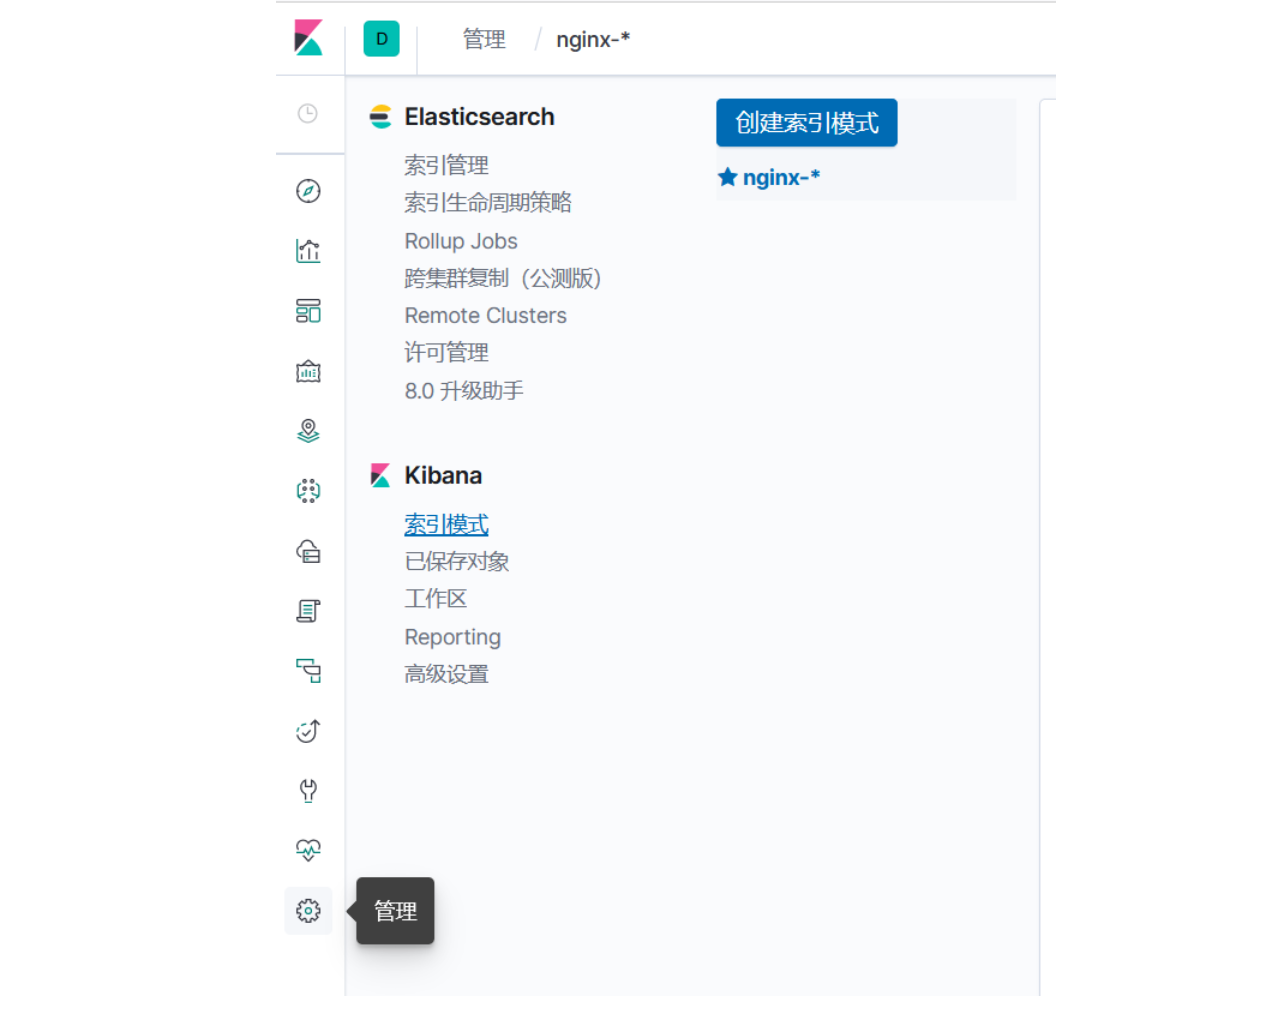
創建篩選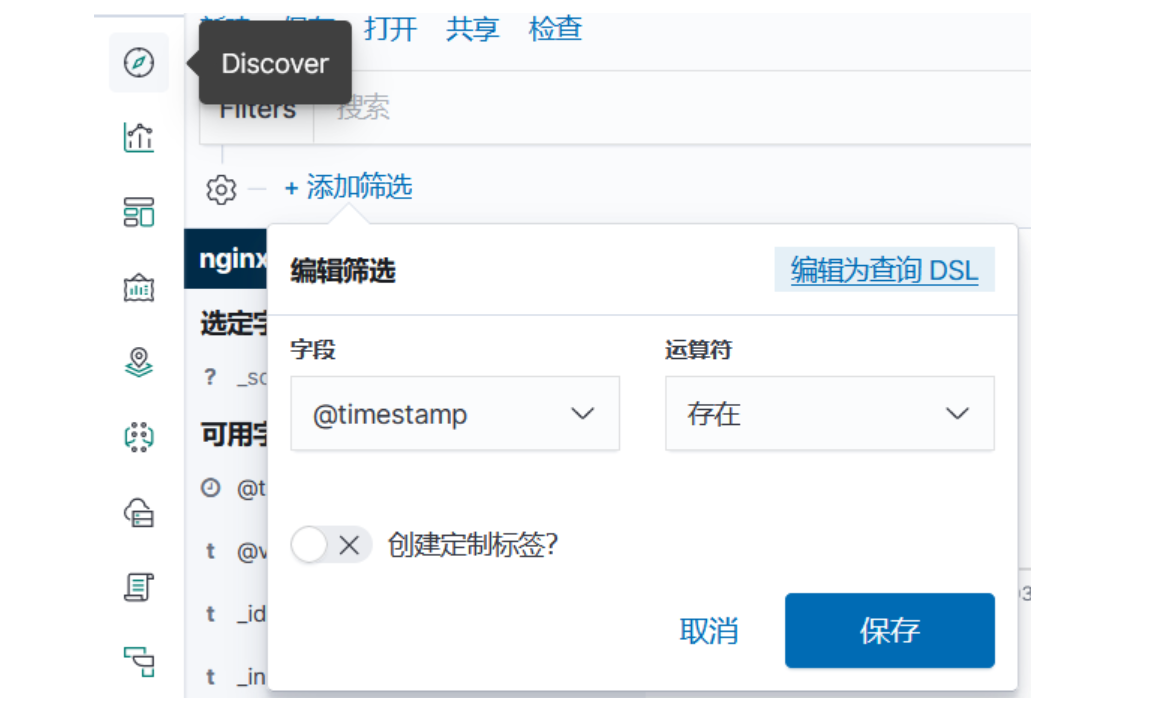
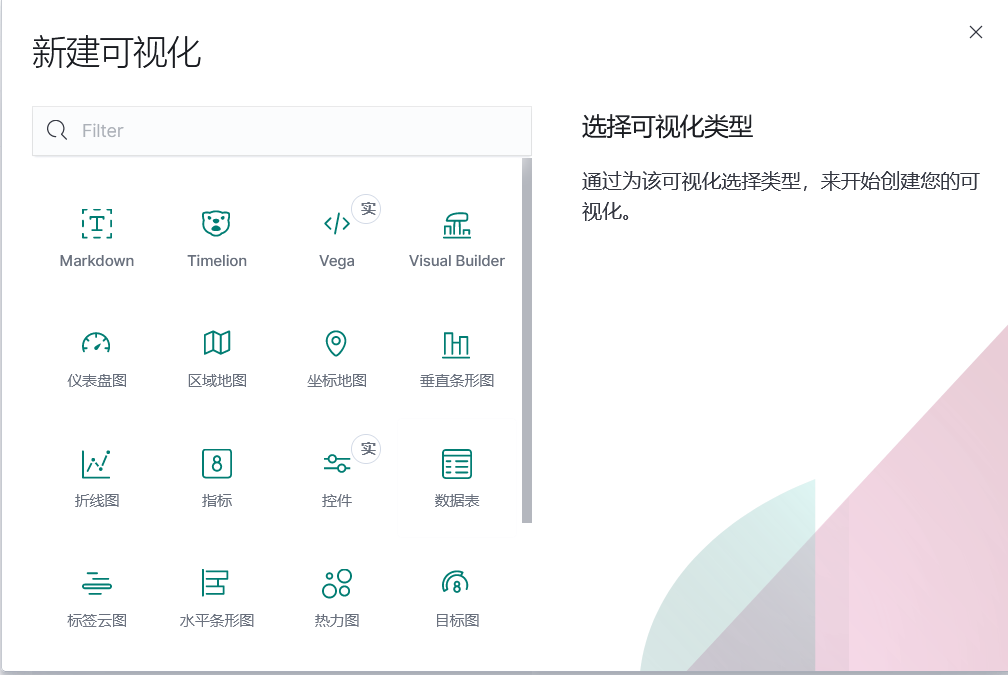
添加儀表盤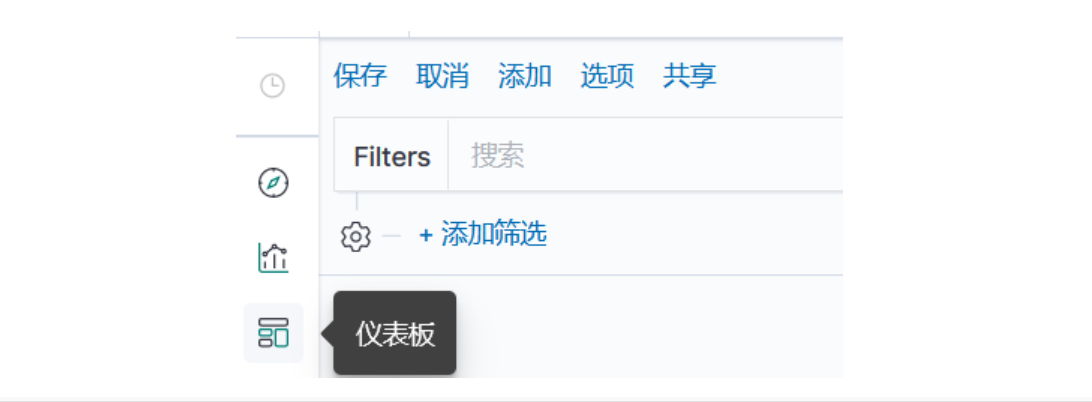
 ?
?
 ?
?
 ?
?


![[硬件電路-20]:模擬信號處理運算與數字信號處理運算的相同點與不同點](http://pic.xiahunao.cn/[硬件電路-20]:模擬信號處理運算與數字信號處理運算的相同點與不同點)


)
![[智能算法]MOEA/D算法的Python實現](http://pic.xiahunao.cn/[智能算法]MOEA/D算法的Python實現)


)


