Cilium動手實驗室: 精通之旅---19.Golden Signals with Hubble and Grafana
- 1. Lab 環境
- 2. 部署測試應用
- 2.1 7層可見性的網絡
- 2.1.1 允許所有命名空間
- 2.1.2 DNS 可見性
- 2.1.3 L7-egress-visibility
- 2.2 檢查 Deployments
- 2.3 在 Hubble UI 中查看
- 3. Grafana 選項卡
- 3.1 Grafana 中的 Hubble L7 HTTP 指標
- 3.2 L7 Hubble 儀表板
- 4. 吞吐量
- 4.1 提高請求速率
- 5. 增加錯誤率
- 6. 延遲
- 6.1 增加請求持續時間
- 7. 跟蹤集成
- 7.1 介紹
- 7.2 Grafana 中的痕跡
- 7.3 訪問 Tempo
- 8. 最終實驗
- 8.1 題目
- 8.2 解題
- 8.2.1 圖形化界面確認問題
- 8.2.2 命令行下確認問題
1. Lab 環境
LAB訪問地址
https://isovalent.com/labs/hubble-grafana-golden-signals/
在本實驗中,我們部署了:
- 啟用 Hubble 和度量標準的 Cilium 1.17.1
- Kube Prometheus Stack Helm 圖表(包括 Prometheus 和 Grafana)
特別是,使用了以下 Cilium Helm 參數(完整的值文件位于 /tmp/helm/cilium-values.yaml):
root@server:~# yq /tmp/helm/cilium-values.yaml
kubeProxyReplacement: true
k8sServiceHost: kind-control-plane
k8sServicePort: 6443
operator:# only 1 replica needed on a single node setupreplicas: 1prometheus:enabled: trueserviceMonitor:enabled: true
hubble:relay:# enable relay in 02# enabled: trueservice:type: NodePortprometheus:enabled: trueserviceMonitor:enabled: truemetrics:serviceMonitor:enabled: trueenableOpenMetrics: trueenabled:- dns- drop- tcp- icmp- "flow:sourceContext=workload-name|reserved-identity;destinationContext=workload-name|reserved-identity"- "kafka:labelsContext=source_namespace,source_workload,destination_namespace,destination_workload,traffic_direction;sourceContext=workload-name|reserved-identity;destinationContext=workload-name|reserved-identity"- "httpV2:exemplars=true;labelsContext=source_ip,source_namespace,source_workload,destination_ip,destination_namespace,destination_workload,traffic_direction;sourceContext=workload-name|reserved-identity;destinationContext=workload-name|reserved-identity"dashboards:enabled: truenamespace: monitoringannotations:grafana_folder: "Hubble"ui:# enable UI in 02# enabled: trueservice:type: NodePort
prometheus:enabled: trueserviceMonitor:enabled: true
在本實驗中,我們將使用 Cilium 的 Hubble 子系統生成的 Prometheus 指標來監控 HTTP 黃金信號。
具體而言,我們使用以下命令啟用了 httpv2 Hubble 指標:
httpV2:exemplars=true;labelsContext=source_ip,source_namespace,source_workload,destination_ip,destination_namespace,destination_workload,traffic_direction;sourceContext=workload-name|reserved-identity;destinationContext=workload-name|reserved-identity
這是一條相當長的隊伍。讓我們拆分選項以了解它們的作用:
examplars=true將允許我們將應用程序跟蹤中的 OpenTelemetry 跟蹤點顯示為 Grafana 圖形上的疊加層labelsContext設置為向指標添加額外的標簽,包括源/目標 IP、源/目標命名空間、源/目標工作負載以及流量方向(入口或出口)sourceContext設置源標簽的構建方式,在這種情況下,盡可能使用工作負載名稱,否則使用保留身份(例如world)destinationContext對目標執行相同的作
檢查 Cilium 是否已正確安裝并準備就緒
root@server:~# cilium status --wait/ˉˉ\/ˉˉ\__/ˉˉ\    Cilium:             OK\__/ˉˉ\__/    Operator:           OK/ˉˉ\__/ˉˉ\    Envoy DaemonSet:    OK\__/ˉˉ\__/    Hubble Relay:       disabled\__/       ClusterMesh:        disabledDaemonSet              cilium                   Desired: 3, Ready: 3/3, Available: 3/3
DaemonSet              cilium-envoy             Desired: 3, Ready: 3/3, Available: 3/3
Deployment             cilium-operator          Desired: 1, Ready: 1/1, Available: 1/1
Containers:            cilium                   Running: 3cilium-envoy             Running: 3cilium-operator          Running: 1clustermesh-apiserver    hubble-relay
Cluster Pods:          8/8 managed by Cilium
Helm chart version:    1.17.1
Image versions         cilium             quay.io/cilium/cilium:v1.17.1@sha256:8969bfd9c87cbea91e40665f8ebe327268c99d844ca26d7d12165de07f702866: 3cilium-envoy       quay.io/cilium/cilium-envoy:v1.31.5-1739264036-958bef243c6c66fcfd73ca319f2eb49fff1eb2ae@sha256:fc708bd36973d306412b2e50c924cd8333de67e0167802c9b48506f9d772f521: 3cilium-operator    quay.io/cilium/operator-generic:v1.17.1@sha256:628becaeb3e4742a1c36c4897721092375891b58bae2bfcae48bbf4420aaee97: 1
2. 部署測試應用
我們在后臺部署了 jobs-app demo 工作負載應用程序,以生成將要分析的 HTTP 流量。
2.1 7層可見性的網絡
jobs-app 應用程序附帶一組 Cilium 網絡策略資源,這些資源使用 Cilium 的 Envoy 代理實現第 7 層可見性。
List them with: 列出它們:
root@server:~# kubectl -n tenant-jobs get cnp
NAME                         AGE     VALID
allow-all-within-namespace   3m30s   True
dns-visibility               3m30s   False
l7-egress-visibility         3m30s   True
l7-ingress-visibility        3m30s   True
2.1.1 允許所有命名空間
使用以下命令檢查策略:
root@server:~# kubectl -n tenant-jobs get cnp allow-all-within-namespace -o yaml
apiVersion: cilium.io/v2
kind: CiliumNetworkPolicy
metadata:annotations:meta.helm.sh/release-name: jobs-appmeta.helm.sh/release-namespace: tenant-jobscreationTimestamp: "2025-06-03T09:02:53Z"generation: 1labels:app.kubernetes.io/managed-by: Helmname: allow-all-within-namespacenamespace: tenant-jobsresourceVersion: "4789"uid: 9de56664-8f96-4eb2-a842-09f215f7685f
spec:description: Allow all within namespaceegress:- toEndpoints:- {}endpointSelector: {}ingress:- fromEndpoints:- {}
status:conditions:- lastTransitionTime: "2025-06-03T09:02:53Z"message: Policy validation succeededstatus: "True"type: Valid
此策略可確保默認情況下允許所有流量。雖然從安全角度來看,這不是最佳實踐,但它使本練習的設置更加容易。查看 Zero Trust Visibility 實驗室,了解有關保護命名空間的最佳方法的更多信息。
2.1.2 DNS 可見性
使用以下命令檢查策略:
root@server:~# kubectl -n tenant-jobs get cnp dns-visibility -o yaml
apiVersion: cilium.io/v2
kind: CiliumNetworkPolicy
metadata:annotations:meta.helm.sh/release-name: jobs-appmeta.helm.sh/release-namespace: tenant-jobscreationTimestamp: "2025-06-03T09:02:53Z"generation: 1labels:app.kubernetes.io/managed-by: Helmname: dns-visibilitynamespace: tenant-jobsresourceVersion: "4819"uid: c2739fed-3c39-451d-85bc-a2481eef3446
spec:egress:- toEndpoints:- matchLabels:k8s:io.kubernetes.pod.namespace: kube-systemk8s:k8s-app: kube-dnstoPorts:- ports:- port: "53"protocol: ANYrules:dns:- matchPattern: '*'- toFQDNs:- matchPattern: '*'- toEntities:- allendpointSelector:matchLabels: {}
status:conditions:- lastTransitionTime: "2025-06-03T09:02:53Z"message: FQDN regex compilation LRU not yet initializedstatus: "False"type: Valid
此策略允許命名空間中的 Pod 訪問 Kube DNS 服務。它還添加了一個 DNS 規則,用于通過 Cilium 的 DNS 代理獲取 DNS 流量,這使得解析 Hubble 流中的 DNS 名稱成為可能。
2.1.3 L7-egress-visibility
使用以下命令檢查策略:
root@server:~# kubectl -n tenant-jobs get cnp l7-ingress-visibility -o yaml
apiVersion: cilium.io/v2
kind: CiliumNetworkPolicy
metadata:annotations:meta.helm.sh/release-name: jobs-appmeta.helm.sh/release-namespace: tenant-jobscreationTimestamp: "2025-06-03T09:02:53Z"generation: 1labels:app.kubernetes.io/managed-by: Helmname: l7-ingress-visibilitynamespace: tenant-jobsresourceVersion: "4829"uid: 0a049efb-6bd8-475f-a607-adbfebaccc5f
spec:description: L7 policyendpointSelector: {}ingress:- toPorts:- ports:- port: "9080"protocol: TCP- port: "50051"protocol: TCP- port: "9200"protocol: TCPrules:http:- {}
status:conditions:- lastTransitionTime: "2025-06-03T09:02:53Z"message: Policy validation succeededstatus: "True"type: Valid
最后一個策略允許從命名空間中的所有 Pod 到 TCP 中的端口 9080、50051 和 9200 的入口流量。它強制這些流量通過 Cilium 的 Envoy 代理來實現第 7 層可見性。
2.2 檢查 Deployments
讓我們等到一切準備就緒。這可能需要幾分鐘時間才能部署所有組件:
kubectl rollout -n tenant-jobs status deployment/coreapi
kubectl rollout -n tenant-jobs status deployment/crawler
kubectl rollout -n tenant-jobs status deployment/jobposting
kubectl rollout -n tenant-jobs status deployment/loader
kubectl rollout -n tenant-jobs status deployment/recruiter
kubectl rollout -n tenant-jobs status deployment/resumes
2.3 在 Hubble UI 中查看
檢查 Hubble UI 是否已正確部署:
root@server:~# cilium status --wait/ˉˉ\/ˉˉ\__/ˉˉ\    Cilium:             OK\__/ˉˉ\__/    Operator:           OK/ˉˉ\__/ˉˉ\    Envoy DaemonSet:    OK\__/ˉˉ\__/    Hubble Relay:       OK\__/       ClusterMesh:        disabledDaemonSet              cilium                   Desired: 3, Ready: 3/3, Available: 3/3
DaemonSet              cilium-envoy             Desired: 3, Ready: 3/3, Available: 3/3
Deployment             cilium-operator          Desired: 1, Ready: 1/1, Available: 1/1
Deployment             hubble-relay             Desired: 1, Ready: 1/1, Available: 1/1
Deployment             hubble-ui                Desired: 1, Ready: 1/1, Available: 1/1
Containers:            cilium                   Running: 3cilium-envoy             Running: 3cilium-operator          Running: 1clustermesh-apiserver    hubble-relay             Running: 1hubble-ui                Running: 1
Cluster Pods:          21/21 managed by Cilium
Helm chart version:    1.17.1
Image versions         cilium             quay.io/cilium/cilium:v1.17.1@sha256:8969bfd9c87cbea91e40665f8ebe327268c99d844ca26d7d12165de07f702866: 3cilium-envoy       quay.io/cilium/cilium-envoy:v1.31.5-1739264036-958bef243c6c66fcfd73ca319f2eb49fff1eb2ae@sha256:fc708bd36973d306412b2e50c924cd8333de67e0167802c9b48506f9d772f521: 3cilium-operator    quay.io/cilium/operator-generic:v1.17.1@sha256:628becaeb3e4742a1c36c4897721092375891b58bae2bfcae48bbf4420aaee97: 1hubble-relay       quay.io/cilium/hubble-relay:v1.17.1@sha256:397e8fbb188157f744390a7b272a1dec31234e605bcbe22d8919a166d202a3dc: 1hubble-ui          quay.io/cilium/hubble-ui-backend:v0.13.1@sha256:0e0eed917653441fded4e7cdb096b7be6a3bddded5a2dd10812a27b1fc6ed95b: 1hubble-ui          quay.io/cilium/hubble-ui:v0.13.1@sha256:e2e9313eb7caf64b0061d9da0efbdad59c6c461f6ca1752768942bfeda0796c6: 1
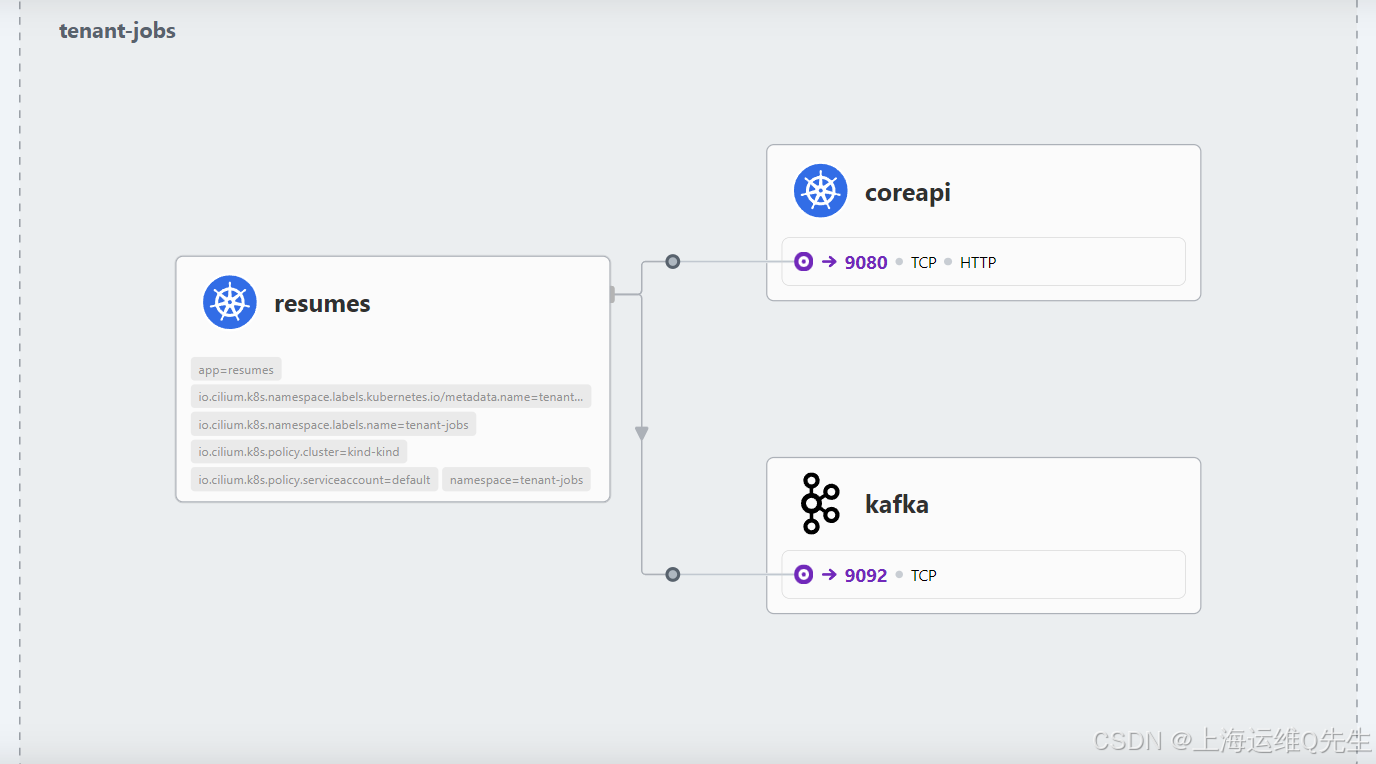
選擇 tenant-jobs 命名空間以可視化應用程序組件以及它們如何相互通信。
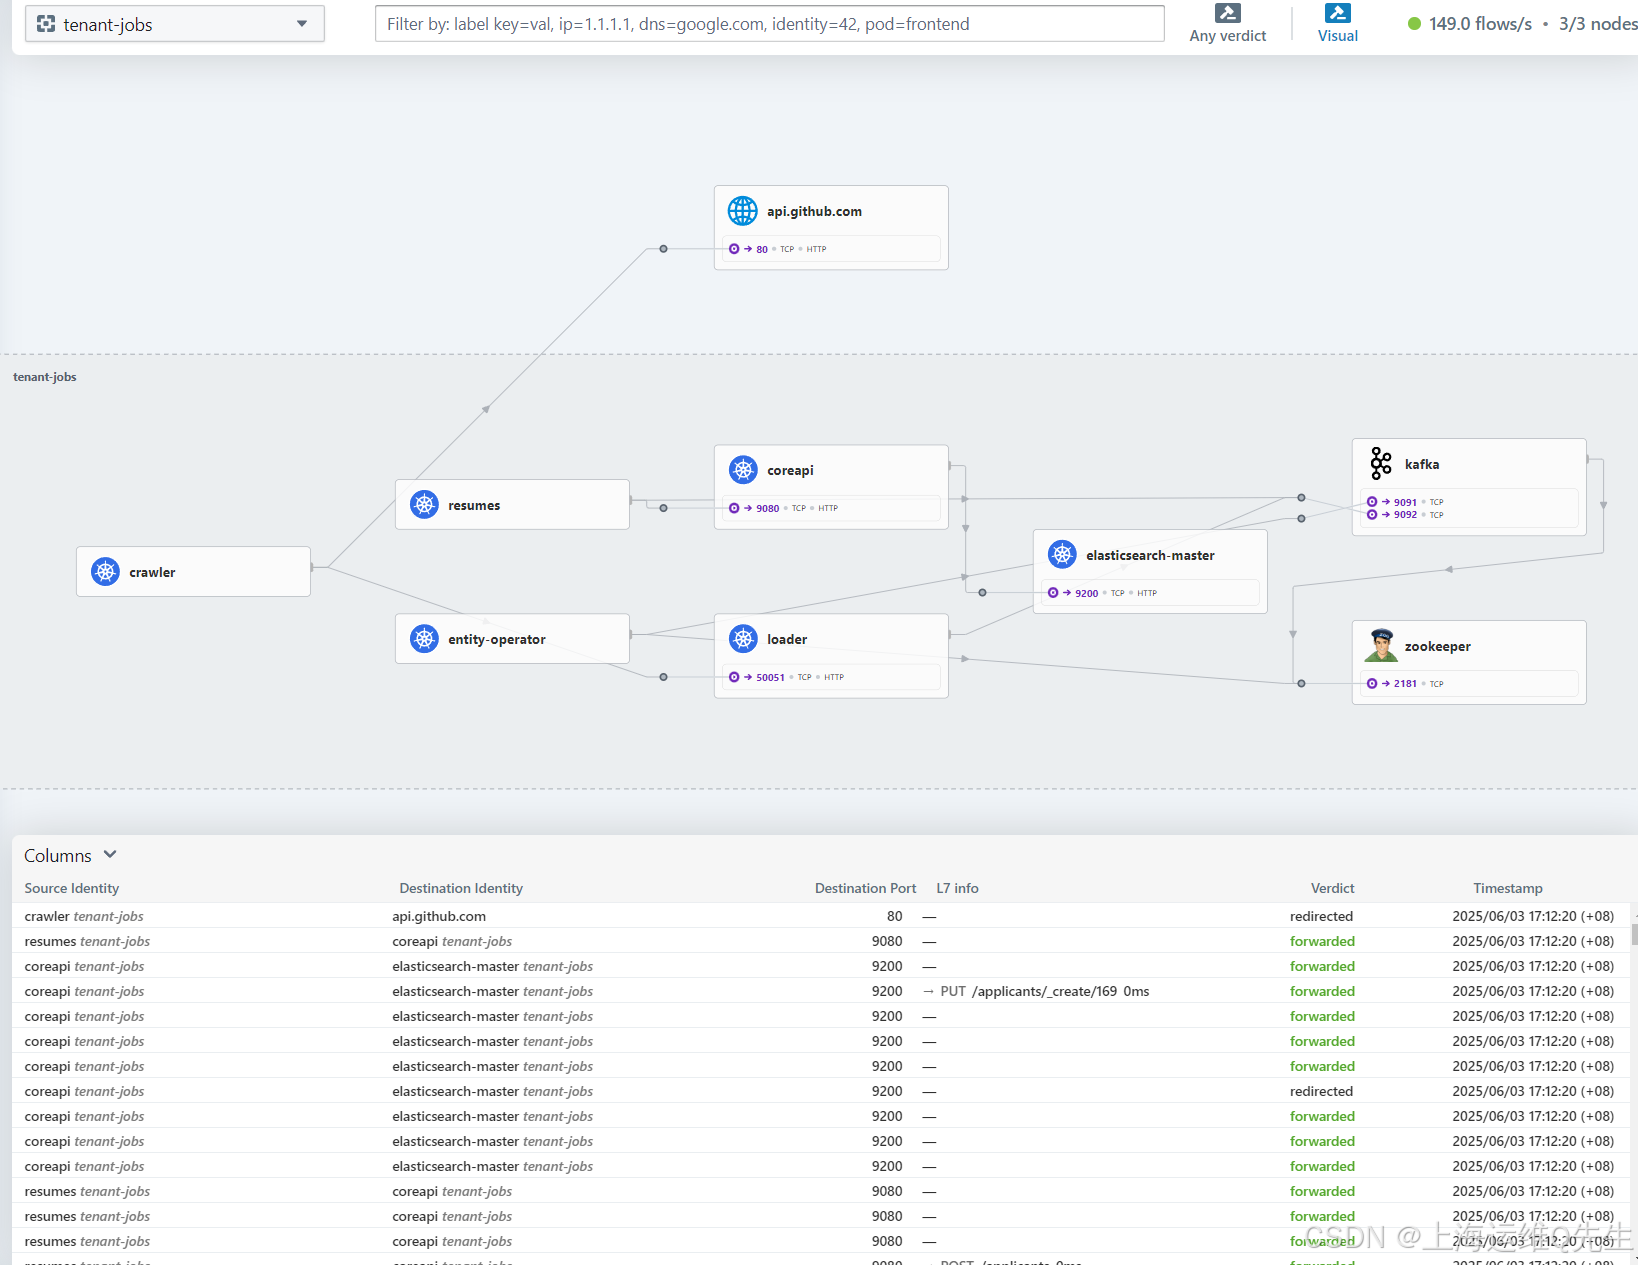
組件在相互通信時出現,因為 Hubble 顯示服務之間的實時流。
請注意,某些塊(例如 zookeeper)具有端口號,后跟 TCP,而其他塊則具有額外的 HTTP 標簽。這是因為該流量通過 Cilium 的 Envoy Proxy 進行重定向,用于第 7 層解析,從而提供應用層可觀察性。
例如,單擊 coreapi 塊。您將看到使用 HTTP 協議從 resumes 組件到端口 9080/TCP 的通信。該塊實際上顯示 /applications 路徑上的 resumes 應用程序正在使用 POST 方法訪問該服務:
我們之前描述的 l7-ingress-visibility Cilium 網絡策略強制通過 Envoy 代理在端口 9080/TCP 上傳輸入口流量,從而允許 Hubble 提供這些額外的數據。
3. Grafana 選項卡
3.1 Grafana 中的 Hubble L7 HTTP 指標
在本實驗中,我們設置了一個 Grafana 服務器,其數據源指向 Prometheus,并導入了 L7 HTTP 指標控制面板以可視化 Hubble 相關指標。
控制面板中的所有內容都使用 Hubble HTTP 指標,應用程序不需要任何插樁,也不需要向應用程序注入任何內容。
Incoming Requests by Source and Response Code 圖表應在 0.3 到 0.4 req/s 之間變化。
3.2 L7 Hubble 儀表板
導航儀表板。
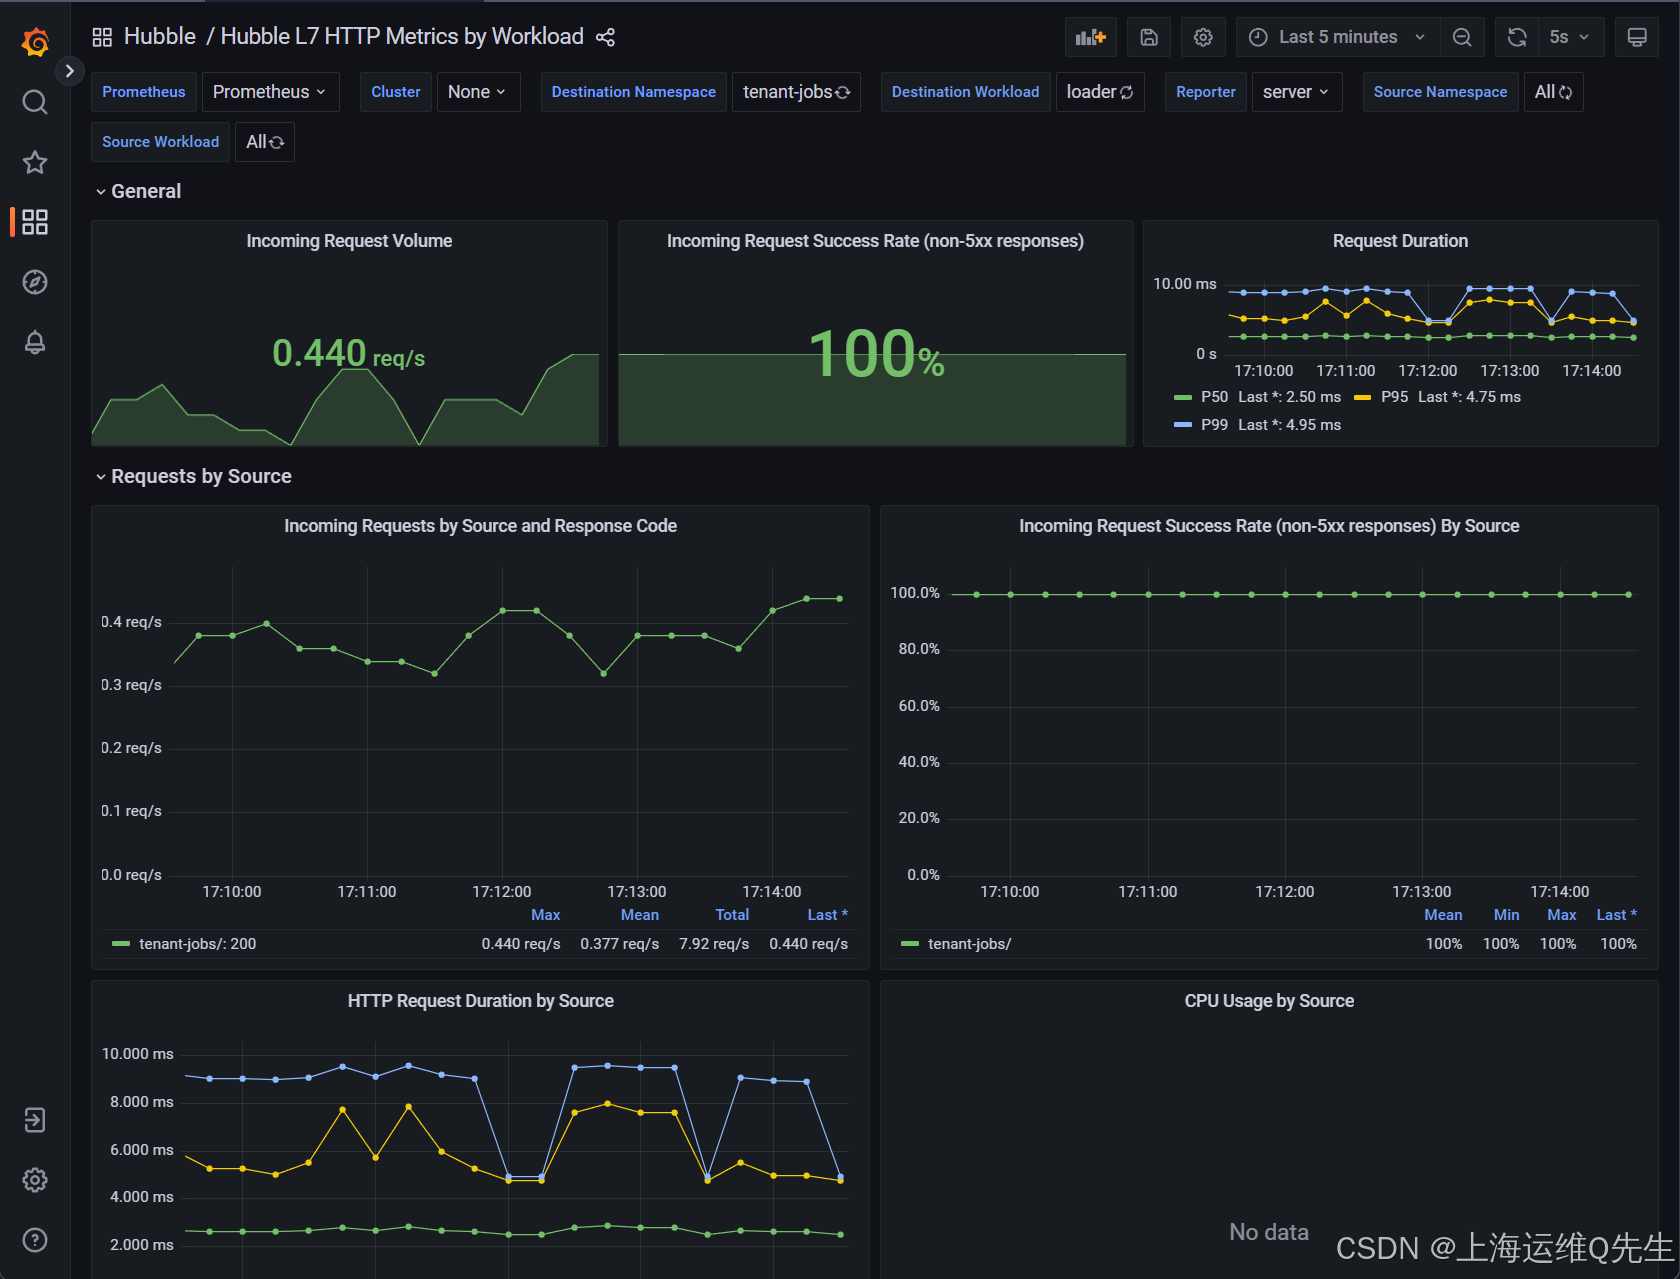
請注意您現在如何訪問各種 HTTP 指標:
- Incoming Request Volume
- Incoming Request Success Rate
- Request Duration
- Requests by Response Code
請注意如何按源查看指標(第二部分, 按來源劃分的請求 ,帶有三個面板)或按目標(第三部分, 按目標劃分的請求 ,具有三個面板)。這將使您能夠找到異常所在的位置。
在 Requests by Source 部分中,檢查 HTTP Request Duration by Source。請注意,有幾個可用的統計數據:P50、P95 和 P99。我們通常用第 99 個百分位或 P99 來描述延遲。
如果我們基于 HTTP 的 Web 應用程序的 P99 延遲小于或等于 2 毫秒,則意味著 99% 的 Web 調用的響應時間低于 2 毫秒。相反,只有 1% 的調用獲得超過 2 毫秒的延遲響應。
4. 吞吐量
4.1 提高請求速率
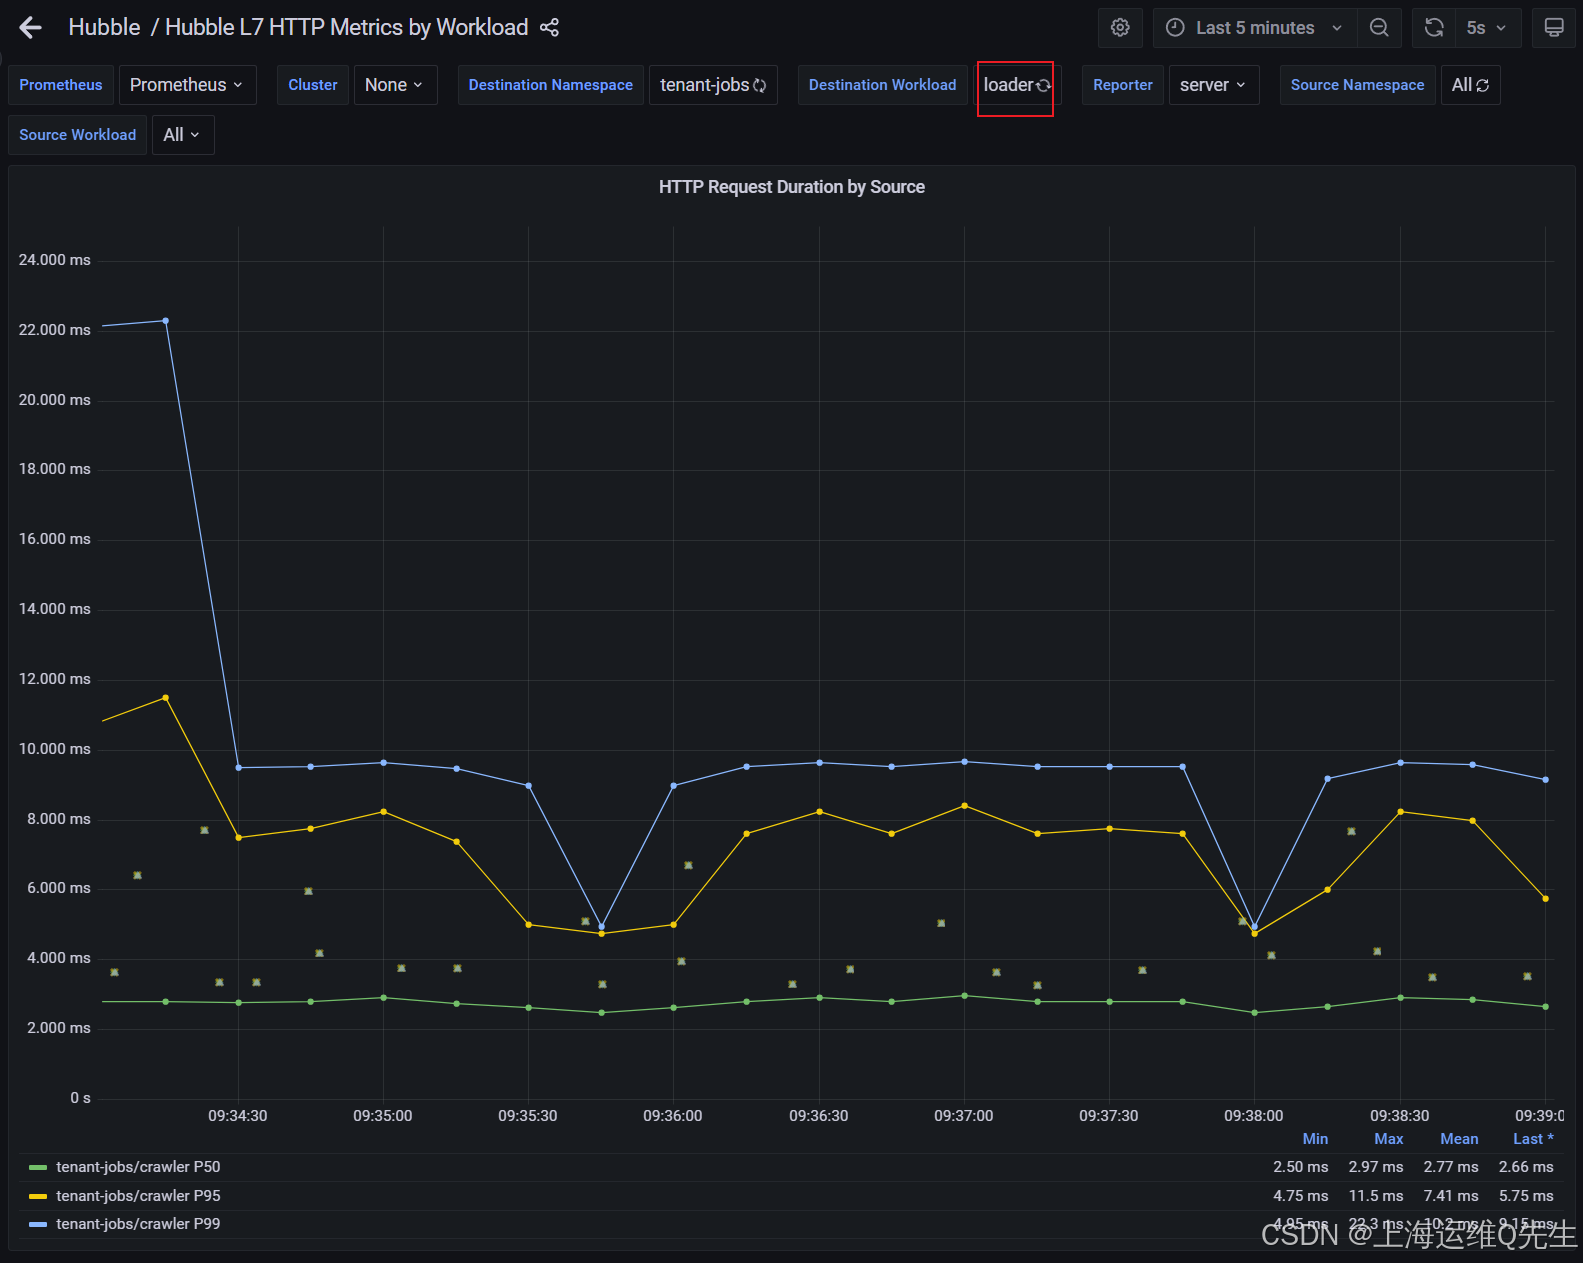
找到頁面頂部的 Destination Workload 變量,并確保已選擇 loader。
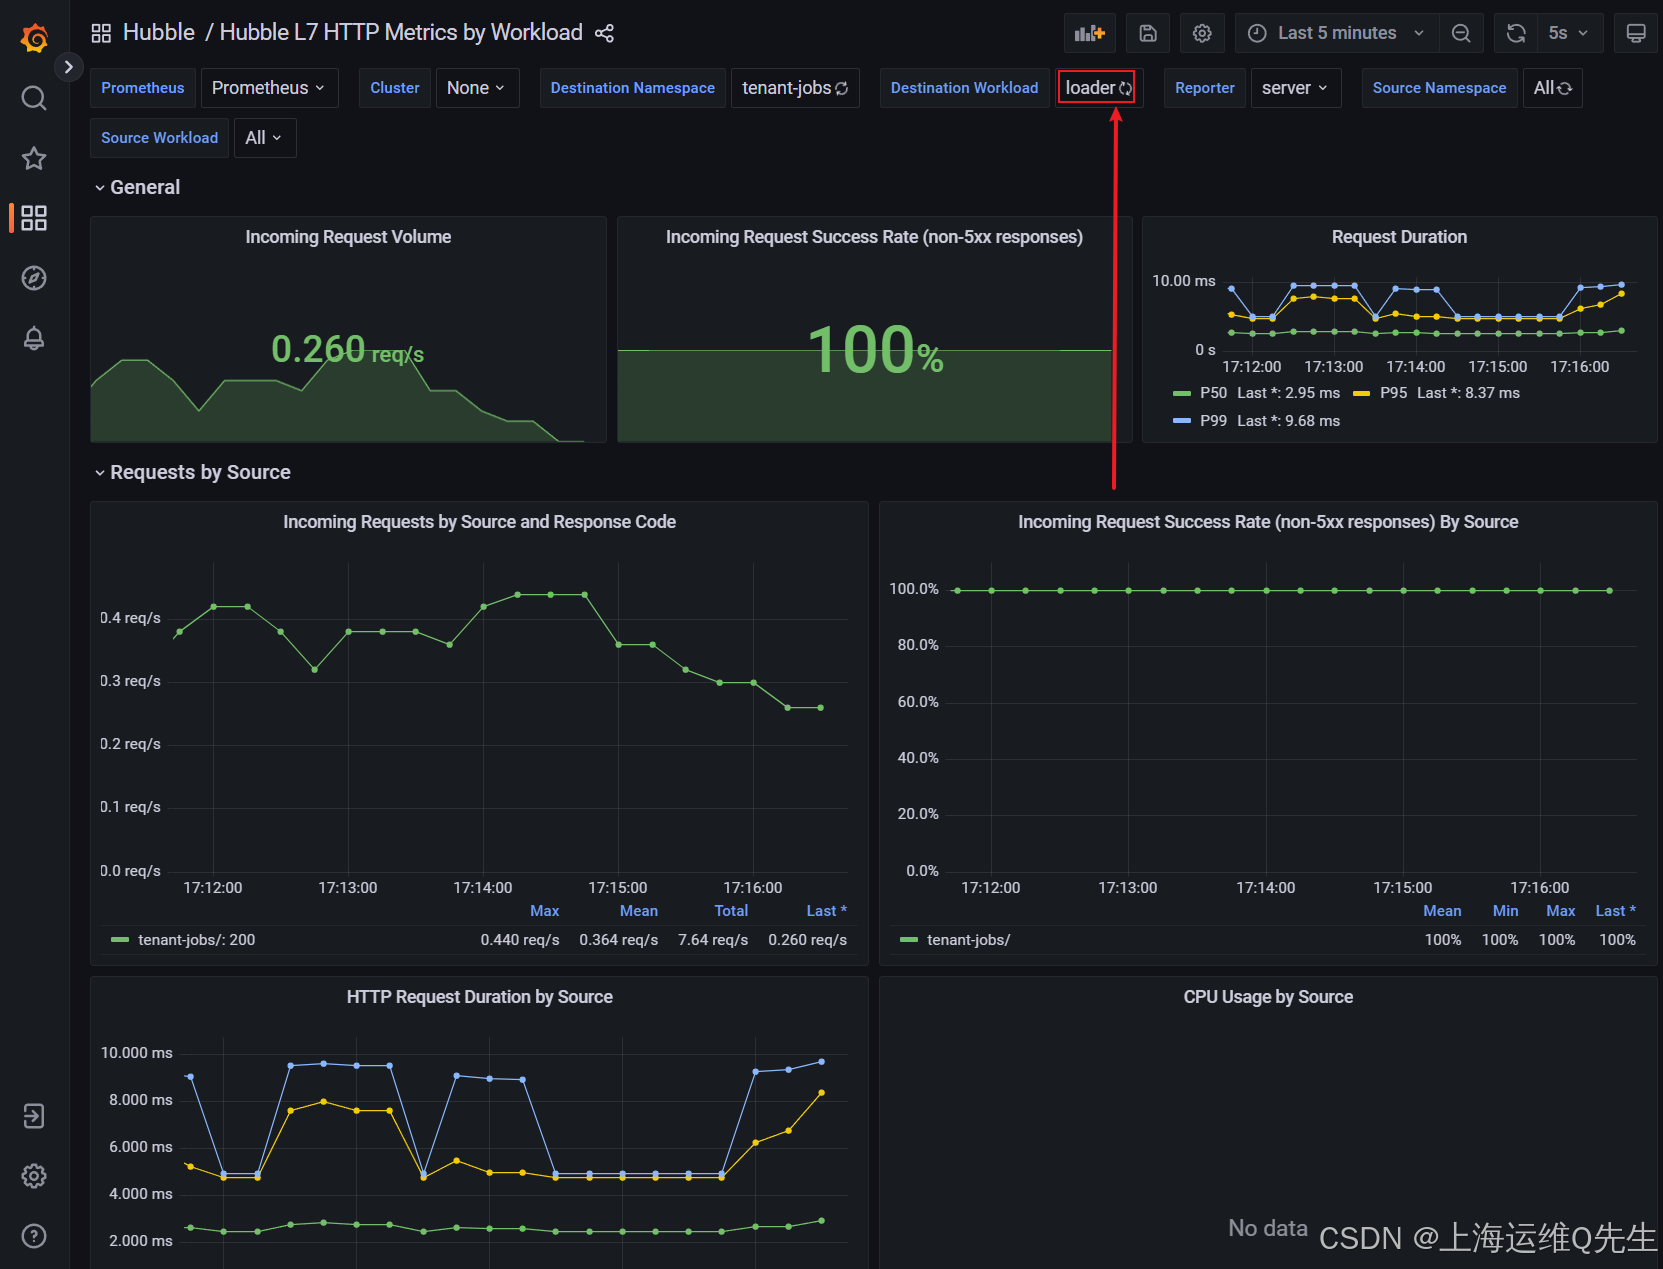
接下來,通過配置crawler以生成更多簡歷,并運行crawler和resumes的更多副本來增加請求量 部署。
運行:
helm upgrade jobs-app ./helm/jobs-app.tgz \--namespace tenant-jobs \--reuse-values \--set crawler.replicas=3 \--set crawler.crawlFrequencyLowerBound=0.2 \--set crawler.crawlFrequencyUpperBound=0.5 \--set resumes.replicas=2
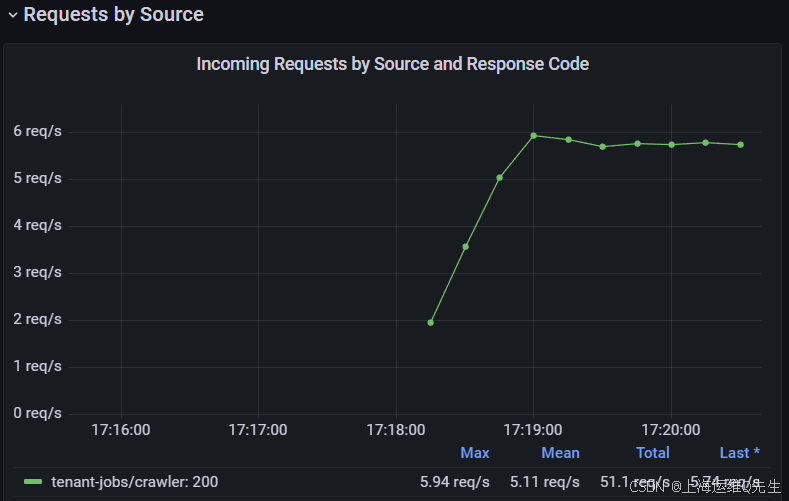
觀察 Incoming Requests by Source and Response Code 面板。當爬網程序向加載程序提交簡歷時,您應該會看到請求速率增加,因為爬網程序的簡歷生成速率增加。速率應穩定在 3 req/s 左右。
現在,選擇 coreapi 作為頁面頂部的 Destination Workload 變量。
在 Incoming Requests by Source and Response Code 視圖中,您還應該看到 coreapi 的請求速率增加。速率應穩定在 6 req/s 左右。
5. 增加錯誤率
讓我們部署一個新的 jobs-app 配置,并使用我們的指標來查看請求錯誤率的變化。
helm upgrade jobs-app ./helm/jobs-app.tgz \--namespace tenant-jobs \--reuse-values \--set coreapi.errorRate=0.5 \--set coreapi.sleepRate=0.01
確保選擇 coreapi 作為 Destination Workload。
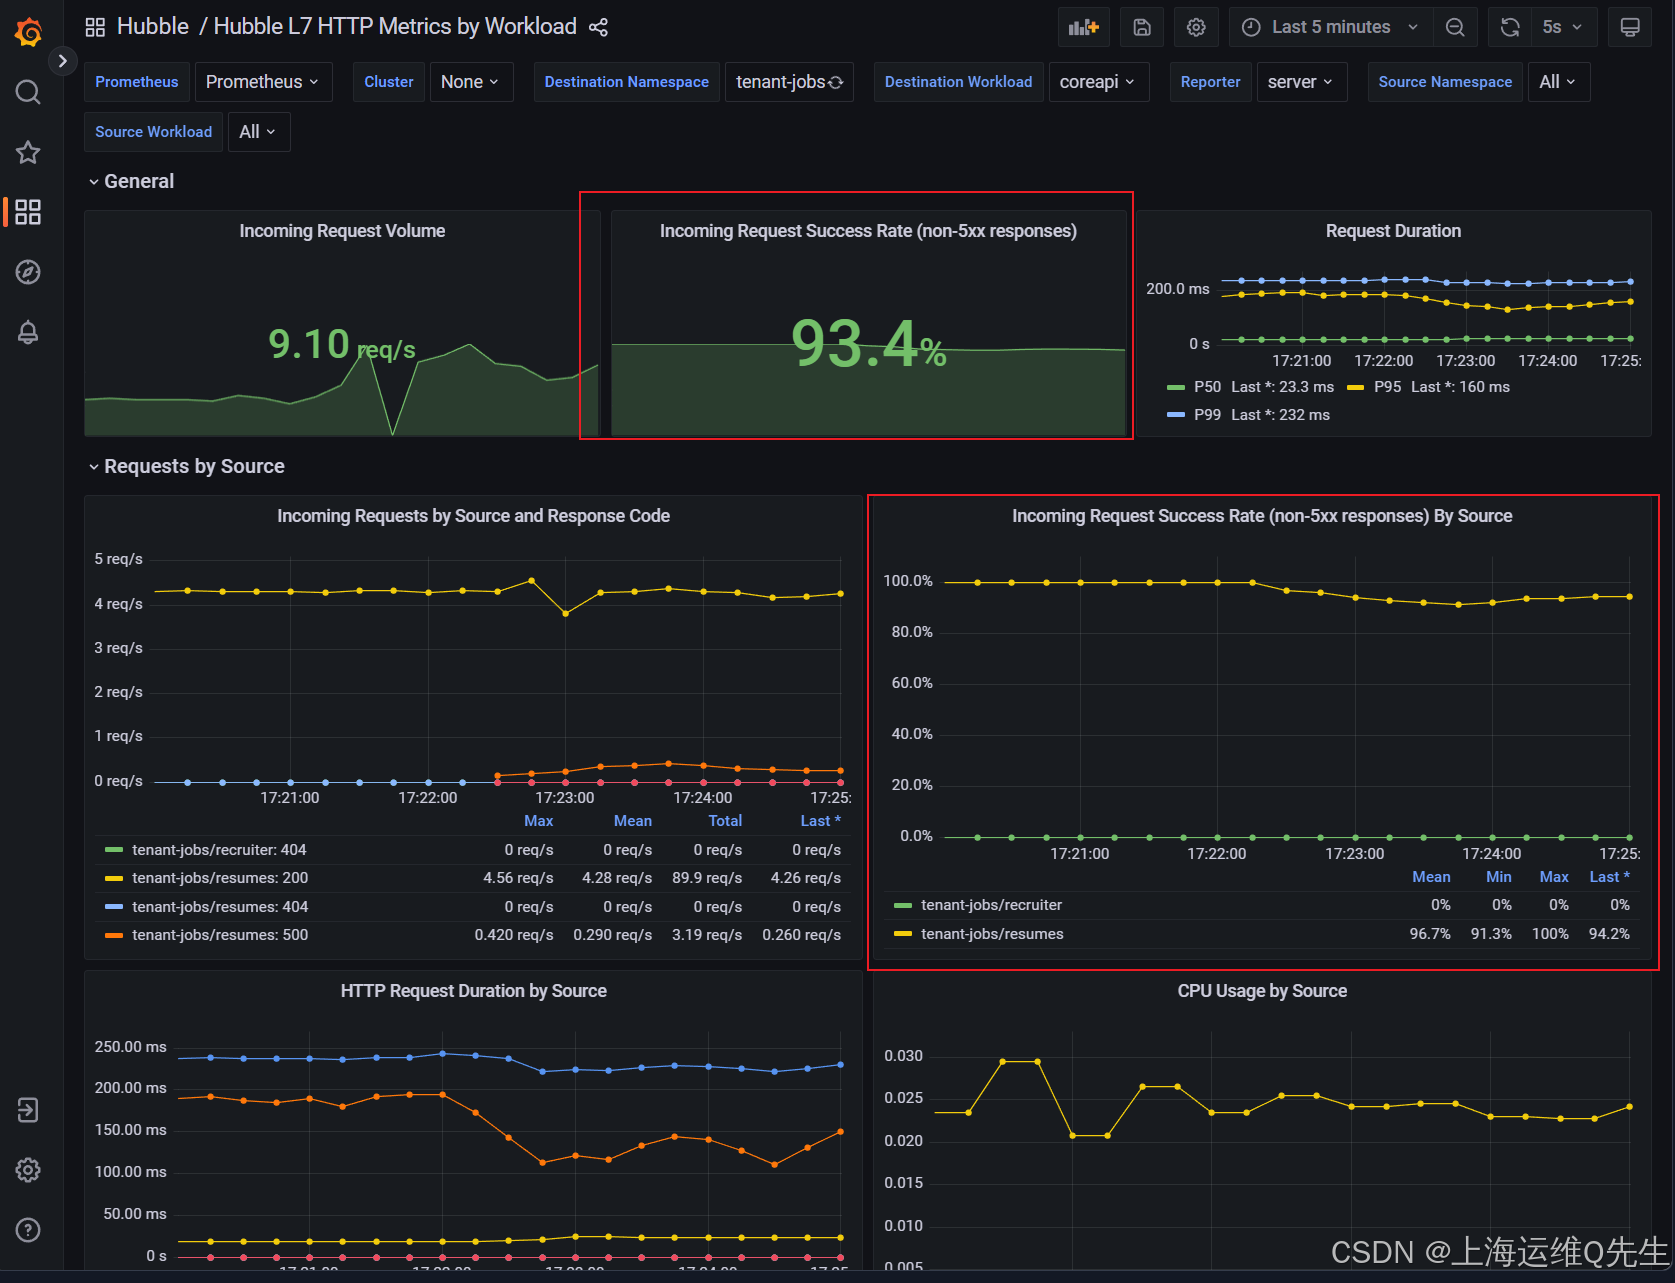
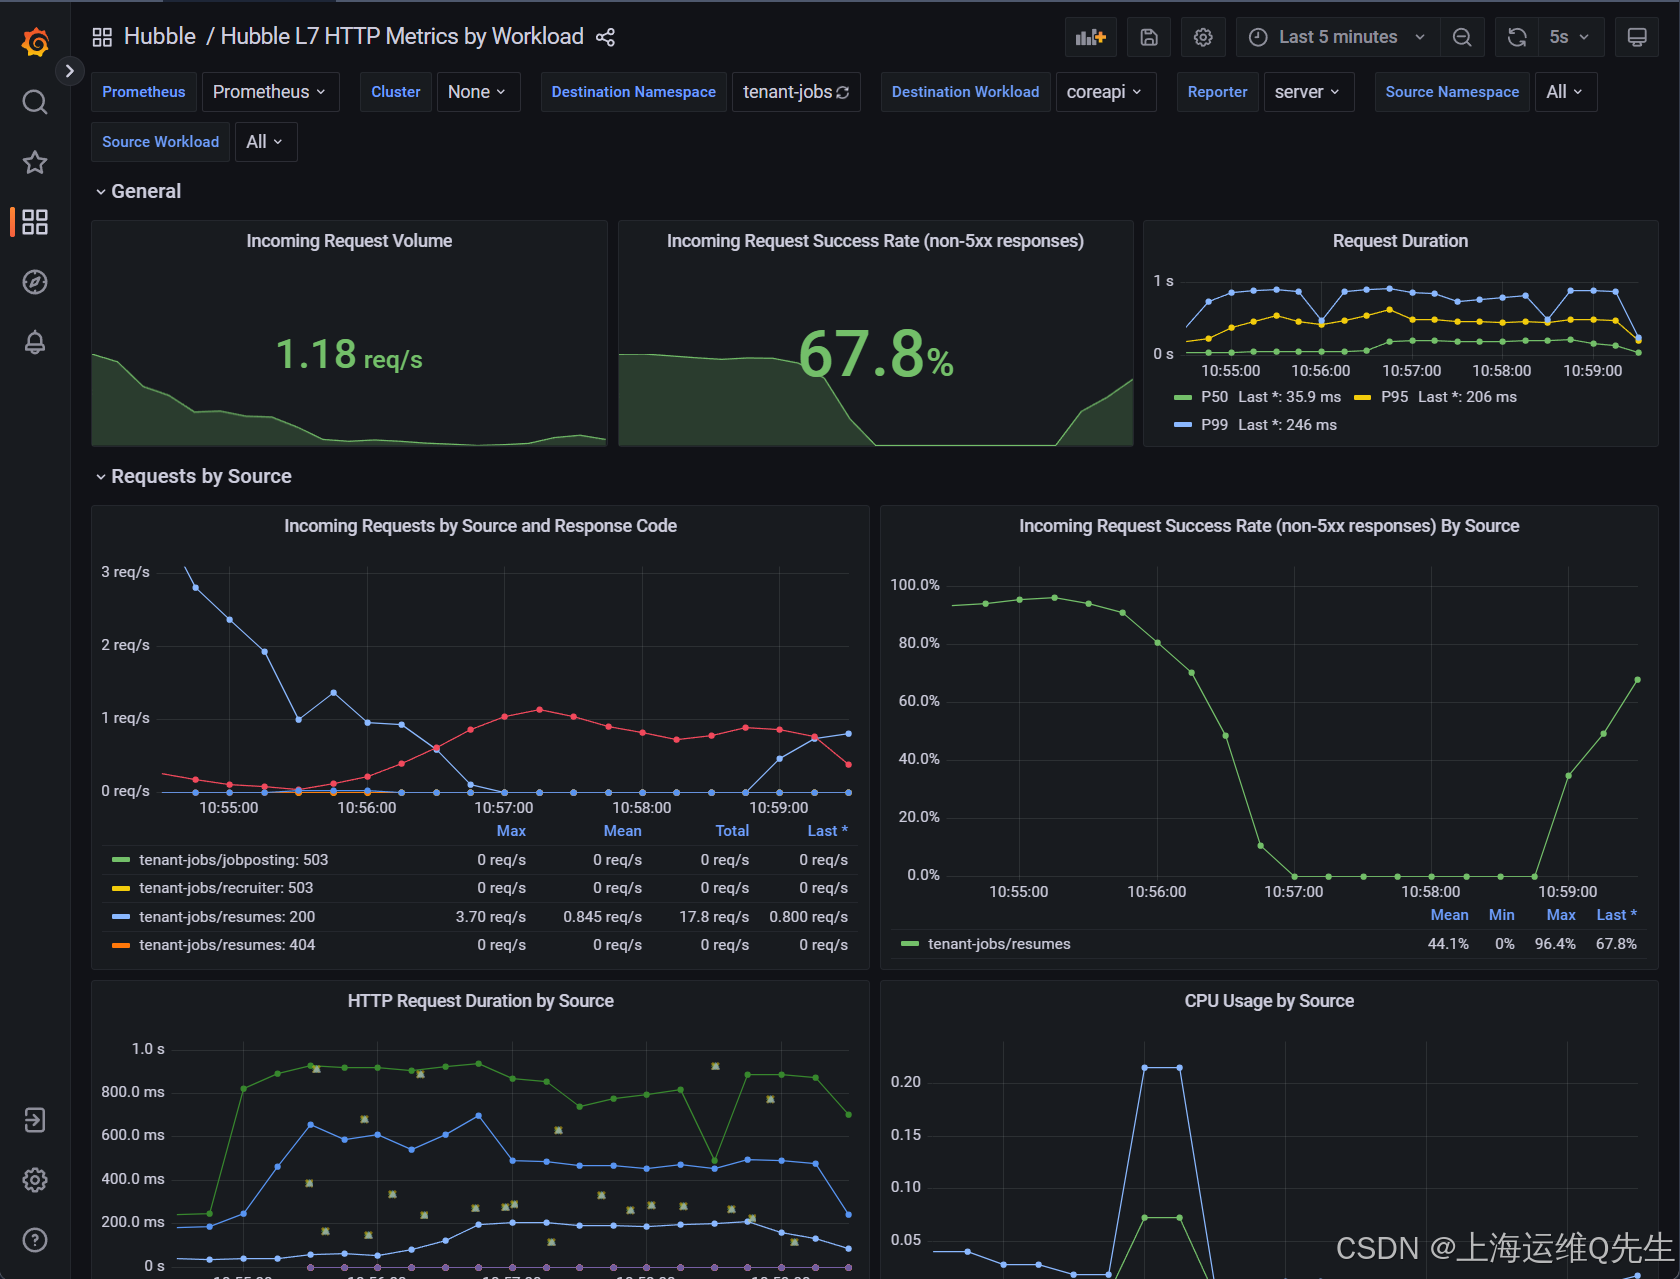
大約一分鐘后,您將看到 Incoming Request Success Rate (non-5xx responses) By Source (按源) 圖表開始下降。
最后,Incoming Request Success Rate (non-5xx responses) 面板應穩定在 93% 左右。
6. 延遲
6.1 增加請求持續時間
接下來,我們將升級 jobs-app 設置以增加響應之間的睡眠時間,從而延長請求持續時間。
運行:
helm upgrade jobs-app ./helm/jobs-app.tgz \--namespace tenant-jobs \--reuse-values \--set coreapi.sleepRate=0.2 \--set coreapi.sleepLowerBound=0.5 \--set coreapi.sleepUpperBound=5.0
并選擇 coreapi 作為 Destination Workload。
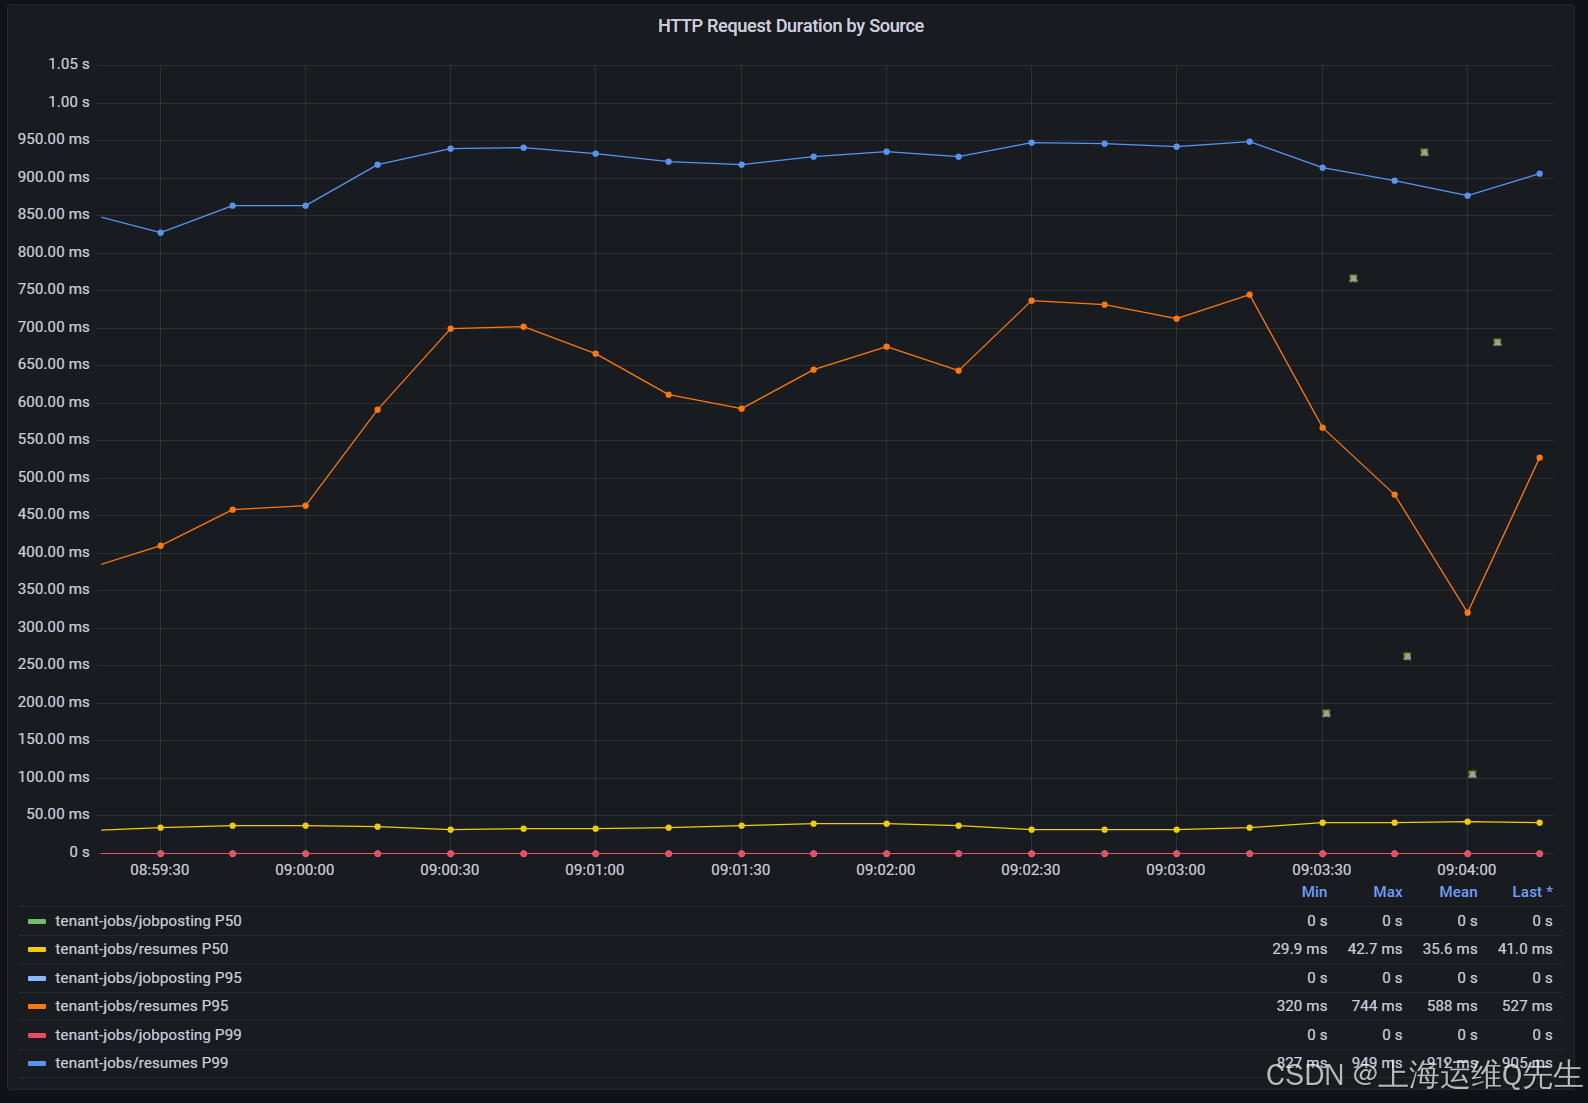
大約一分鐘后,您將看到 HTTP Request Duration by Source (按源劃分的 HTTP 請求持續時間 ) 圖表中的值增加到 800 毫秒左右。
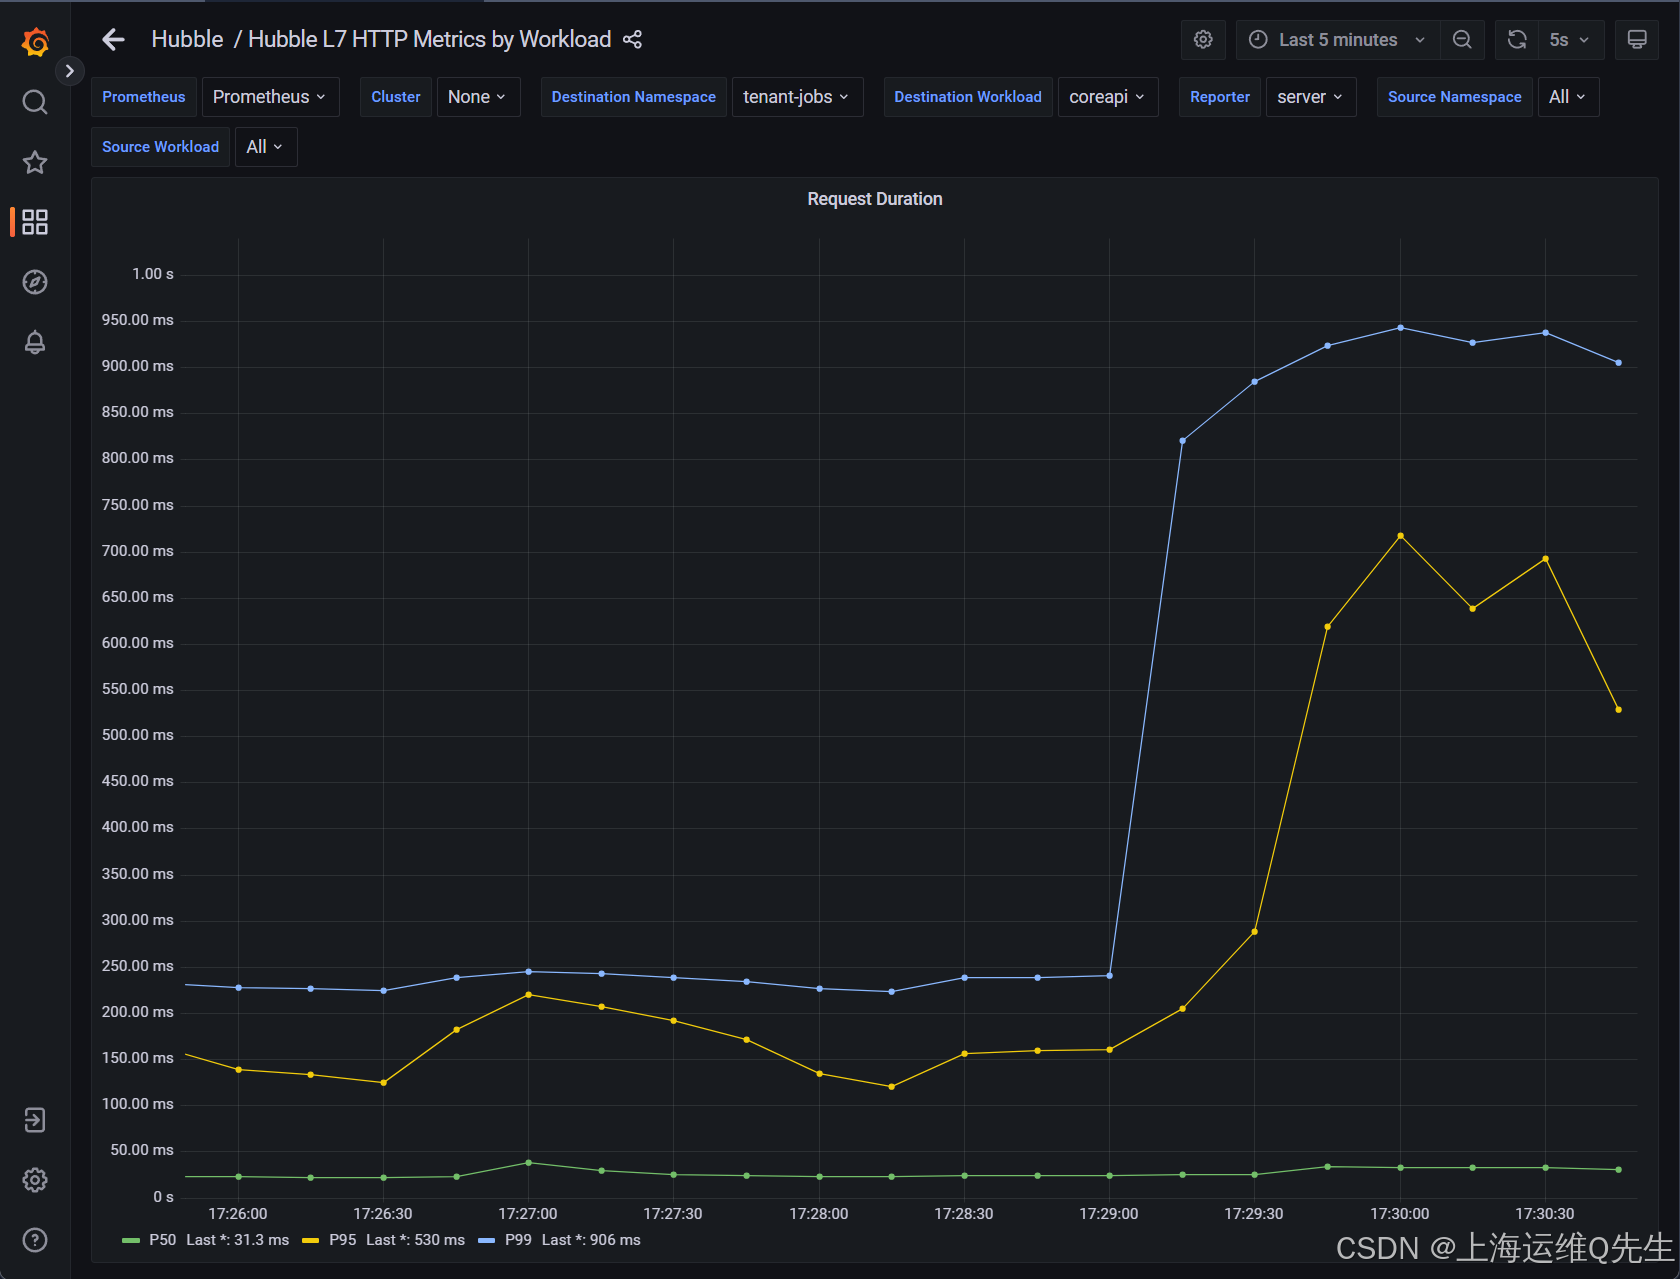
請注意,P50、P95 和 P99 的三條曲線具有截然不同的值。這意味著延遲會增加,但僅限于一小部分請求。
例如,上面的屏幕截圖顯示,雖然 99% 的請求的延遲低于 ~1 秒(P99 曲線),但其中 95% 的請求延遲低于 600 毫秒(P95 曲線),其中 50% 的請求速度要快得多(P50 曲線)。
單擊圖形下的 tenant-jobs/resumes P50 標簽,僅查看以下值:
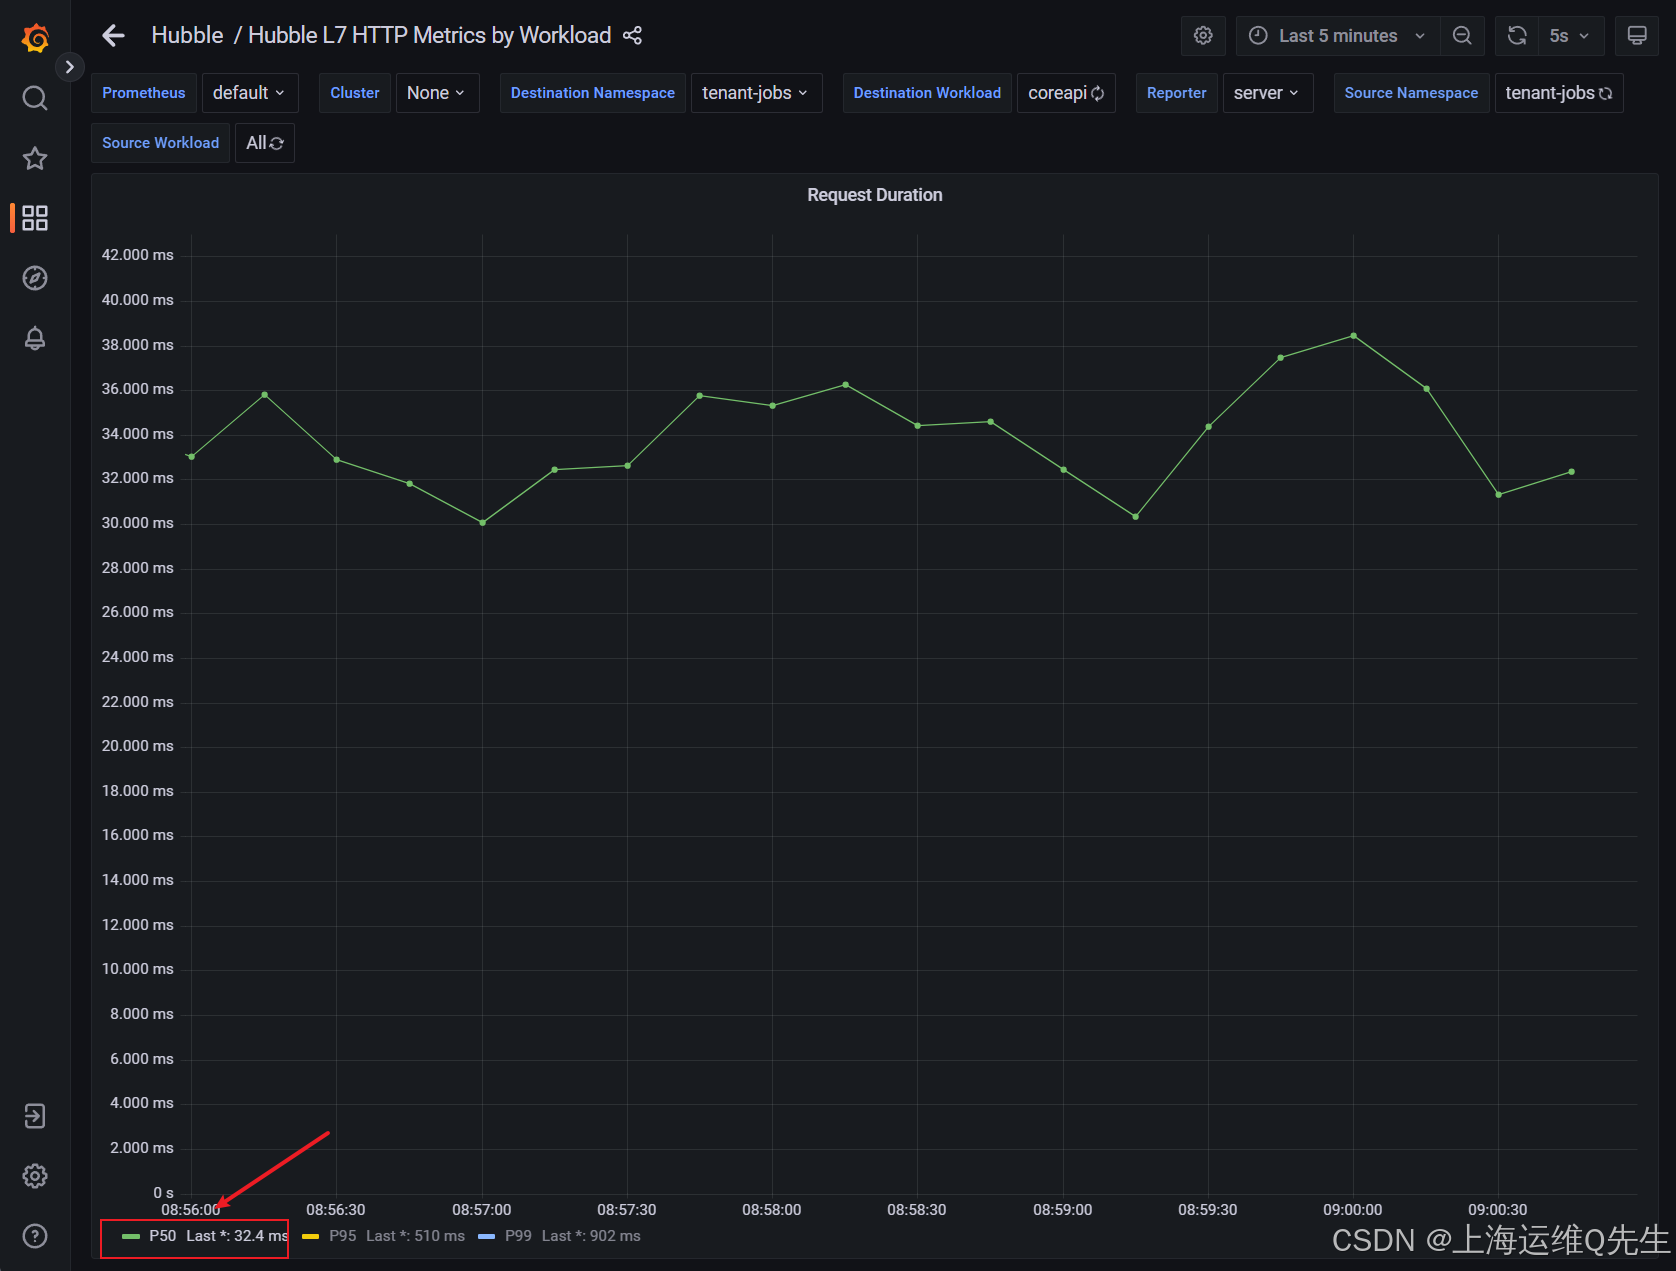
您可以看到 50% 的請求實際上需要 ~30 毫秒才能得到處理。
檢查圖表圖例中每個序列的最小值、最大值和平均值。這對于識別延遲問題非常有用。
7. 跟蹤集成
7.1 介紹
Grafana Tempo 以及 OpenTelemetry Operator 和 Collector 已添加到集群中。
升級 jobs-app 設置以啟用 OpenTelemetry 跟蹤。
運行:
helm upgrade jobs-app ./helm/jobs-app.tgz \--namespace tenant-jobs \--reuse-values \--set tracing.enabled=true
這將使應用程序生成 OpenTelemetry 跟蹤。
當 Cilium 的 Envoy 代理處理第 7 層數據時,Hubble 將能夠從 HTTP 標頭中提取 Trace ID,并將它們與 Hubble 的數據相關聯,以豐富 Grafana 儀表板。
7.2 Grafana 中的痕跡
選擇 coreapi 作為 Destination Workload(目標工作負載 )。
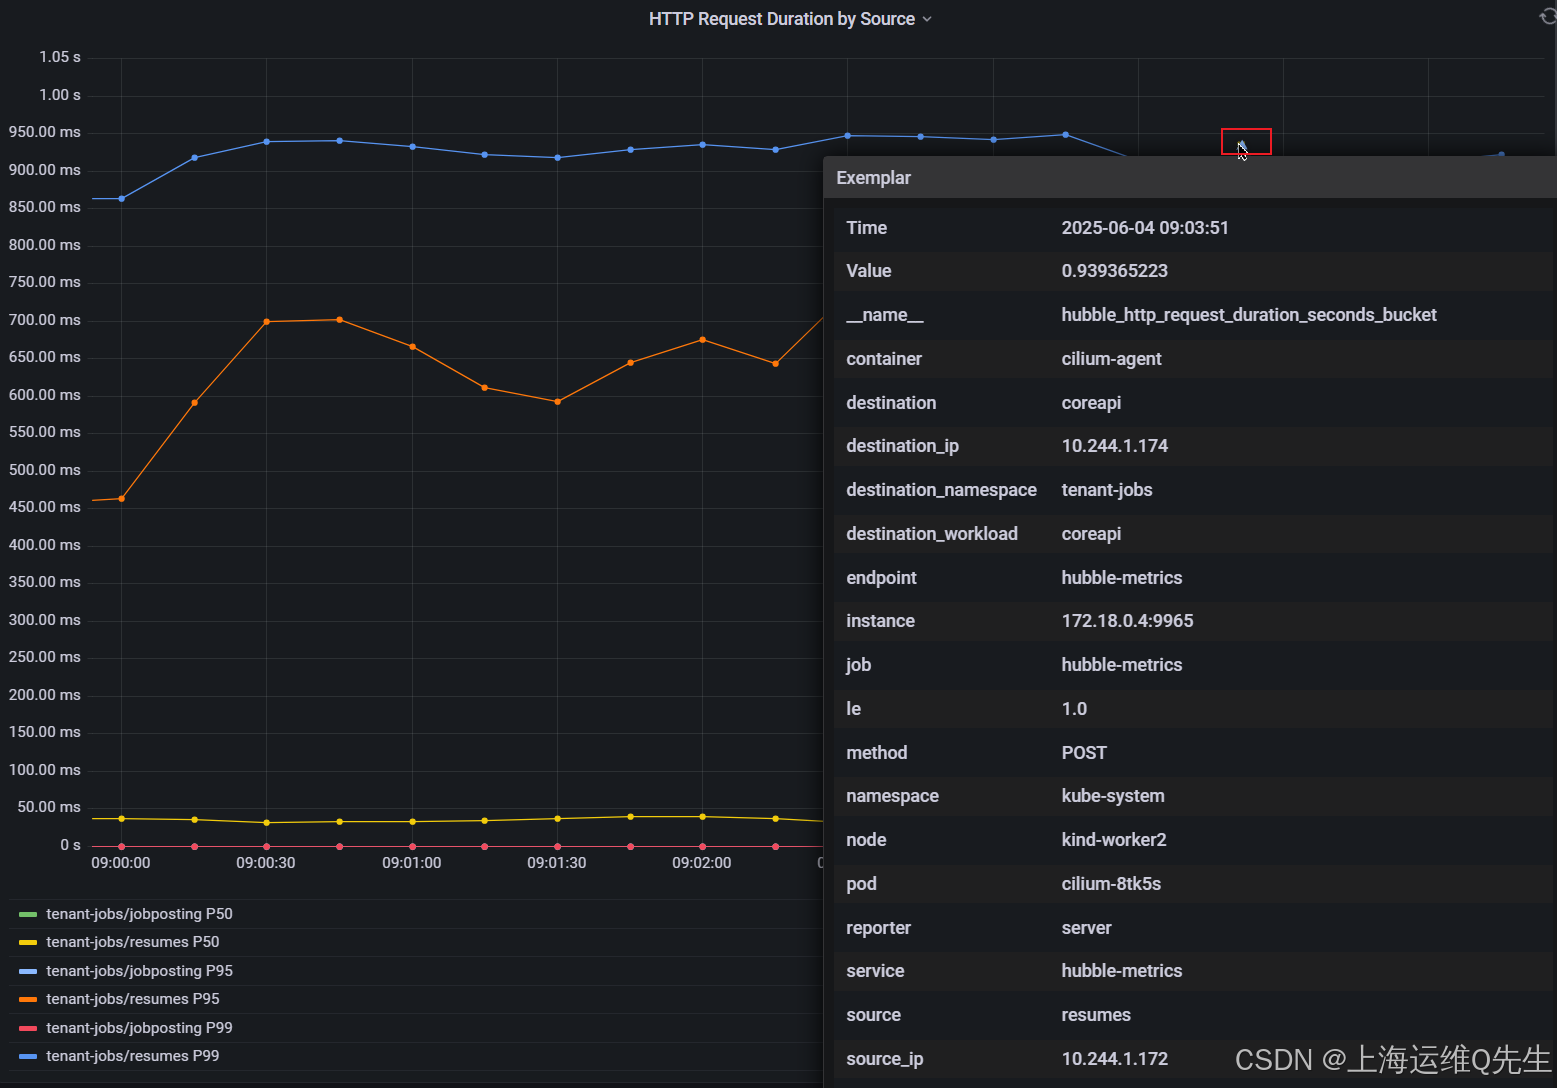
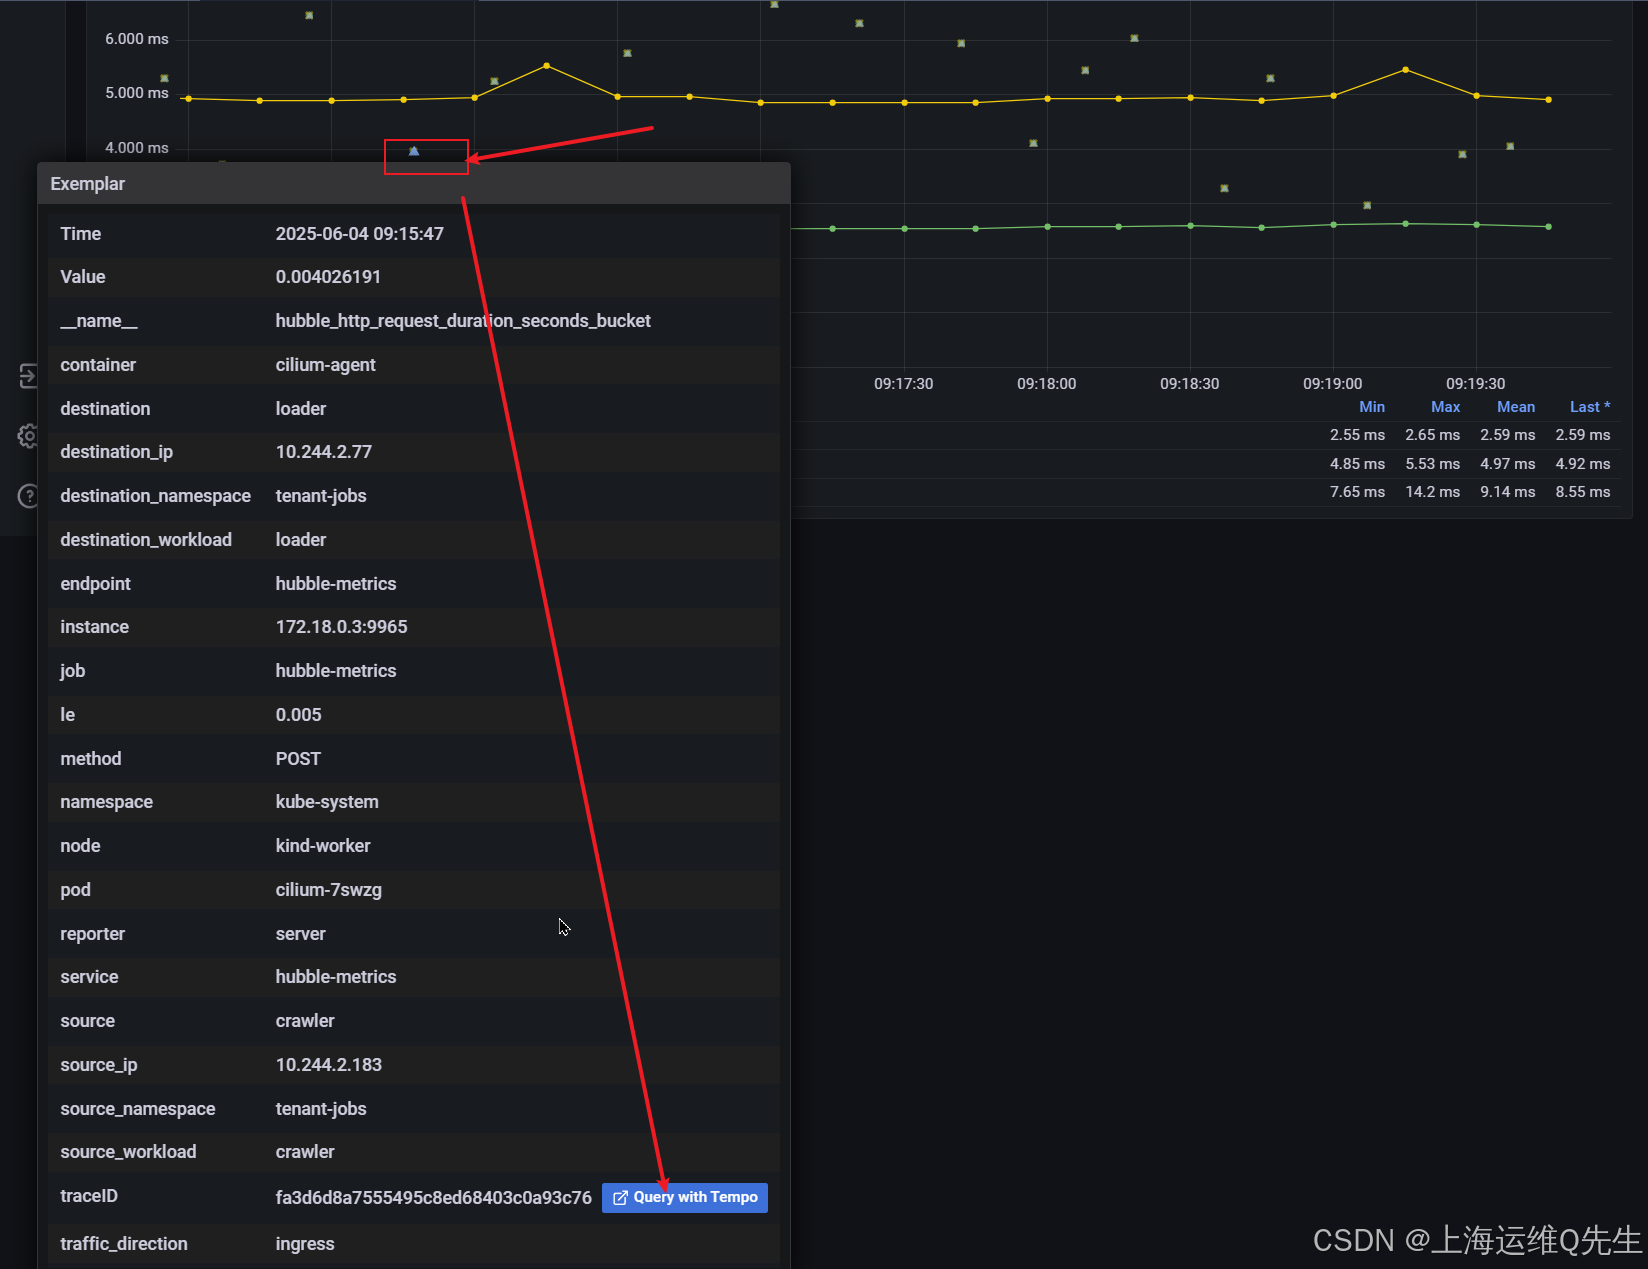
在 HTTP Request Duration by Source/Destination 面板中,您應該開始看到示例顯示為點,并位于折線圖可視化圖表旁邊。
這些示例中的每個示例都表示單個請求的持續時間,并鏈接到跟蹤 ID。
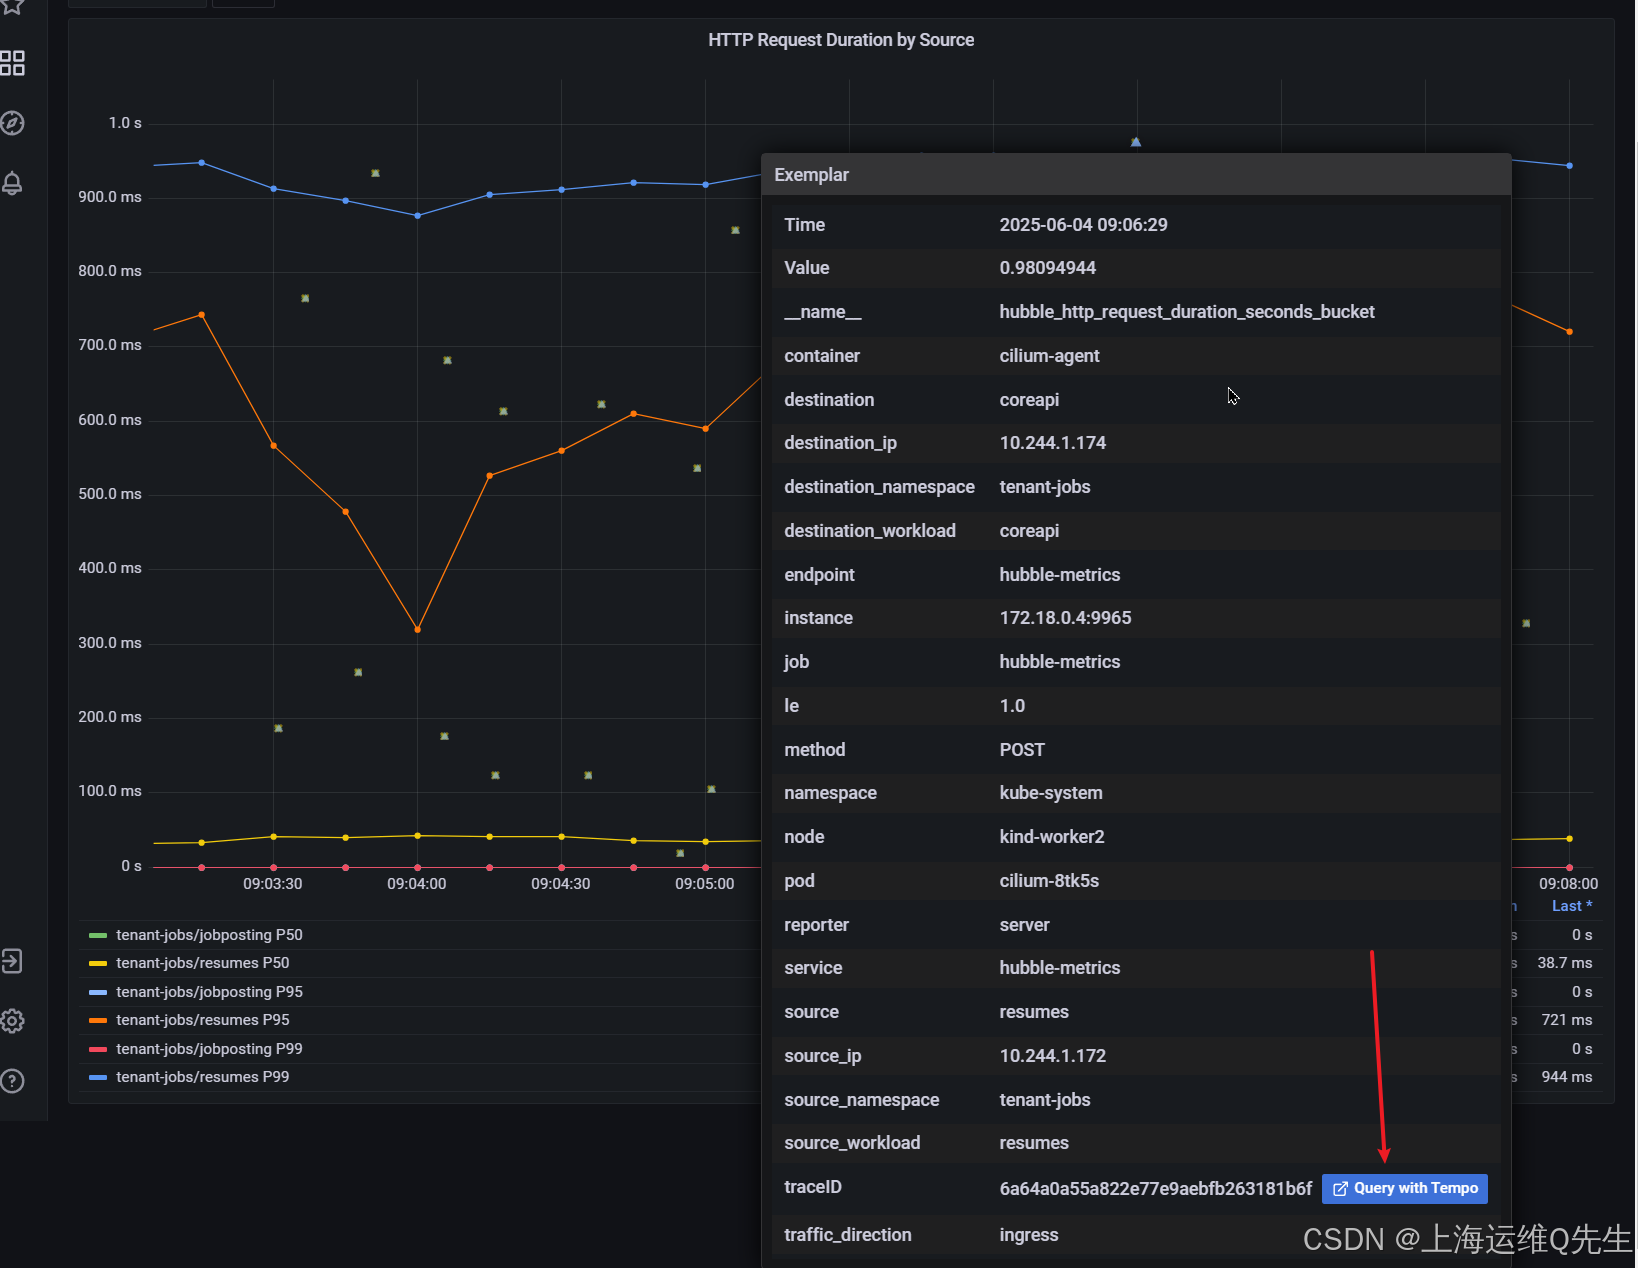
您可以通過將鼠標懸停在點上來查看跟蹤詳細信息。選擇圖表頂部的跟蹤點。檢查詳細信息。
7.3 訪問 Tempo
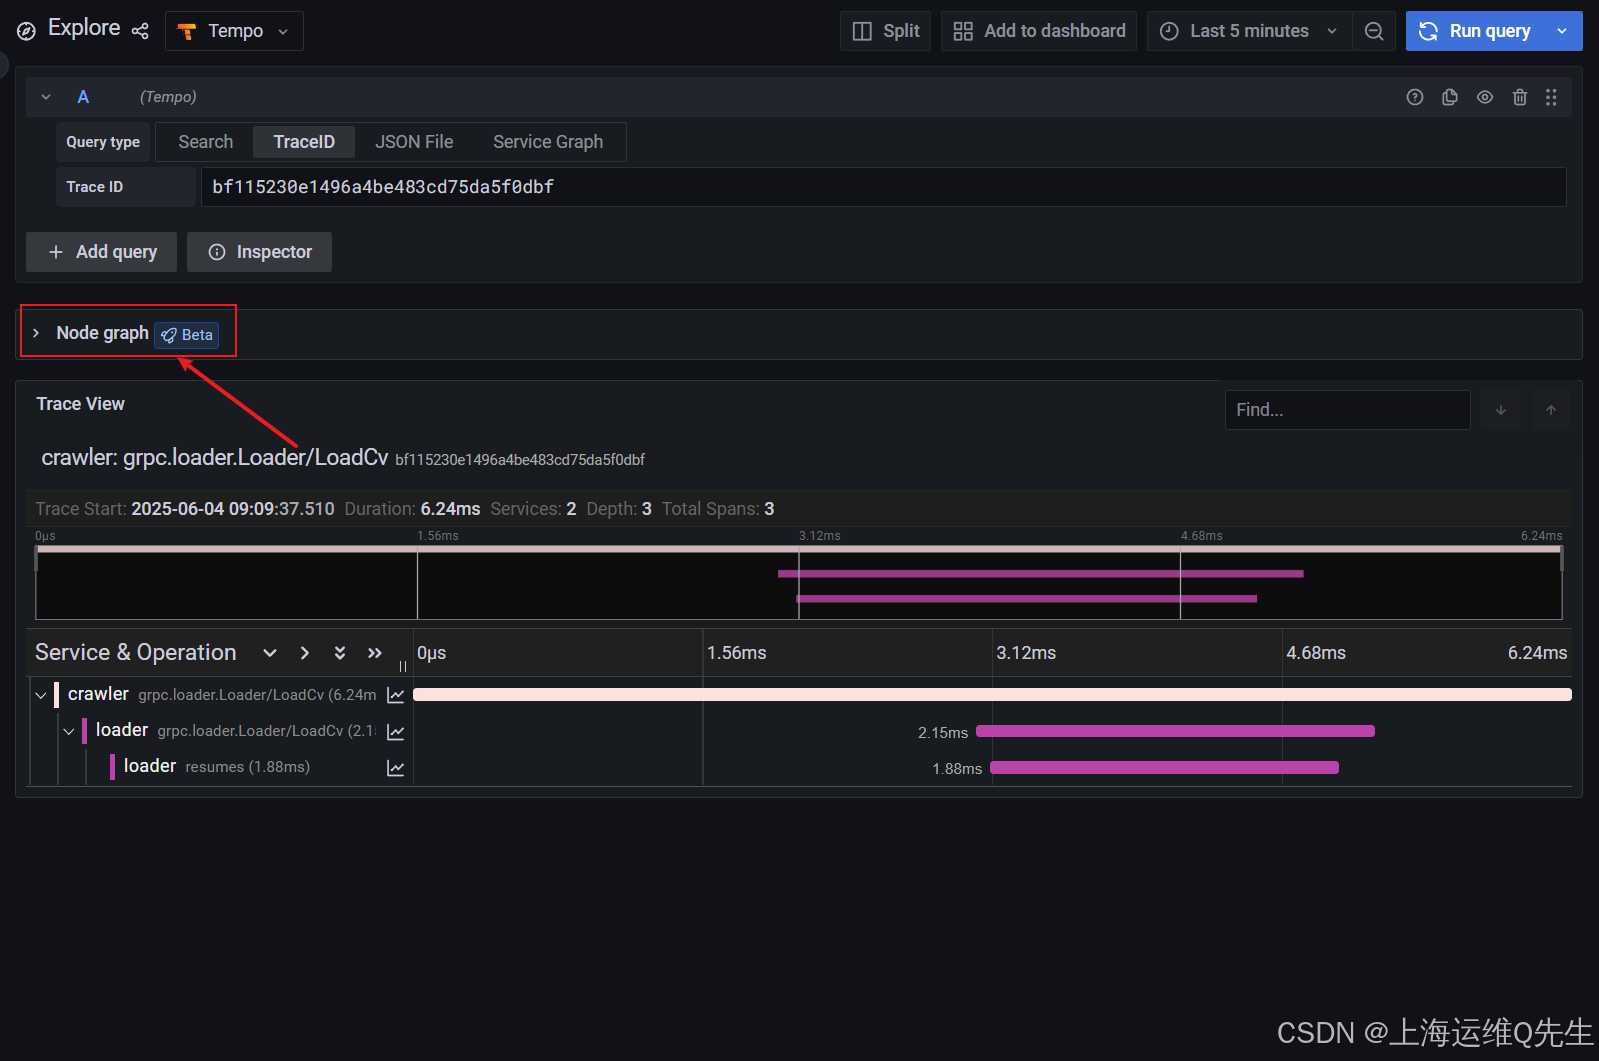
接下來,單擊彈出窗口底部的 “Query with Tempo” 按鈕。這將允許您可視化應用程序的 OpenTelemetry 跟蹤。
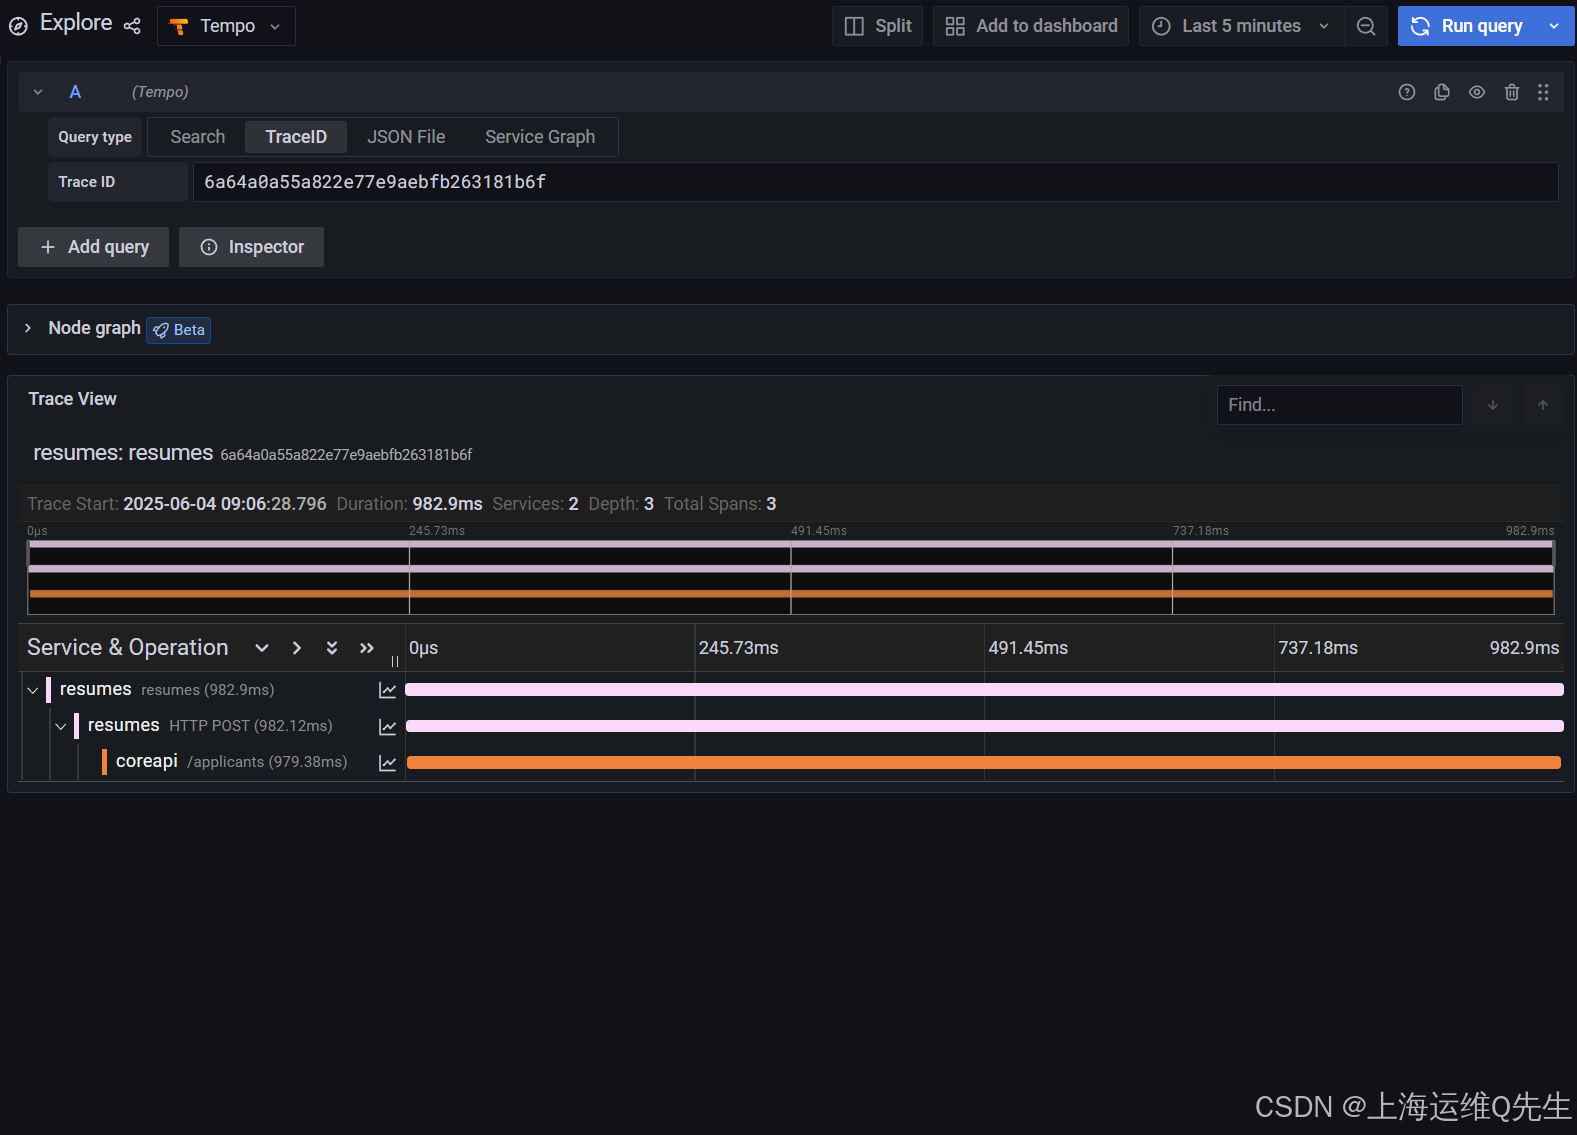
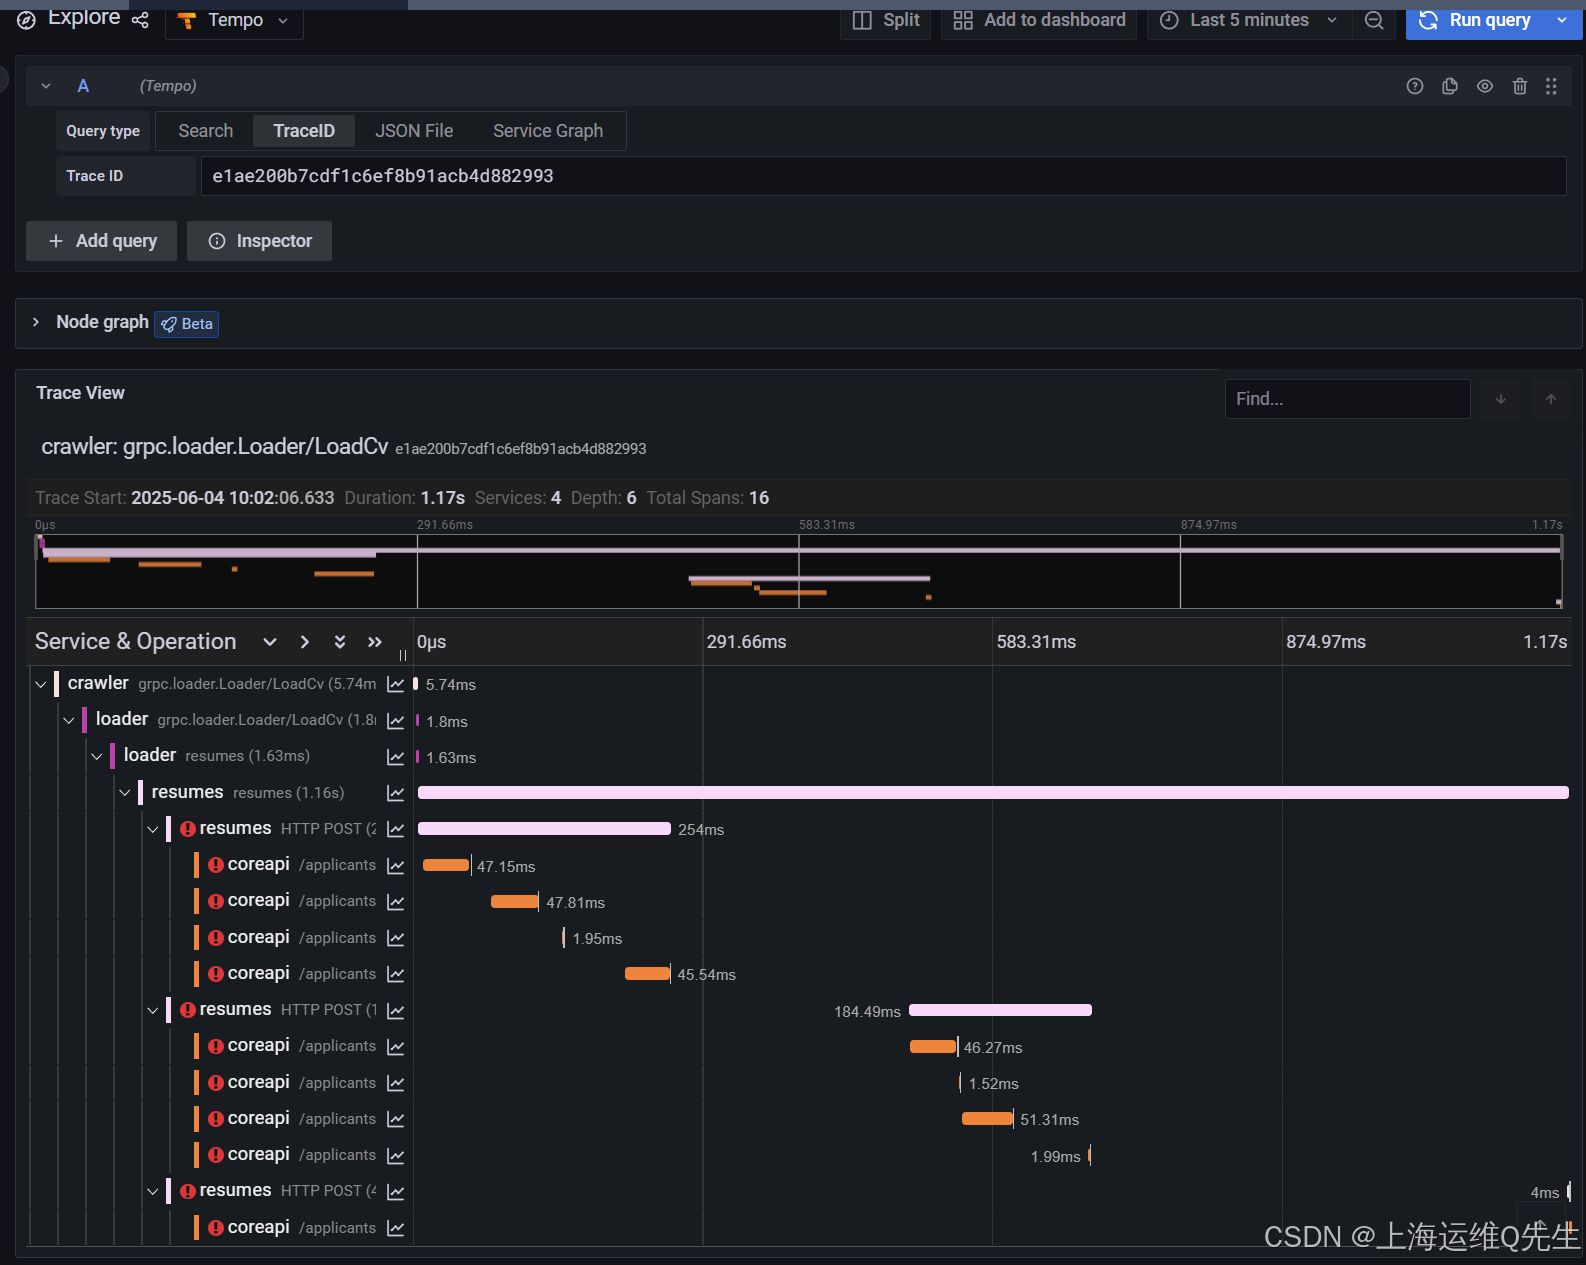
請注意, 加載程序請求的末尾(第 3 行,帶有深粉色標記)和簡歷回復的開頭(第 4 行,帶有非常淺的粉紅色標記)之間有一個長空格。這解釋了為什么此請求具有較高的延遲(這是因為您從圖表頂部選擇了一個示例)。
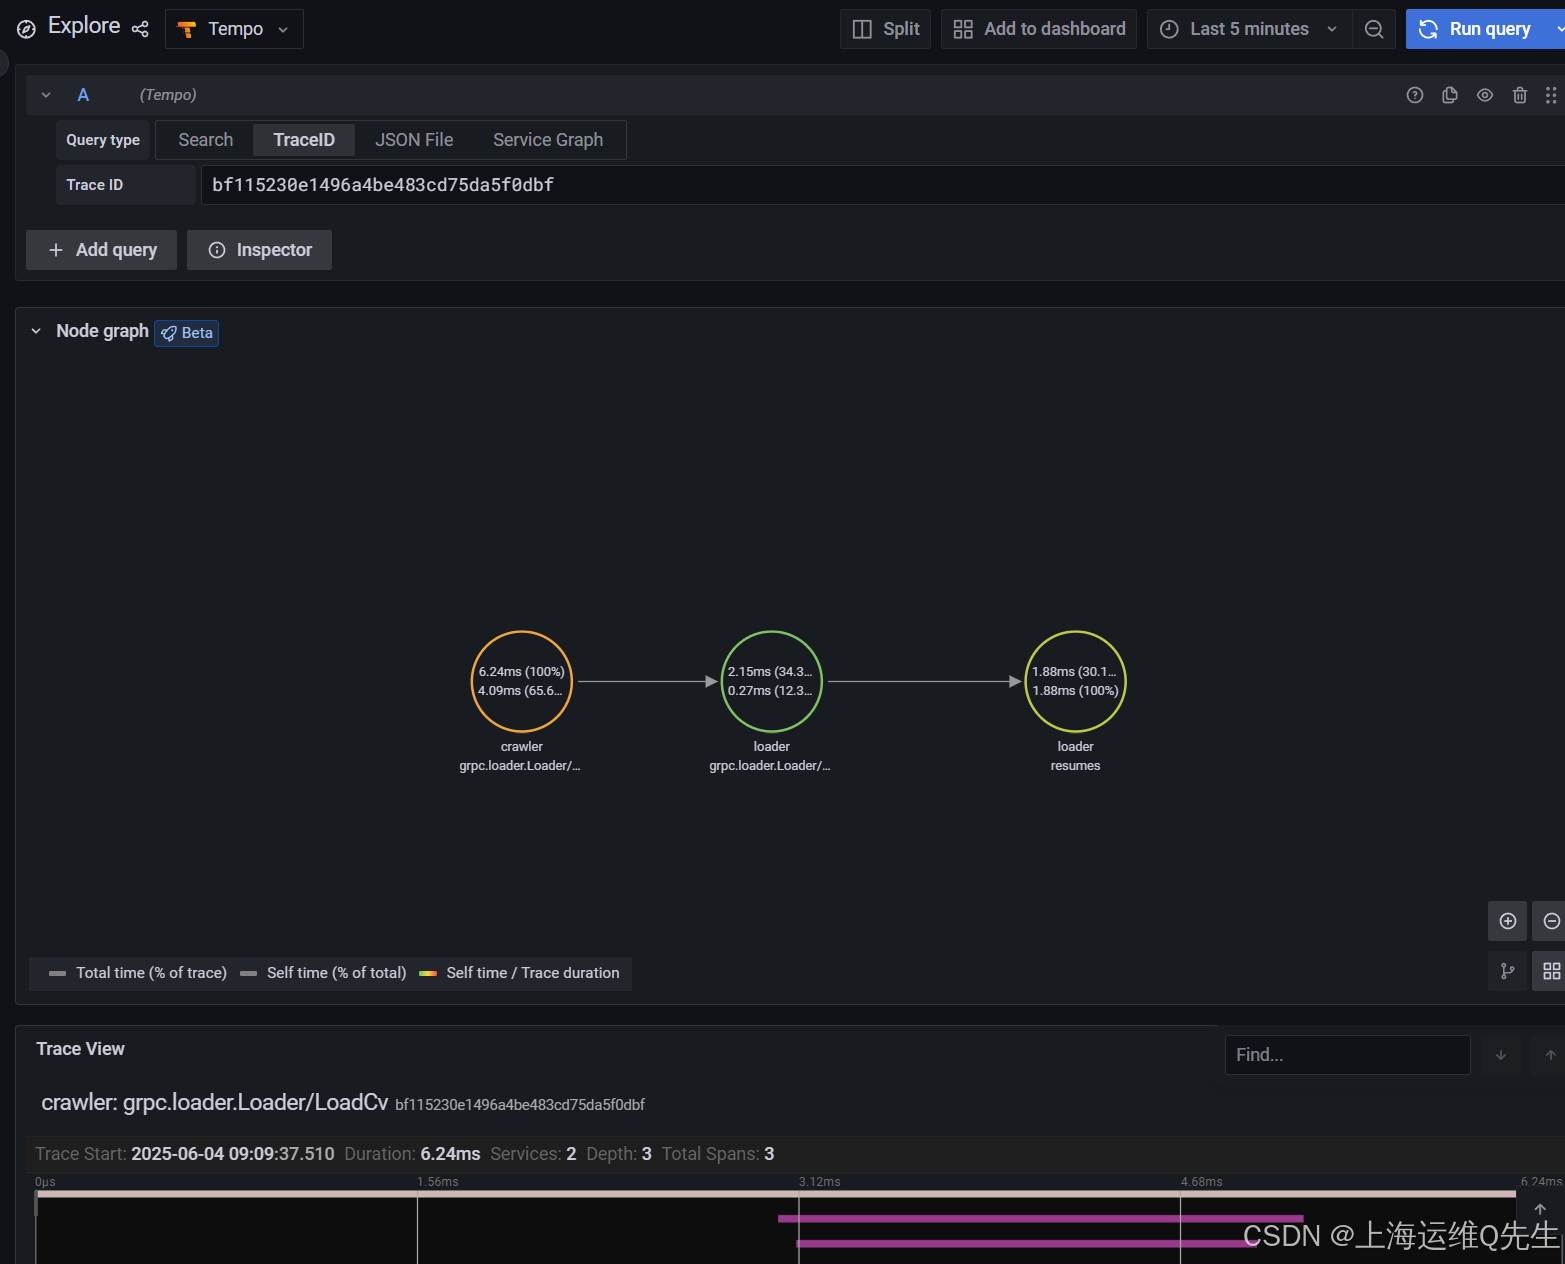
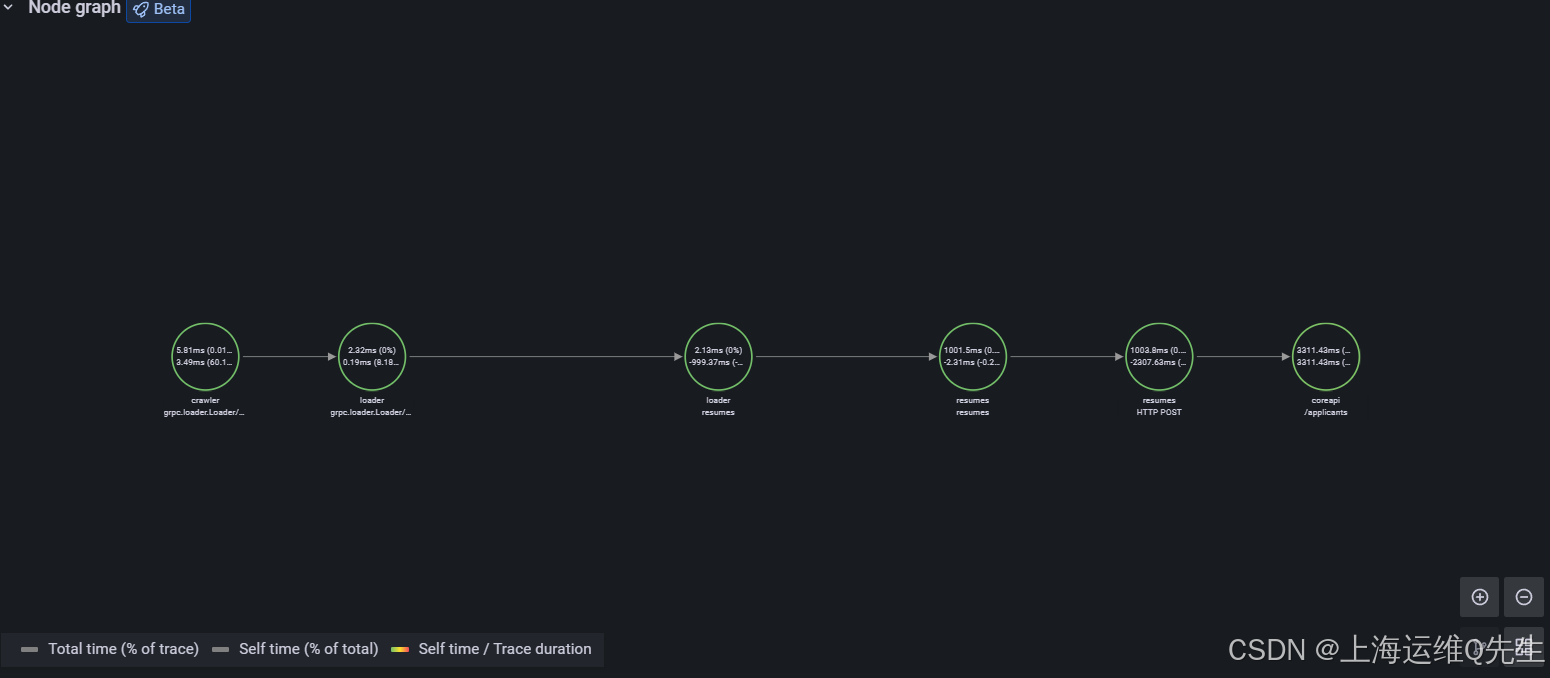
在 Trace View 的頂部,有一個 Node graph 面板。打開它可查看顯示交易中花費時間的有向圖。
使用 Web 瀏覽器中的后退??按鈕返回預覽視圖。
現在,在圖表的最底部選擇一個請求,然后單擊 “Query with Tempo” 按鈕:
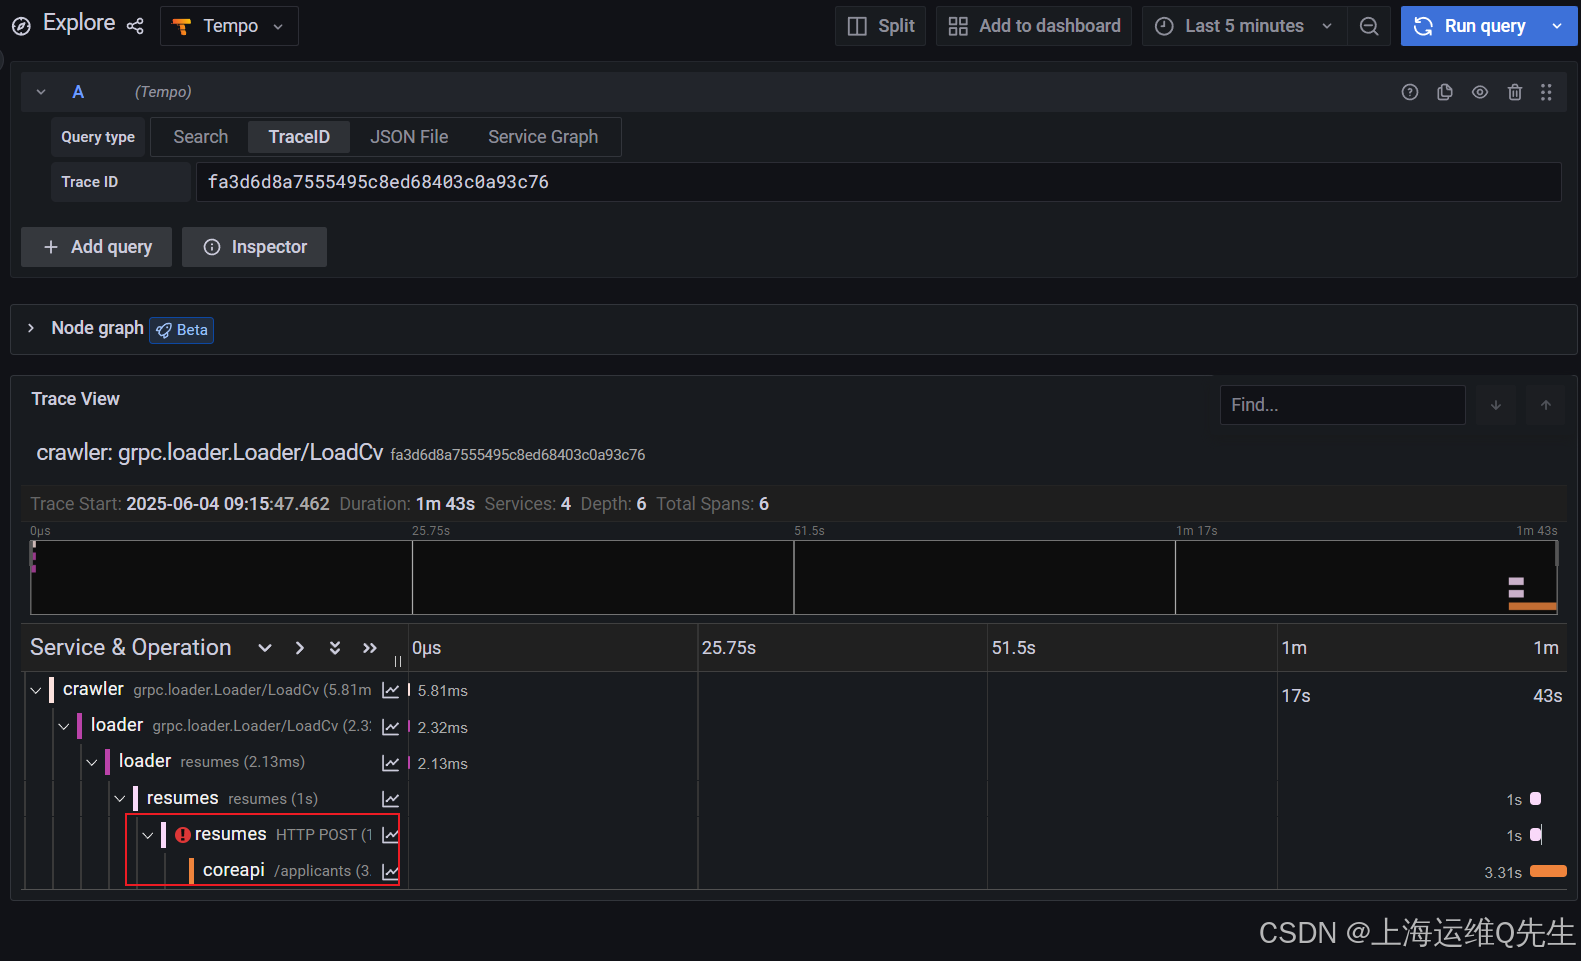
您很可能會在跟蹤中看到 coreapi 服務的錯誤。resumes 組件正在嘗試連接到 coreapi 但請求沒有通過。resumes 實際上會多次重試連接,從而導致多個錯誤,直到成功為止。
如果您打開 Node graph (節點圖形 ) 視圖,您也將在那里重試:
8. 最終實驗
8.1 題目
應用程序已使用原始參數再次部署,但其中一個服務已損壞。
使用每項服務的 Grafana 控制面板,確定哪個服務損壞并修復它。
如果您遇到困難,請考慮以下提示。
- 提示1
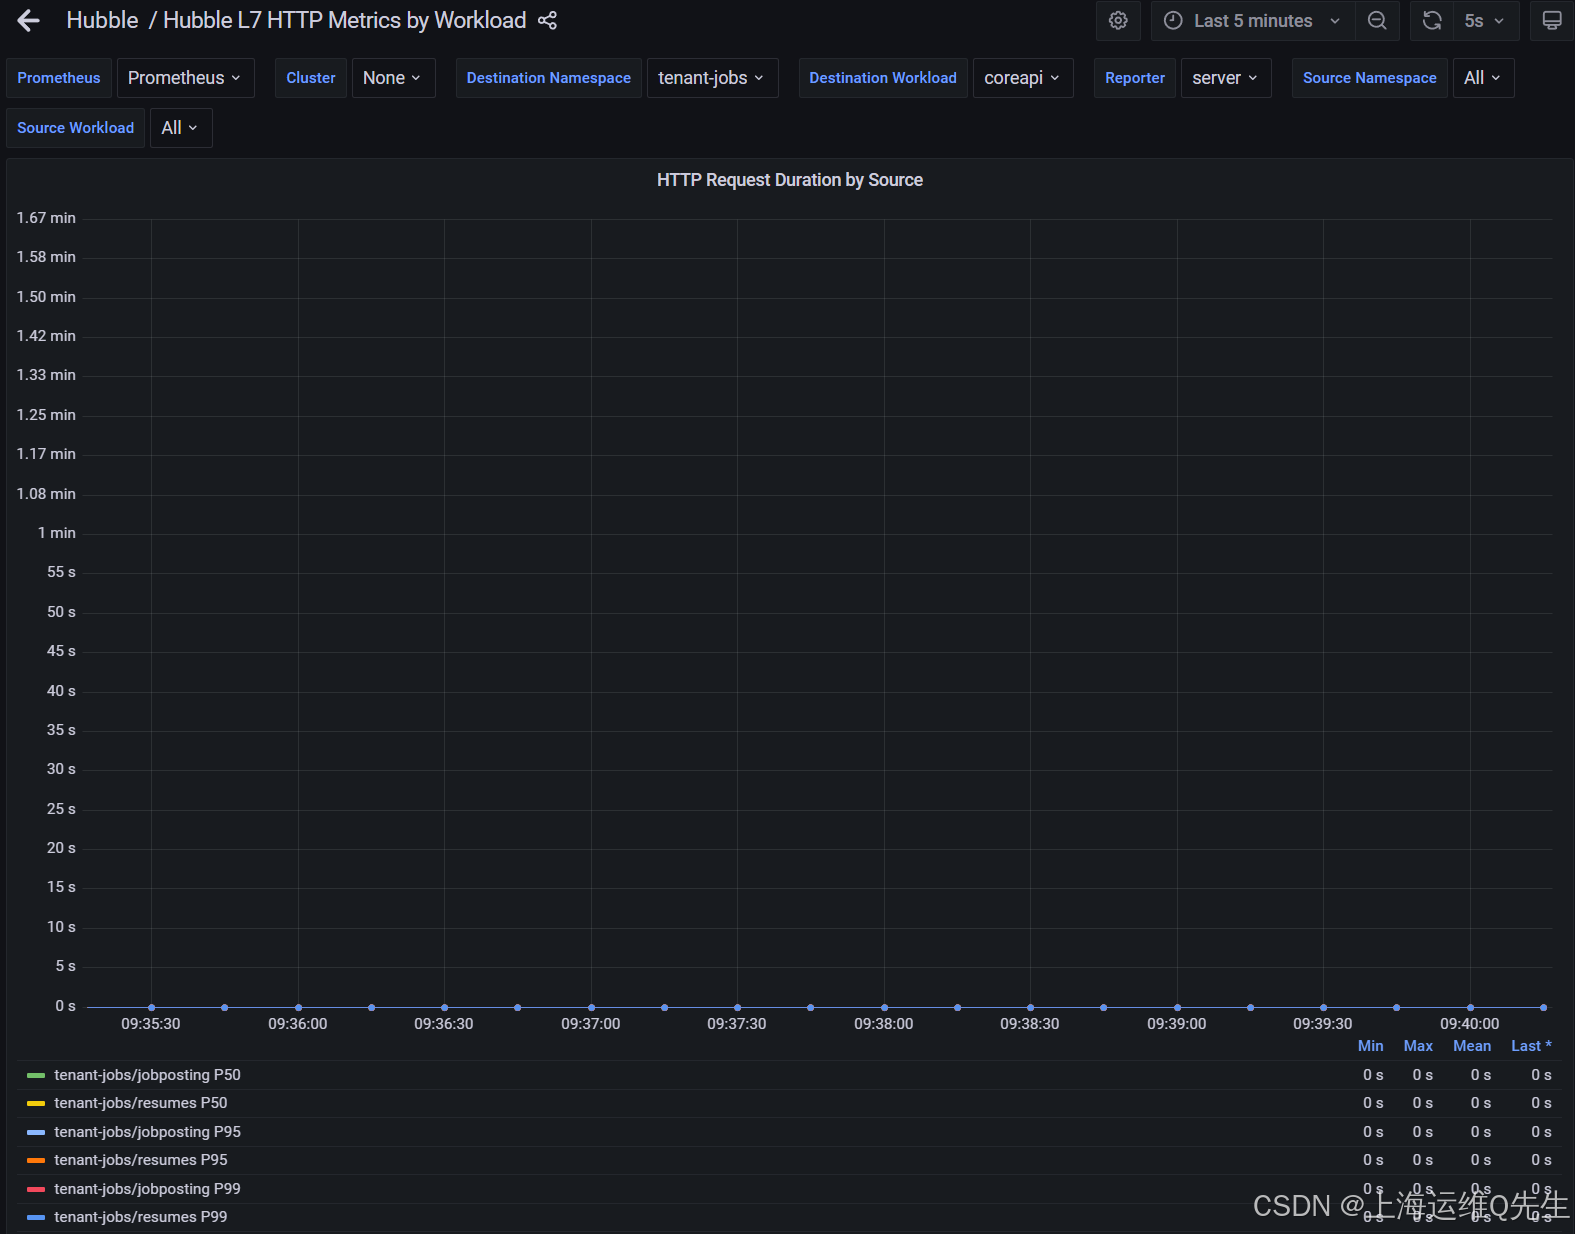
首先查看傳入的請求和相關錯誤。
瀏覽 Grafana 上的三個儀表板(coreapi、loader 和 elasticsearch-master)。
其中一項服務返回錯誤,是哪一項?
另一個服務根本不接受傳入請求,是哪一個?
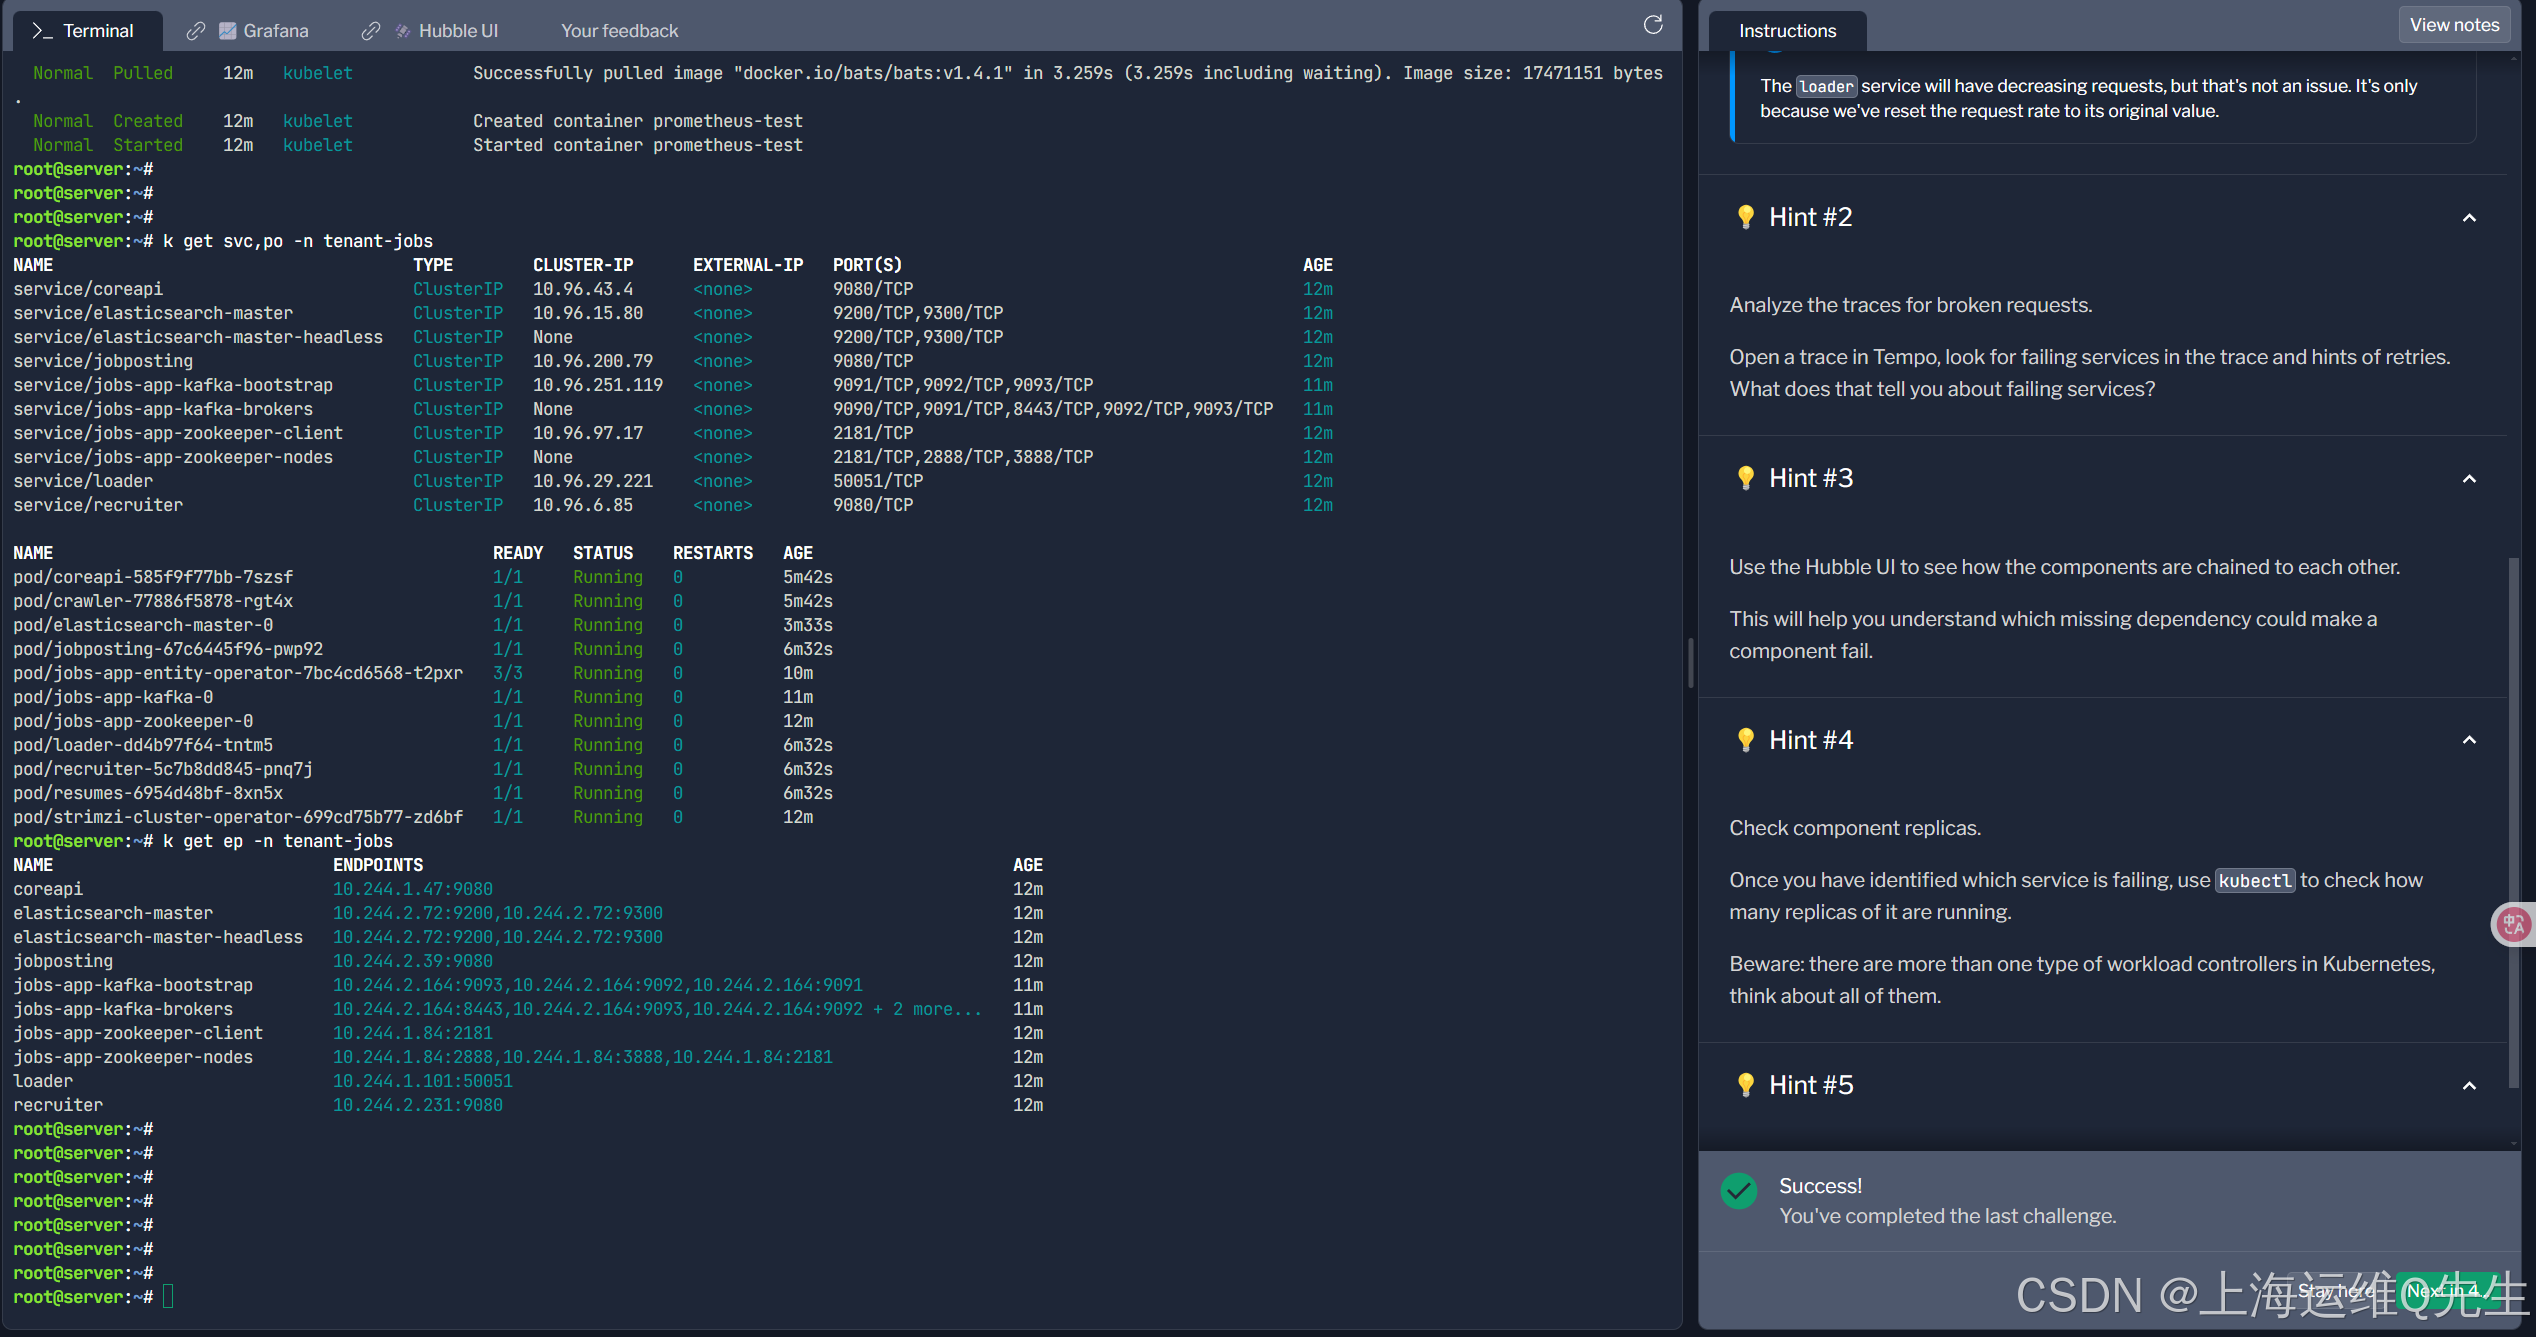
加載程序服務的請求數會減少,但這不是問題。這只是因為我們已將請求速率重置為其原始值。
- 提示2
分析跟蹤以查找中斷的請求。
在 Tempo 中打開一個跟蹤,在跟蹤中查找失敗的服務以及重試的提示。這說明了服務失敗的什么情況?
- 提示3
使用 Hubble UI 查看組件如何相互鏈接。
這將幫助您了解哪些缺失的依賴項會導致組件失敗。
- 提示4
檢查組件副本。
確定哪個服務失敗后,請使用 kubectl 檢查它有多少個副本正在運行。
當心:Kubernetes 中有不止一種類型的工作負載控制器,請考慮所有類型。
- 提示5
使用 kubectl 修復問題。該特定服務應使用一個副本運行。
8.2 解題
8.2.1 圖形化界面確認問題
coreapi看上去沒有數據
loader有返回
elasticsearch-master看上去好像也沒數據
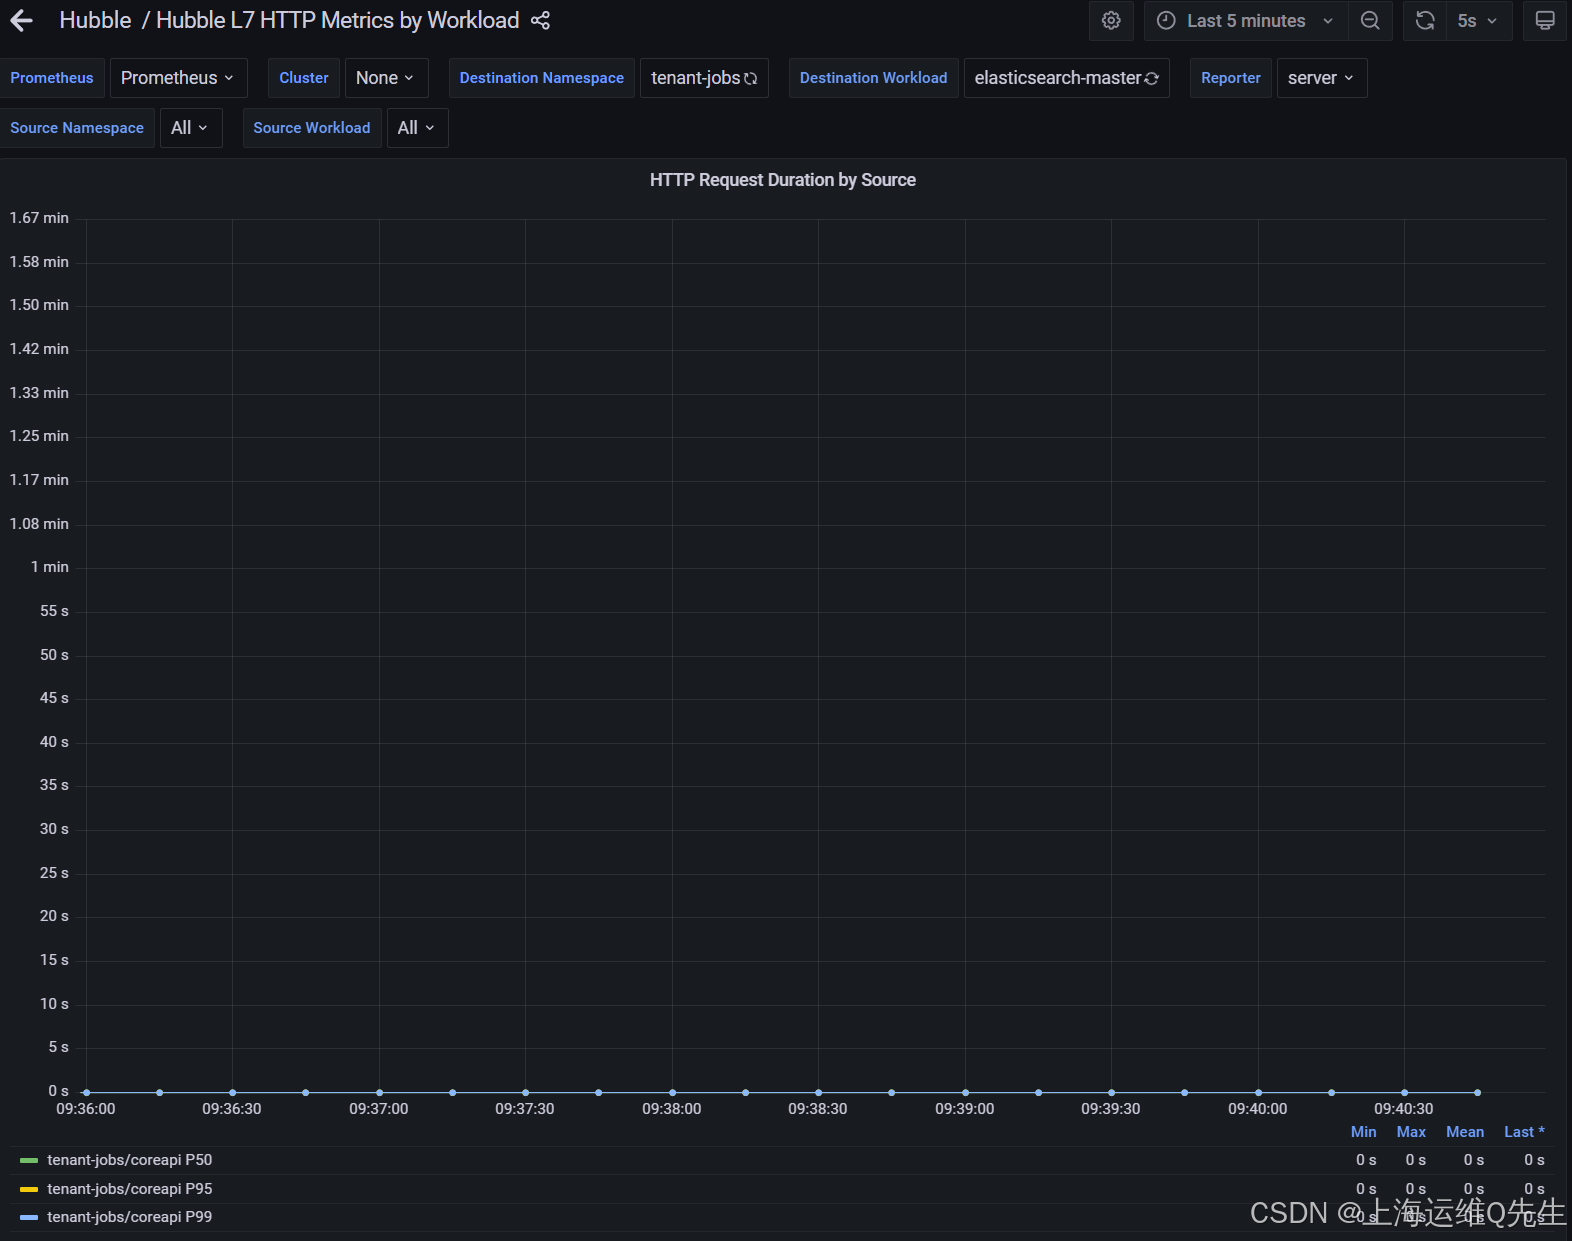
進一步調查發現coreapi是存在問題的
8.2.2 命令行下確認問題
查看下tenant-jobs下的pod情況
顯然問題出在elasticsearch-master.tenant-jobs.svc.cluster.local:9200這個服務上
root@server:~# k get po -n tenant-jobs
NAME                                        READY   STATUS     RESTARTS   AGE
coreapi-54dfb497c4-n8t5p                    1/1     Running    0          19m
coreapi-585f9f77bb-48twp                    0/1     Init:0/1   0          3m57s
crawler-77886f5878-g84qj                    1/1     Running    0          18m
jobposting-67c6445f96-7dtll                 1/1     Running    0          19m
jobs-app-entity-operator-7bc4cd6568-tg5ck   3/3     Running    0          22m
jobs-app-kafka-0                            1/1     Running    0          22m
jobs-app-zookeeper-0                        1/1     Running    0          23m
loader-dd4b97f64-f8d7q                      1/1     Running    0          19m
recruiter-5c7b8dd845-clx42                  1/1     Running    0          19m
resumes-6954d48bf-s5tpl                     1/1     Running    0          19m
strimzi-cluster-operator-699cd75b77-nb4fw   1/1     Running    0          23m
root@server:~# k describe po -n tenant-jobs coreapi-585f9f77bb-48twp
Name:             coreapi-585f9f77bb-48twp
Namespace:        tenant-jobs
Priority:         0
Service Account:  default
Node:             kind-worker2/172.18.0.3
Start Time:       Wed, 04 Jun 2025 02:33:28 +0000
Labels:           app=coreapipod-template-hash=585f9f77bb
Annotations:      <none>
Status:           Pending
IP:               10.244.2.233
IPs:IP:           10.244.2.233
Controlled By:  ReplicaSet/coreapi-585f9f77bb
Init Containers:wait-for-elasticsearch:Container ID:  containerd://4e12c079de57cdc32f0dc851a3185de25c4ac3011afa8f578efa04bcd07fd650Image:         curlimages/curl:latestImage ID:      docker.io/curlimages/curl@sha256:d43bdb28bae0be0998f3be83199bfb2b81e0a30b034b6d7586ce7e05de34c3fdPort:          <none>Host Port:     <none>Command:sh-cuntil curl -s -o /dev/null http://elasticsearch-master.tenant-jobs.svc.cluster.local:9200; do echo waiting for elasticsearch; sleep 5; doneState:          RunningStarted:      Wed, 04 Jun 2025 02:33:29 +0000Ready:          FalseRestart Count:  0Environment:    <none>Mounts:/var/run/secrets/kubernetes.io/serviceaccount from kube-api-access-dmpxc (ro)
Containers:coreapi:Container ID:   Image:          quay.io/isovalent/jobs-app-coreapi:v0.10.0Image ID:       Port:           9080/TCPHost Port:      0/TCPState:          WaitingReason:       PodInitializingReady:          FalseRestart Count:  0Environment:ES_ENDPOINT:                        http://elastic:changeme@elasticsearch-master.tenant-jobs.svc.cluster.local:9200/BOOTSTRAP:                          trueDEBUG:                              falseENABLE_TRACING:                     trueLOG_SPANS:                          falseOTL_EXPORTER_ENABLED:               trueHOST_IP:                             (v1:status.hostIP)OTEL_EXPORTER_OTLP_ENDPOINT:        http://$(HOST_IP):4317ERROR_RATE:                         0.01SLEEP_RATE:                         0.1SLOW_REQUEST_DURATION_LOWER_BOUND:  0.1SLOW_REQUEST_DURATION_UPPER_BOUND:  0.2Mounts:/var/run/secrets/kubernetes.io/serviceaccount from kube-api-access-dmpxc (ro)
Conditions:Type                        StatusPodReadyToStartContainers   TrueInitialized                 FalseReady                       FalseContainersReady             FalsePodScheduled                True
Volumes:kube-api-access-dmpxc:Type:                    Projected (a volume that contains injected data from multiple sources)TokenExpirationSeconds:  3607ConfigMapName:           kube-root-ca.crtConfigMapOptional:       <nil>DownwardAPI:             true
QoS Class:                   BestEffort
Node-Selectors:              <none>
Tolerations:                 node.kubernetes.io/not-ready:NoExecute op=Exists for 300snode.kubernetes.io/unreachable:NoExecute op=Exists for 300s
Events:Type    Reason     Age    From               Message----    ------     ----   ----               -------Normal  Scheduled  4m10s  default-scheduler  Successfully assigned tenant-jobs/coreapi-585f9f77bb-48twp to kind-worker2Normal  Pulling    4m9s   kubelet            Pulling image "curlimages/curl:latest"Normal  Pulled     4m9s   kubelet            Successfully pulled image "curlimages/curl:latest" in 664ms (664ms including waiting). Image size: 9555383 bytes.Normal  Created    4m9s   kubelet            Created container wait-for-elasticsearchNormal  Started    4m9s   kubelet            Started container wait-for-elasticsearch
再確認這個svc發現elasticsearch-master沒有ep存在
root@server:~# k get svc -n tenant-jobs elasticsearch-master
NAME                   TYPE        CLUSTER-IP     EXTERNAL-IP   PORT(S)             AGE
elasticsearch-master   ClusterIP   10.96.117.68   <none>        9200/TCP,9300/TCP   25m
root@server:~# k get ep -n tenant-jobs elasticsearch-master
NAME                   ENDPOINTS   AGE
elasticsearch-master   <none>      25m
通過命令發現statefulset的elasticsearch-master是0/0
root@server:~# k get all -n tenant-jobs |grep ela
service/elasticsearch-master            ClusterIP   10.96.117.68    <none>        9200/TCP,9300/TCP                              26m
service/elasticsearch-master-headless   ClusterIP   None            <none>        9200/TCP,9300/TCP                              26m
statefulset.apps/elasticsearch-master   0/0     26m
調度statefulset副本數
root@server:~# k scale -n tenant-jobs statefulset --replicas=1 elasticsearch-master
statefulset.apps/elasticsearch-master scaled
稍等片刻后tenant命名空間下面的pod都正常了
root@server:~# k get po -n tenant-jobs
NAME                                        READY   STATUS    RESTARTS   AGE
coreapi-585f9f77bb-48twp                    1/1     Running   0          9m52s
crawler-77886f5878-g84qj                    1/1     Running   0          24m
elasticsearch-master-0                      1/1     Running   0          99s
jobposting-67c6445f96-7dtll                 1/1     Running   0          24m
jobs-app-entity-operator-7bc4cd6568-tg5ck   3/3     Running   0          28m
jobs-app-kafka-0                            1/1     Running   0          28m
jobs-app-zookeeper-0                        1/1     Running   0          29m
loader-dd4b97f64-f8d7q                      1/1     Running   0          24m
recruiter-5c7b8dd845-clx42                  1/1     Running   0          24m
resumes-6954d48bf-s5tpl                     1/1     Running   0          24m
strimzi-cluster-operator-699cd75b77-nb4fw   1/1     Running   0          29m
此時Grafana這邊也正常了
看來應該沒什么問題了.提交!
新徽章GET!


)

)


