項目下載地址 GitHub 地址??https://github.com/ecomfe/echarts-for-weixin
將當前文件夾里的內容拷貝到項目中
目錄: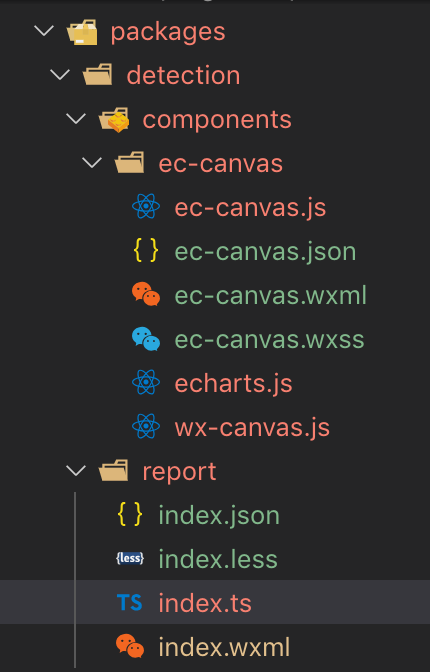
json:
{"usingComponents": {"ec-canvas": "../components/ec-canvas/ec-canvas"}
}
wxml:
<ec-canvas id="eChart" canvas-id="eChart" ec="{{ ec }}"></ec-canvas>js:
import * as echarts from '../components/ec-canvas/echarts.js';
Page({data: {ec: {lazyLoad: true,}},onReady: function () {const num = 77this.initchart(num)},initchart(data) {let ec_canvas = this.selectComponent('#eChart');ec_canvas.init((canvas, width, height, dpr) => {const chart = echarts.init(canvas, null, {width: width,height: height,devicePixelRatio: dpr // new});canvas.setChart(chart);const option = {title: {text: ''},tooltip: {formatter: '{a} <br/>{b} : {c}%'},series: [{name: '評估',  // 設置環形進度條的名稱type: 'gauge',radius: '80%',  // 設置環形的半徑startAngle: -135,  // 設置起始角度為左下角endAngle: -45,  // 設置結束角度為右下角progress: {show: true,  // 顯示進度條width: 10,  // 設置環形的寬度itemStyle: {// 使用 LinearGradient 設置漸變色color: new echarts.graphic.LinearGradient(0, 0, 1, 1, [{ offset: 0, color: '#61E5AB' },  // 漸變起始顏色{ offset: 1, color: '#228D7D' }   // 漸變結束顏色])}},detail: {valueAnimation: true,  // 動畫效果formatter: '{value}',  // 只顯示值fontSize: 30,  // 設置字體大小color: '#333',  // 設置字體顏色offsetCenter: [0, '40%'],  // 設置文本位置},data: [{value: data}],axisLine: {},axisTick: {show: false},axisLabel: {show: false,distance: 50},splitLine: {show: false  // 去掉分割線},}]};chart.setOption(option);return chart;})},
}
結果:


)

)


