官網給出的詳細指南,只是可能大家打不開或者懶得去看E文。
第一步,下載CytoTRACE安裝包。
wget https://cytotrace.stanford.edu/CytoTRACE_0.3.3.tar.gz第二步,打開R或者Rstudio-server
# 安裝依賴包
if (!requireNamespace("BiocManager", quietly = TRUE))install.packages("BiocManager")
BiocManager::install("sva")# 安裝CytoTRACE
# PATH/TO/DIRECTORY 寫自己的路徑install.packages("devtools")
devtools::install_local("PATH/TO/DIRECTORY/CytoTRACE_0.3.3.tar.gz")Or
getwd()#獲取路徑,然后把CytoTRACE_0.3.3.tar.gz移動到相應位置
install.packages("devtools")
devtools::install_local("./CytoTRACE_0.3.3.tar.gz")
第三步,安裝python相關的包
$ pip install scanoramaCT
$ pip install numpy# 官網原文
The iCytoTRACE() function in the R package requires 2 Python packages,
scanoramaCT, an adapted version of the original Scanorama code for application to CytoTRACE, and numpy.
The CytoTRACE() function will run without these dependencies,
but to enable application of CytoTRACE across multiple batches/datasets,
install the Python dependencies by running:
第四步,設置Python路徑
# 這些是我調用conda環境的命令不用輸入
# 不用輸入
# 不用輸入,快進到sys.setenv。
.libPaths(c('/data/anaconda3/envs/public/lib/R/library',.libPaths()))
current_paths <- .libPaths()
new_paths <- current_paths# 將第三個路徑移到第一位
new_paths[1] <- current_paths[2]
new_paths[2] <- current_paths[1]
.libPaths(new_paths)
.libPaths()# 就是下面這句,因為我調用了public環境,所有python路徑用conda中的。
Sys.setenv(RETICULATE_PYTHON="/data/anaconda3/envs/public/bin/python")
library(CytoTRACE)
第五步,測試
# 刪除未表達的基因
expressed_genes <- rowSums(marrow_10x_expr > 0) > 0
marrow_10x_expr_filtered <- marrow_10x_expr[expressed_genes, ]# 調整表型標簽長度
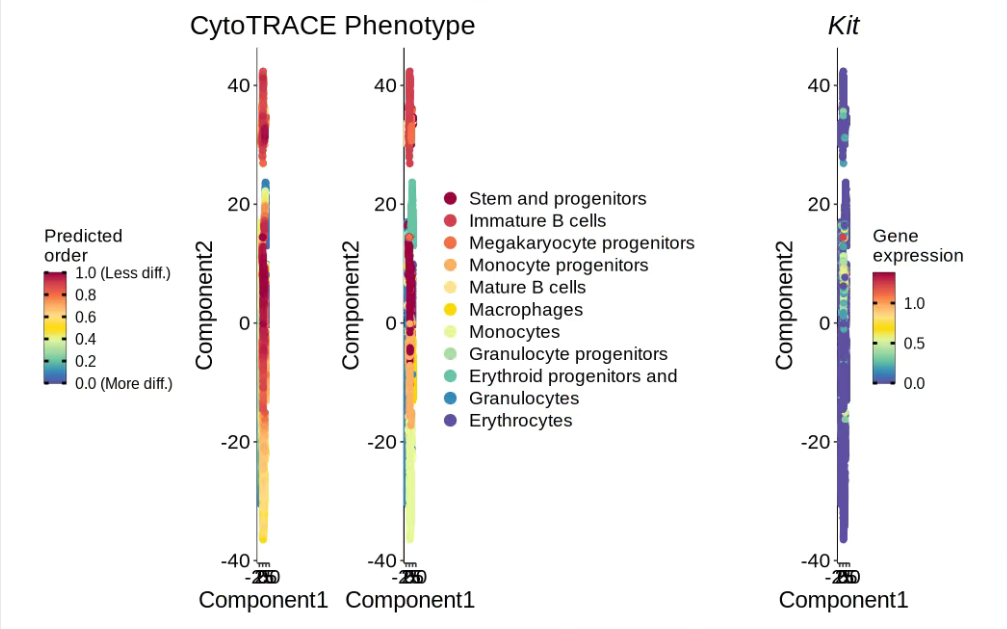
shortened_labels <- substr(marrow_10x_pheno, 1, 25)# 運行 CytoTRACE,并關閉快速模式
results <- CytoTRACE(marrow_10x_expr_filtered,enableFast = FALSE, ncores = 8, subsamplesize = 1000)# 可視化
plotCytoTRACE(results, phenotype = shortened_labels, gene = "Kit")

微軟與Mistral AI達成合作 | 谷歌發11B基礎世界模型 | 傳蘋果放棄電動汽車制造轉向生成式AI)


)

)


)

)


)
(九))
)

)