開源的統計圖控件中基本常用的是OpenFlashChar和ZedGraph,今天就先來講講ZedGraph的使用。
ZedGraph資源
- ZedGraph來源:http://sourceforge.net/project/showfiles.php?group_id=114675
- ZedGraph相關例子資源:http://zedgraph.org/wiki/index.php?title=Sample_Graphs?
?
ZedGraph的特點:
- 第一,可以先生成圖片后再顯示,這對一些多用戶并發有點幫助。(RenderMode.ImageTag)
- 第二,可以動態生成,不用保存文件,可以減少IO的讀寫消耗。(RenderMode.RawImage)
- 第三,比較多的呈現方式,比如曲線圖、柱狀圖、餅圖等。?
?
ZedGraph的缺點:
- 第一,編碼的時候,在設置屬性時太爛了,一點注釋都沒有,不要說是中文的啦,就連英文都沒有,太不方便了。
- 第二,圖表的顯示比較簡陋,沒有OpenFlashChar來得好看。
?
注意事宜
- 第一,當前的最新版本是5.1.5,我以前也使用過4.3.4的版本,這兩個版本的差別很大,很多屬性都已經不存在了,面向對象的感念可能加強了不少,也清晰了不少,因為現在的屬性設置都是先實體,再屬性了,而以前就比較混亂了。所以在使用不同的版本的時候要注意這點。
- 第二,在Windows Forms和 ASP.Net Web Form中使用是不同。
?
一個簡單的入門例子?
- 第一,在 bin文件夾中加入 Zedgraph.dll 和Zedgraph.web.dll;
- 第二,添加這兩個dll的引用;
- 第三,在網站下要創建一個空文件夾,名稱為 'ZedGraphImages',這個文件夾名稱是默認的,要修改這個文件夾名稱,可以修改屬性 RenderedImagePath,CacheDuration緩存的持續時間。ZedGraph會生成一圖片存放在緩存的目錄中,顯示圖片時,會生成一個img標簽代替ZedGraphWeb標簽,并在一個時間內,"欺騙"瀏覽器加載這張圖片;
- 第四,在 aspx文件中加入:<%@ Register TagPrefix="zgw" Namespace="ZedGraph.Web" Assembly="ZedGraph.Web" %>;在html中加入<zgw:ZedGraphWeb ID="ZedGraphWeb1" runat="server" Width="300" Height="130" RenderMode="ImageTag"></zgw:ZedGraphWeb>??
- 第五,在cs文件中添加引用: using ZedGraph;using ZedGraph.Web;using System.Drawing;//顏色
- 第六,注冊事件,this.ZedGraphWeb1.RenderGraph += new ZedGraph.Web.ZedGraphWebControlEventHandler(GetImage);//注冊事件
- 第七,寫方法,private void GetImage(ZedGraphWeb zgw, Graphics g, MasterPane masterPane){}
- 具體代碼可以參考ZedGraph webform 初學小例子 (代碼有詳細解釋)
一些經驗
- 傳遞數據的時候可以使用字典:IDictionary<int, int> dic;?
- 一些屬性設置
myPane.XAxis.Scale.FontSpec.Size?=?30;//設置x軸的文字大小.
myPane.YAxis.Scale.FontSpec.Size?=?30;//設置y軸的文字大小.
myPane.YAxis.MajorGrid.IsVisible?=?true;//設置虛線.
myPane.Chart.Border.IsVisible?=?false;//圖表區域的邊框設置.
myPane.Legend.IsVisible?=?false;//圖表的注釋標簽顯示設置項目.
myPane.YAxis.Scale.FontSpec.Size?=?30;//設置y軸的文字大小.
myPane.YAxis.MajorGrid.IsVisible?=?true;//設置虛線.
myPane.Chart.Border.IsVisible?=?false;//圖表區域的邊框設置.
myPane.Legend.IsVisible?=?false;//圖表的注釋標簽顯示設置項目.
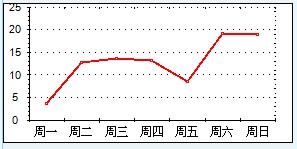
- 動態根據傳入的數據顯示的方法

????????///?<summary>
????????///?曲線圖.
????????///?</summary>
????????public?void?CreateLineChart(GraphPane?myPane,?IDictionary<int,?int>?dic,?string?title,?string?xField,?string?yFields,?string?format)
????????{
????????????myPane.XAxis.Scale.FontSpec.Size?=?30;//設置x軸的文字大小.
????????????myPane.YAxis.Scale.FontSpec.Size?=?30;//設置y軸的文字大小.
????????????myPane.YAxis.MajorGrid.IsVisible?=?true;//設置虛線.
????????????myPane.Chart.Border.IsVisible?=?false;//圖表區域的邊框設置.
????????????myPane.Legend.IsVisible?=?false;//圖表的注釋標簽顯示設置項目.
????????????int?rows?=?dic.Count;
????????????double[]?arrY?=?new?double[rows];
????????????double[]?arrX?=?new?double[rows];
????????????string[]?labels?=?new?string[rows];
????????????int?i?=?0;
????????????foreach?(KeyValuePair<int,?int>?kvp?in?dic)
????????????{
????????????????arrX[i]?=?Convert.ToDouble(kvp.Key);
????????????????arrY[i]?=?Convert.ToDouble(kvp.Value);
????????????????labels[i]?=?kvp.Key.ToString();
????????????????i++;
????????????}
????????????LineItem?myCurve?=?myPane.AddCurve(title,?arrX,?arrY,?Color.Red,?SymbolType.Square);
????????????myCurve.Symbol.Fill?=?new?Fill(Color.Blue,?Color.White,?Color.Blue);//填充這個藍條,讓這藍條看起來有3D的效果
????????????myCurve.Line.Width?=?2;
????????????myPane.XAxis.Scale.TextLabels?=?labels;?//X軸的說明文字
????????????myPane.XAxis.Type?=?AxisType.Text;
????????}
- 小圖的屬性設置
????????????myPane.XAxis.Scale.FontSpec.Size?=?30;//設置x軸的文字大小.
????????????myPane.YAxis.Scale.FontSpec.Size?=?30;//設置y軸的文字大小.
????????????myPane.YAxis.MajorGrid.IsVisible?=?true;//設置虛線.
????????????myPane.Chart.Border.IsVisible?=?false;//圖表區域的邊框設置.
????????????myPane.Legend.IsVisible?=?false;//圖表的注釋標簽顯示設置項目.
????????????myPane.YAxis.Scale.FontSpec.Size?=?30;//設置y軸的文字大小.
????????????myPane.YAxis.MajorGrid.IsVisible?=?true;//設置虛線.
????????????myPane.Chart.Border.IsVisible?=?false;//圖表區域的邊框設置.
????????????myPane.Legend.IsVisible?=?false;//圖表的注釋標簽顯示設置項目.
- 小圖的屬性設置刻度問題
????????????myPane.YAxis.Scale.Min?=?0;//設置只顯示正半軸.
????????????myPane.YAxis.Scale.MajorStep?=?1;//設置刻度為1;
????????????myPane.YAxis.Scale.MajorStep?=?1;//設置刻度為1;
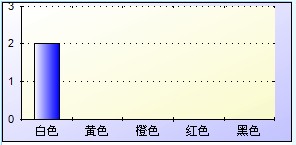
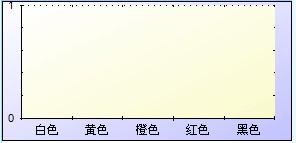
- 屬性分布圖,From?Arbean.Wu
?
?
相關資料
- http://weblogs.asp.net/scottgu/archive/2008/11/24/new-asp-net-charting-control-lt-asp-chart-runat-quot-server-quot-gt.aspx
- http://zedgraph.org/wiki/index.php?title=Sample_Graphs
- 波浪線圖:http://zedgraph.org/wiki/index.php?title=Dual-Y_Demo
- RenderMode.ImageTag例子:http://zedgraph.org/wiki/index.php?title=Use_RenderMode.ImageTag_in_a_web_page
RenderMode.RawImage例子:http://zedgraph.org/wiki/index.php?title=Use_RenderMode.RawImage_in_a_web_page ZedGraph webform 初學小例子 (代碼有詳細解釋)
ZedGraph屬性
一個簡單例子- 開源圖表控件ZedGraph控件的研究(1)
- ZedGraph屬性\方法介紹
- http://zedgraph.sourceforge.net/samples.html
![[轉載]聊一聊人員培養](http://pic.xiahunao.cn/[轉載]聊一聊人員培養)


)
)

)

函數)

)
)


