接上篇:Matlab精彩畫圖示例:繪制圖上圖
這篇介紹兩個繪制三維圖的命令:
- mesh - 繪制三維網狀圖
- surf - 繪制三維曲面圖
matlab代碼如下:
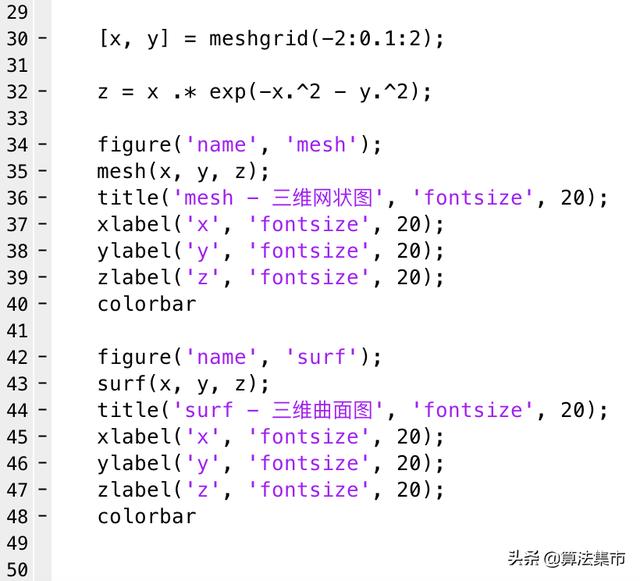
繪制三維圖的matlab代碼示例
程序運行結果如下:
mesh(X,Y,Z) draws a wireframe mesh with color determined by Z, so color is proportional to surface height.
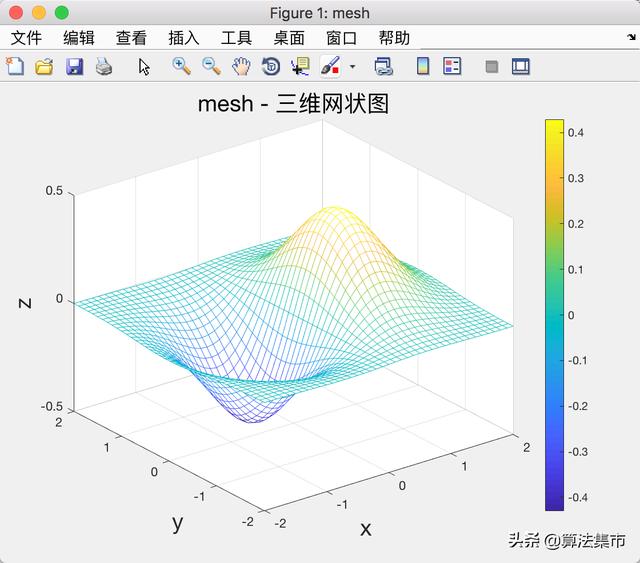
mesh三維網狀圖
surf(X,Y,Z) creates a three-dimensional surface plot. The function plots the values in matrix Z as heights above a grid in the x-y plane defined by X and Y. The function also uses Z for the color data, so color is proportional to height.
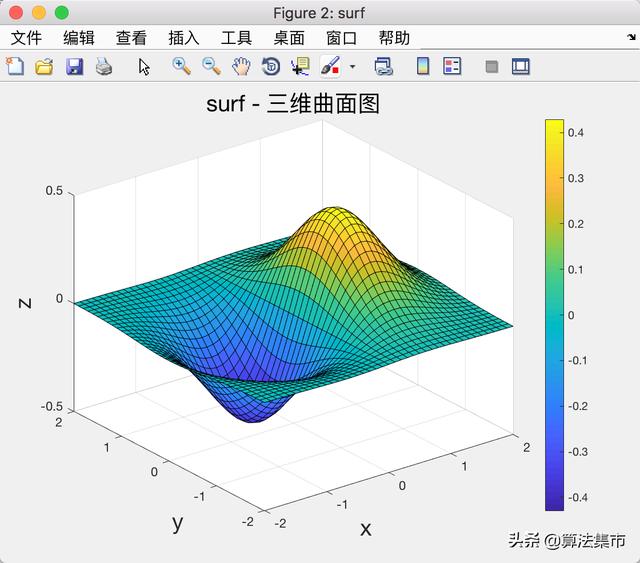
surf三維曲面圖
colorbar是色彩條狀圖的命令,默認顯示在圖形的右側。
colorbar displays a vertical colorbar to the right of the current axes or chart. Colorbars display the current colormap and indicate the mapping of data values into the colormap.
擴展閱讀
Matlab學習總結:從入門到離不開


)


)


