一、安裝Prometheus
官網下載地址:Download | Prometheus
解壓:tar -zxvf prometheus-2.19.2.linux-amd64.tar.gz重命名:?mv prometheus-2.19.2.linux-amd64 /home/prometheus進入對應目錄: cd?/home/prometheus查看配置文件:cat prometheus.yml# 前臺啟動
./prometheus --config.file=prometheus.yml# 后臺啟動
nohup ./prometheus --config.file=prometheus.yml > ./prometheus.log 2>&1 &
驗證是否成功:http://***.***.***.***:9090/graph
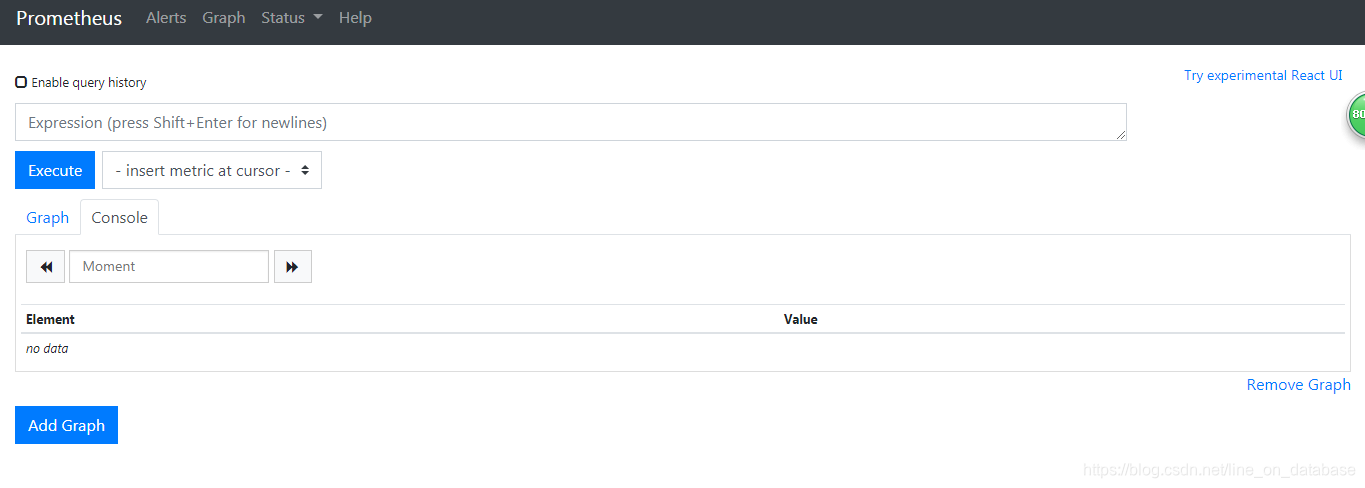
如果查不到數據可以檢查下我們的targets是否有報錯
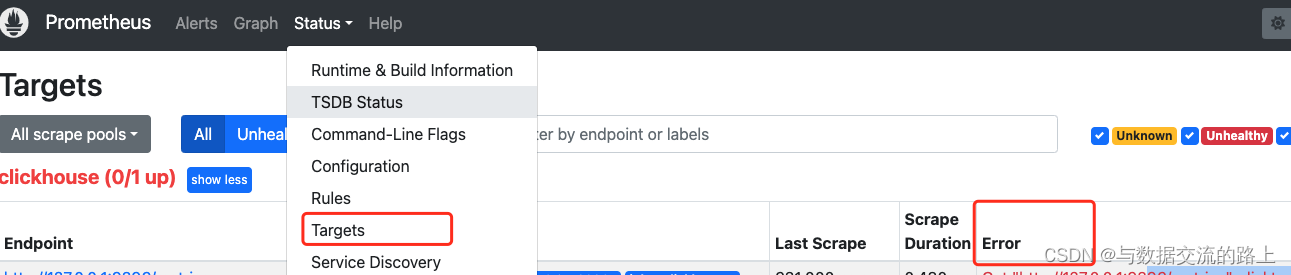
?
二、安裝Grafana
官方下載地址:Download Grafana | Grafana Labs
下載:wget?https://dl.grafana.com/oss/release/grafana-7.0.5-1.x86_64.rpm?安裝:yum install grafana-7.0.5-1.x86_64.rpm啟動:systemctl daemon-reload
systemctl enable grafana-server.service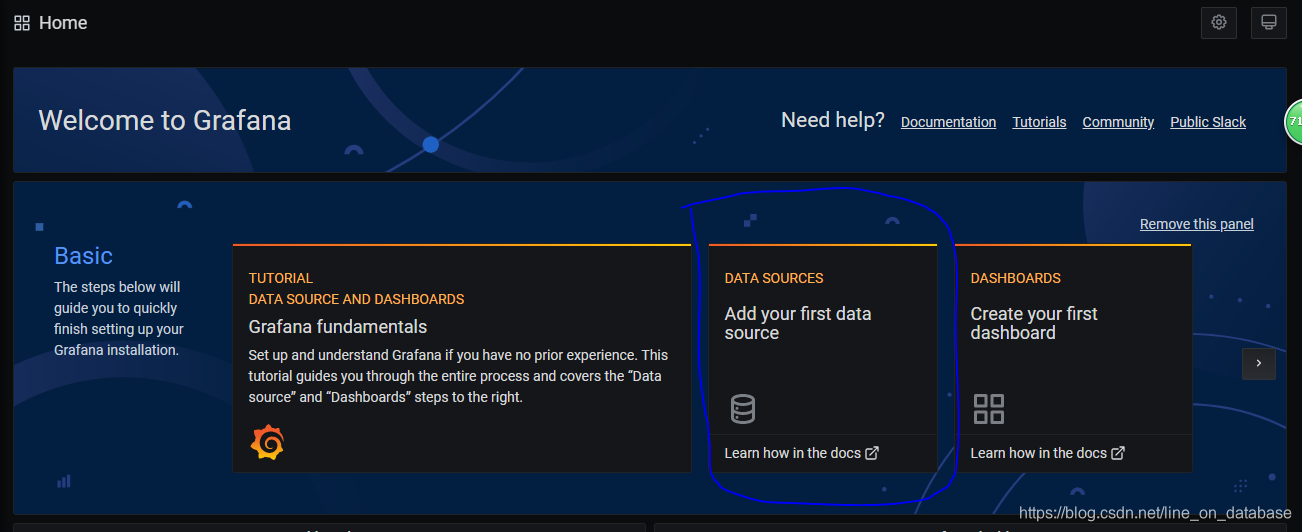
systemctl start grafana-server.service驗證是否成功:http://***.***.***.***:3000
默認用戶名密碼都是admin,初次登錄會要求修改默認的登錄密碼
添加數據源
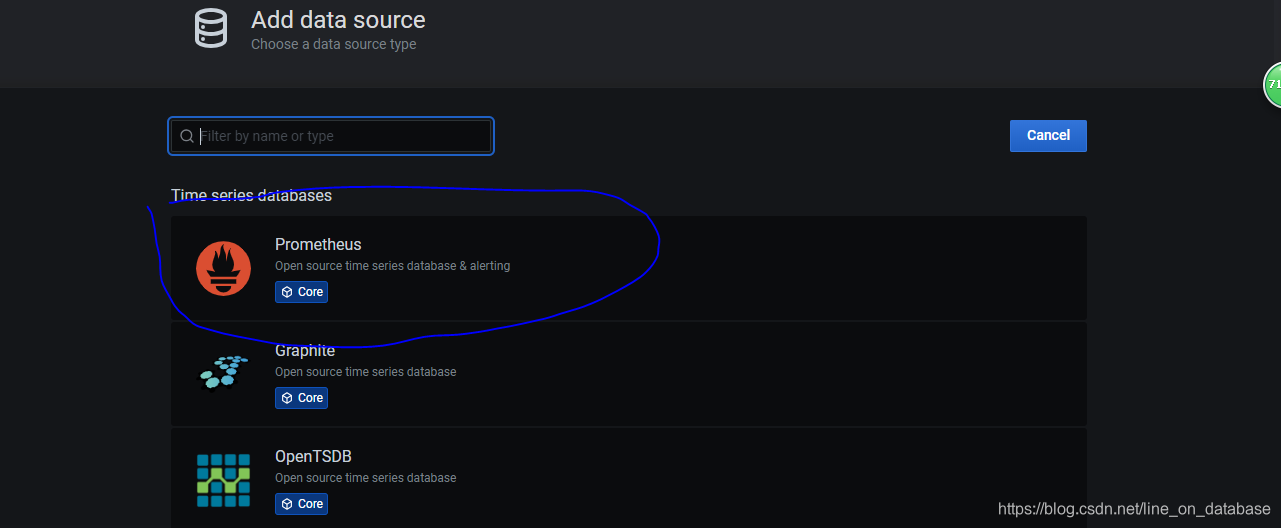
1.點擊DATA SOURCES
?2.選擇Prometheus
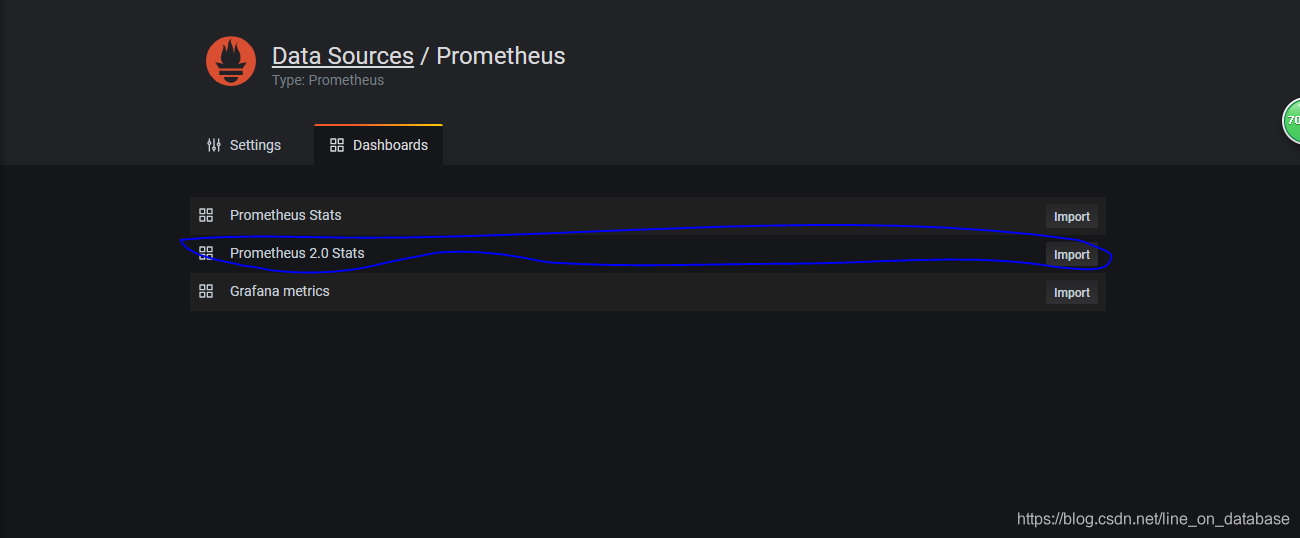
3.Dashboards中import “Prometheus 2.0 Stats”
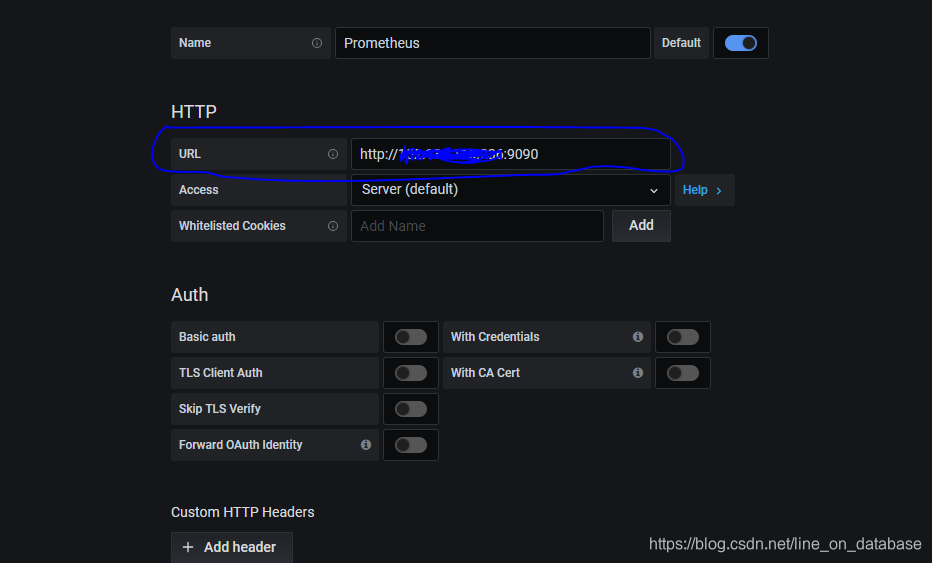
4.Settings界面填寫服務器地址
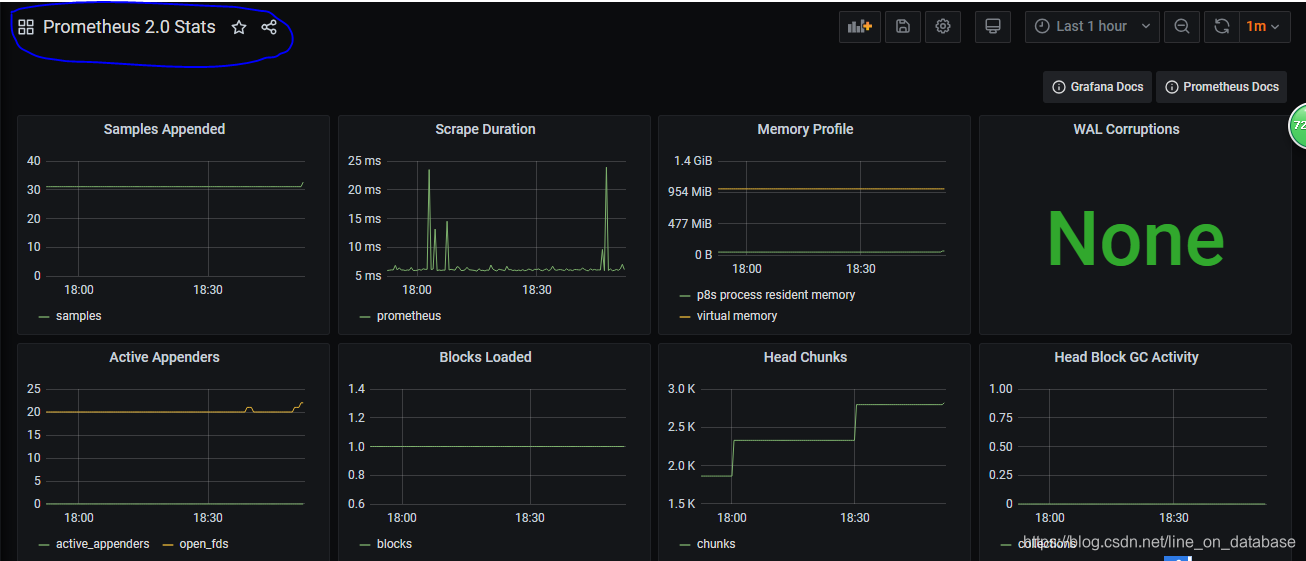
 ?5.切換界面
五、添加監控項
1.linux
下載node_exporter:
wget https://github.com/prometheus/node_exporter/releases/download/v1.0.1/node_exporter-1.0.1.linux-amd64.tar.gz
解壓:tar -zxvf node_exporter-1.0.1.linux-amd64.tar.gz
啟動:?./node_exporter &
注釋:記得查看防火墻9100端口是否開啟
這時候會看到如下警告
level=info ts=2020-07-09T02:24:55.402Z caller=tls_config.go:170 msg="TLS is disabled and it cannot be enabled on the fly." http2=false這是因為Node Exporter 自v1.0.0 版本加了TLS驗證(這個在后序篇幅講,此次跳過)
到官網選擇一個喜歡的儀表盤:Dashboards | Grafana Labs
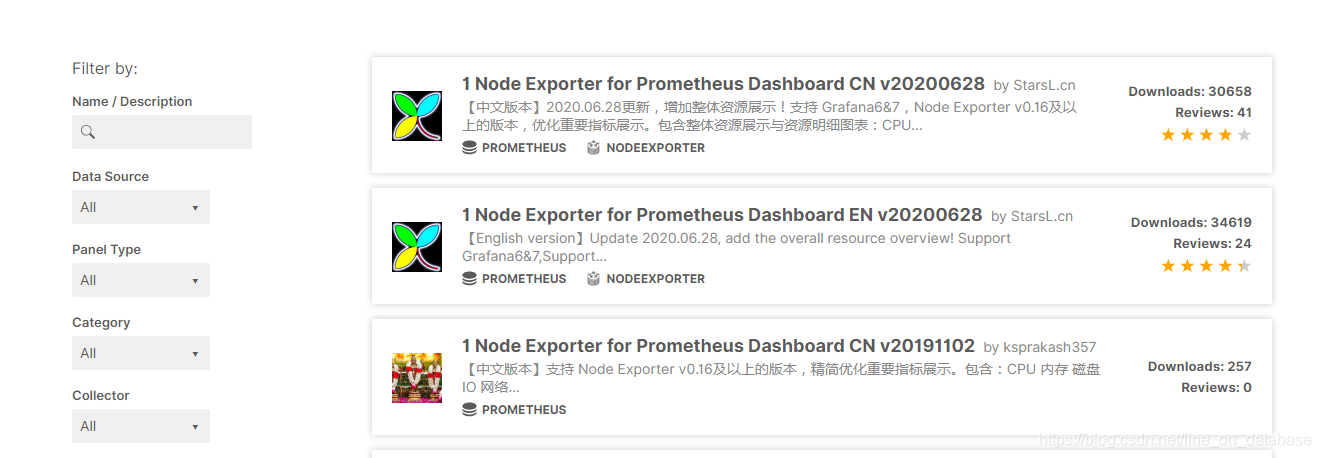
查看id
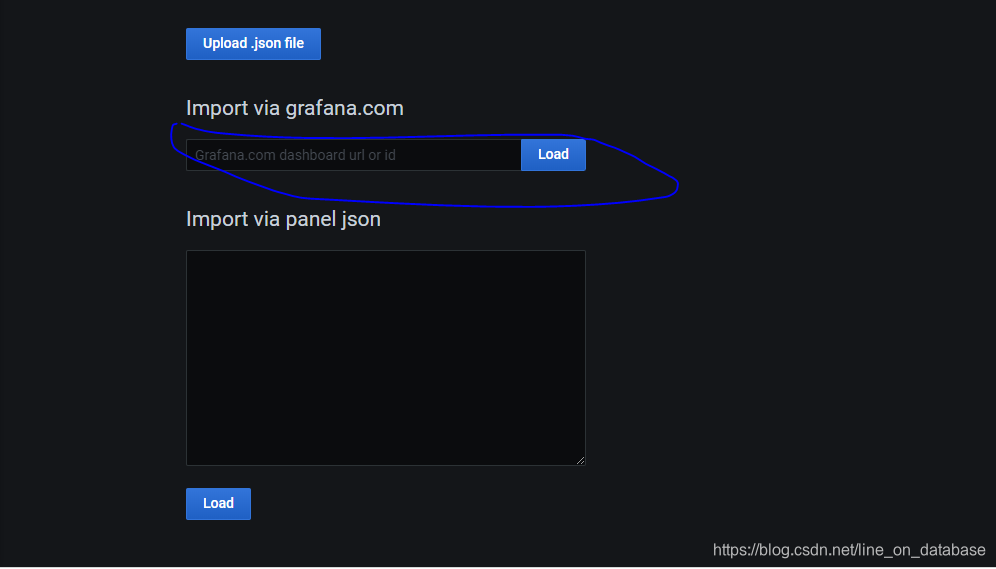
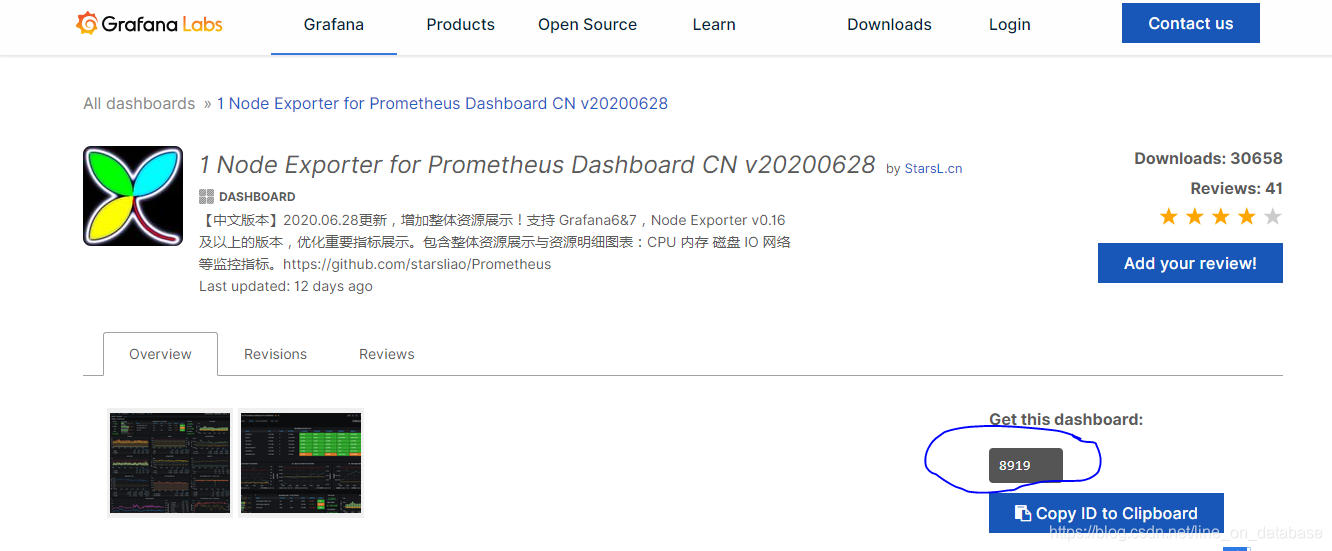 ?導入儀表盤
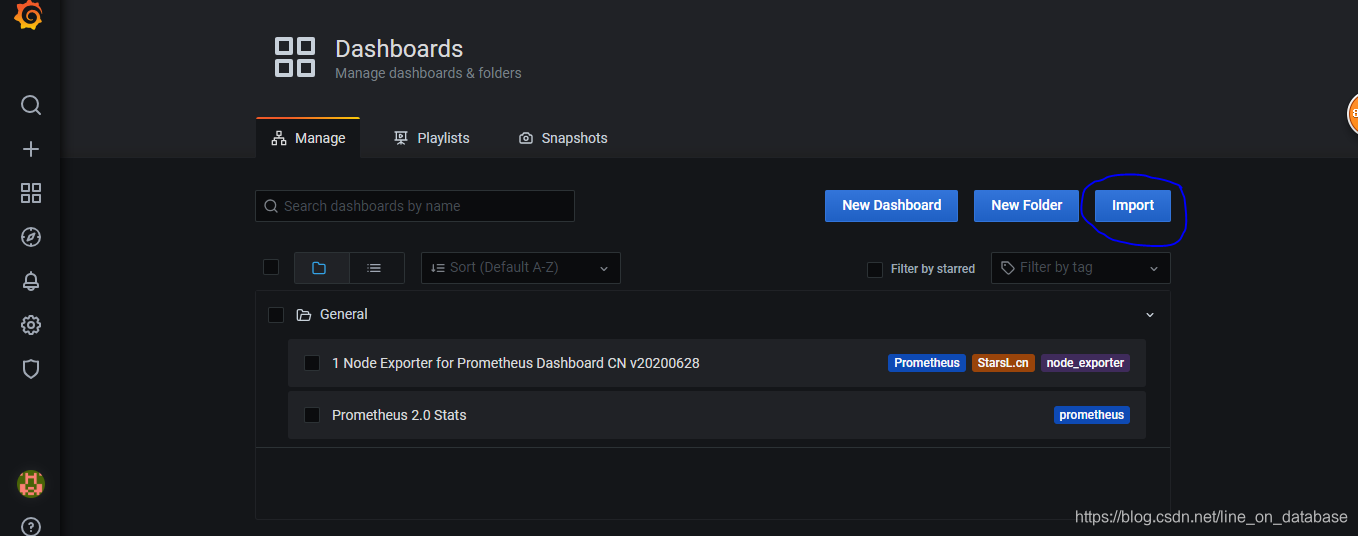
在文本框里輸入對應id即可導入


)


)


