多元線性回歸 python
Video Link
影片連結
This episode expands on Implementing Simple Linear Regression In Python. We extend our simple linear regression model to include more variables.
本集擴展了在Python中實現簡單線性回歸的方法 。 我們擴展了簡單的線性回歸模型以包含更多變量。
You can view the code used in this Episode here: SampleCode
您可以在此處查看 此劇 集中使用的代碼: SampleCode
Setting up your programming environment can be found in the first section of Ep 4.3.
可以在Ep 4.3的第一部分中找到設置您的編程環境的步驟 。
導入我們的數據 (Importing our Data)
The first step is to import our data into python.
第一步是將我們的數據導入python。
We can do that by going on the following link: Data
我們可以通過以下鏈接進行操作: 數據
Click on “code” and download ZIP.
單擊“代碼”并下載ZIP。
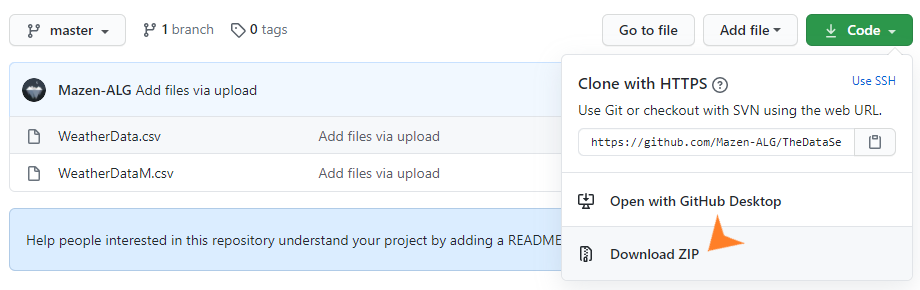
Locate WeatherDataM.csv and copy it into your local disc under a new file ProjectData
找到WeatherDataM.csv并將其復制到新文件ProjectData下的本地磁盤中
Note: Keep this medium post on a split screen so you can read and implement the code yourself.
注意:請將此帖子張貼在分屏上,以便您自己閱讀和實現代碼。
Now we are ready to implement our code into our Notebook:
現在我們準備將代碼實現到筆記本中:
# Import Pandas Library, used for data manipulation
# Import matplotlib, used to plot our data
# Import nump for mathemtical operationsimport pandas as pd
import matplotlib.pyplot as plt
import numpy as np# Import our WeatherDataM and store it in the variable weather_data_mweather_data_m = pd.read_csv("D:\ProjectData\WeatherDataM.csv")
# Display the data in the notebookweather_data_m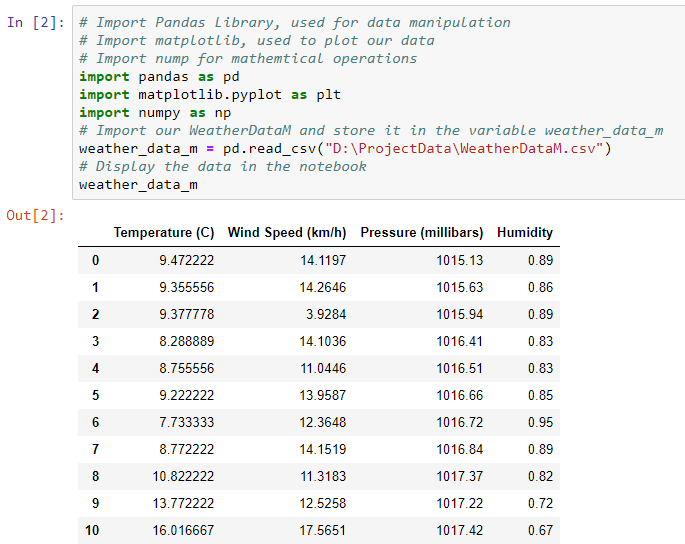
Here we can see a table with all the variables we will be working with.
在這里,我們可以看到一個包含所有要使用的變量的表。
繪制數據 (Plotting our Data)
Each of our inputs X (Temperature, Wind Speed and Pressure) must form a linear relationship with our output y (Humidity) in order for our multiple linear regression model to be accurate.
我們的每個輸入X(溫度,風速和壓力)必須與我們的輸出y(濕度)形成線性關系,以便我們的多元線性回歸模型準確。
Let’s plot our variables to confirm this.
讓我們繪制變量以確認這一點。
Here we follow common Data Science convention, naming our inputs X and output y.
在這里,我們遵循通用的數據科學約定 ,將輸入X和輸出y命名為。
# Set the features of our model, these are our potential inputsweather_features = ['Temperature (C)', 'Wind Speed (km/h)', 'Pressure (millibars)']# Set the variable X to be all our input columns: Temperature, Wind Speed and PressureX = weather_data_m[weather_features]# set y to be our output column: Humidityy = weather_data_m.Humidity# plt.subplot enables us to plot mutliple graphs
# we produce scatter plots for Humidity against each of our input variablesplt.subplot(2,2,1)
plt.scatter(X['Temperature (C)'],y)
plt.subplot(2,2,2)
plt.scatter(X['Wind Speed (km/h)'],y)
plt.subplot(2,2,3)
plt.scatter(X['Pressure (millibars)'],y)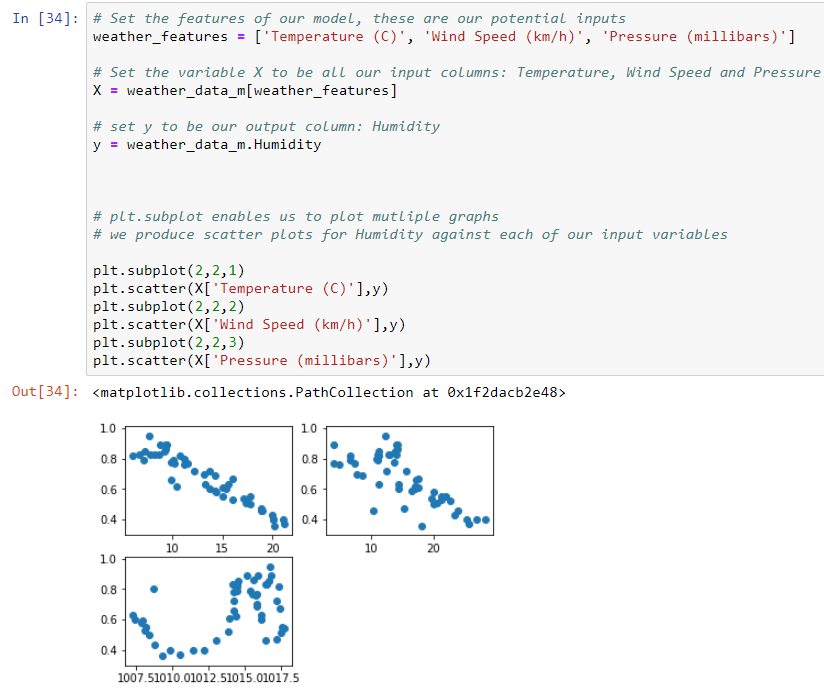
Humidity against Temperature forms a strong linear relationship ?
相對于溫度的濕度形成很強的線性關系 ?
Humidity against Wind Speed forms a linear relationship ?
濕度與風速成線性關系 ?
Humidity against Pressure forms no linear relationship ?
相對于壓力的濕度沒有線性關系 ?
Pressure can not be used in our model and is removed with the following code
壓力無法在我們的模型中使用,并通過以下代碼刪除
X = X.drop("Pressure (millibars)", 1)We specify the the column name went want to drop: Pressure (millibars)
我們指定要刪除的列名稱: 壓力(毫巴)
1 represents our axis number: 1 is used for columns and 0 for rows.
1代表我們的軸號:1代表列,0代表行。
Because we are working with just two input variables we can produce a 3D scatter plot of Humidity against Temperature and Wind speed.
因為我們僅使用兩個輸入變量,所以可以生成濕度相對于溫度和風速的3D散點圖 。
With more variables this would not be possible, as this would require a 4D + plot which we as humans can not visualise.
有了更多的變量,這將是不可能的,因為這將需要我們人類無法看到的4D +圖。
# Import library to produce a 3D plotfrom mpl_toolkits.mplot3d import Axes3Dfig = plt.figure()
ax = fig.add_subplot(111, projection='3d')x1 = X["Temperature (C)"]
x2 = X["Wind Speed (km/h)"]ax.scatter(x1, x2, y, c='r', marker='o')# Set axis labelsax.set_xlabel('Temperature (C)')
ax.set_ylabel('Wind Speed (km/h)')
ax.set_zlabel('Humidity')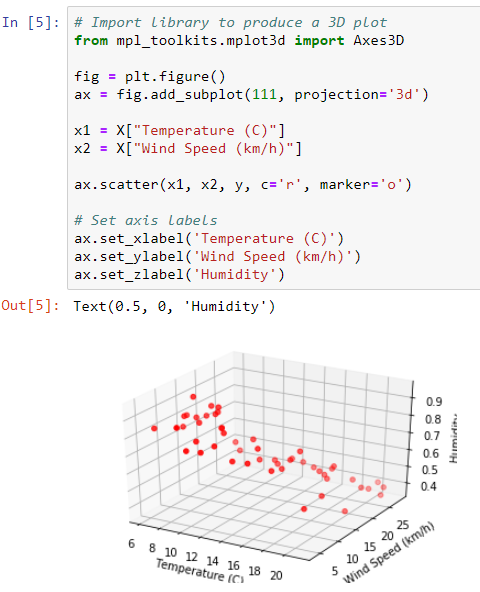
實現多元線性回歸 (Implementing Multiple Linear Regression)
In order to calculate our Model we need to import the LinearRegression model from Sci-kit learn library. This function enables us to calculate the parameters for our model (θ?, θ? and θ?) with one line of code.
為了計算我們的模型,我們需要從Sci-kit學習庫中導入LinearRegression模型。 此功能使我們能夠使用一行代碼來計算模型的參數 ( θ?,θ?和θ2) 。
from sklearn.linear_model import LinearRegression# Define the variable mlr_model as our linear regression model
mlr_model = LinearRegression()
mlr_model.fit(X, y)
We can then display the values for θ?, θ? and θ?:
然后我們可以顯示θ?,θ和θ2的值:
θ? is the intercept
θ?是截距
θ? and θ? are what we call co-efficients of the model as the come before our X variables.
θ?和θ2是我們所謂的模型系數 ,即X變量之前的系數。
theta0 = mlr_model.intercept_
theta1, theta2 = mlr_model.coef_theta0, theta1, theta2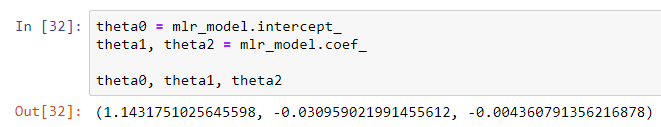
Giving our multiple linear regression model as:
給出我們的多元線性回歸模型為:
? = 1.14–0.031𝑥1- 0.004𝑥2
?= 1.14–0.031𝑥1-0.004𝑥2
使用我們的回歸模型進行預測 (Using our Regression Model to make predictions)
Now we have calculated our Model, it’s time to make predictions for Humidity given a Temperature and Wind speed value:
現在我們已經計算了模型,是時候根據溫度和風速值對濕度進行預測了:
y_pred = mlr_model.predict([[15, 21]])
y_pred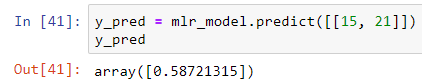
So a temperature of 15 °C and Wind speed of 21 km/h expects to give us a Humidity of 0.587.
因此,溫度為15°C,風速為21 km / h,預計濕度為0.587。
邊注 (Side note)
We reshaped all of our inputs into 2D arrays by using double square brackets ( [[]] ) which is a much more efficient method.
我們使用雙方括號([[]])將所有輸入重塑為2D數組,這是一種更為有效的方法。
如果您有任何疑問,請將其留在下面,希望在下一集見。 (If you have any questions please leave them below and I hope to see you in the next episode.)
翻譯自: https://medium.com/ai-in-plain-english/implementing-multiple-linear-regression-in-python-1364fc03a5a8
多元線性回歸 python
本文來自互聯網用戶投稿,該文觀點僅代表作者本人,不代表本站立場。本站僅提供信息存儲空間服務,不擁有所有權,不承擔相關法律責任。 如若轉載,請注明出處:http://www.pswp.cn/news/388411.shtml 繁體地址,請注明出處:http://hk.pswp.cn/news/388411.shtml 英文地址,請注明出處:http://en.pswp.cn/news/388411.shtml
如若內容造成侵權/違法違規/事實不符,請聯系多彩編程網進行投訴反饋email:809451989@qq.com,一經查實,立即刪除!相關文章

關于apache和tomcat集群,線程是否占用實驗

爬蟲之數據解析的三種方式

相對于硬件計算機軟件就是,計算機的軟件是將解決問題的方法,軟件是相對于硬件來說的...

數據冒險控制冒險_勞動生產率和其他冒險

如何把一個java程序打包成exe文件,運行在沒有java虛

Java后端WebSocket的Tomcat實現

加速業務交付,從 GKE 上使用 Kubernetes 和 Istio 開始

knn 鄰居數量k的選取_選擇K個最近的鄰居
![計算機網絡中 子網掩碼的算法,[網絡天地]子網掩碼快速算法(轉載)](http://pic.xiahunao.cn/計算機網絡中 子網掩碼的算法,[網絡天地]子網掩碼快速算法(轉載))
計算機網絡中 子網掩碼的算法,[網絡天地]子網掩碼快速算法(轉載)

EXTJS+JSP上傳文件帶進度條

android Json詳解


什么樣的代碼是好代碼_什么是好代碼?

nginx比較apache

計算機主板各模塊復位,電腦主板復位電路工作原理分析

Docker制作dotnet core控制臺程序鏡像

【362】python 正則表達式

在Python中使用Twitter Rest API批量搜索和下載推文

第一套數字電子計算機,計算機試題第一套
