前言
Z檢驗
T檢驗
獨立樣本t檢驗
配對樣本t檢驗
單樣本t檢驗
前言
在這篇文章中,我不會具體去推導檢驗統計量和相應拒絕域的得出,這對于大部分非統計學專業的人士來說是晦澀的,我只想通過一個案例告訴大部分初學者假設檢驗怎么在數據挖掘中使用。
%matplotlib?inline
import?matplotlib.pyplot?as?plt
import?pandas?as?pd
import?numpy?as?np
import?seaborn?as?sns
from?scipy?import?stats
from?statsmodels.stats?import?weightstats?as?mstats
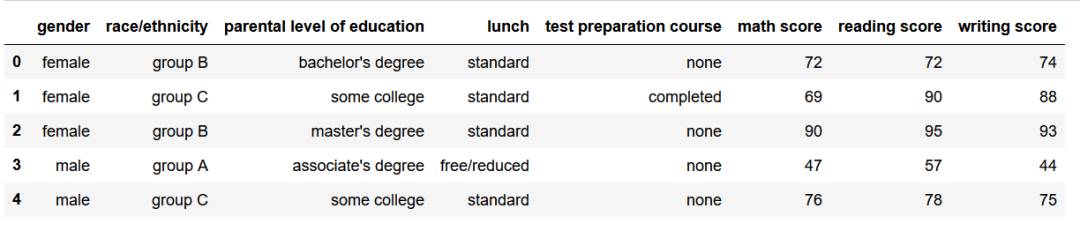
df_exams?=?pd.read_csv('./StudentsPerformance.csv')
df_exams.head()
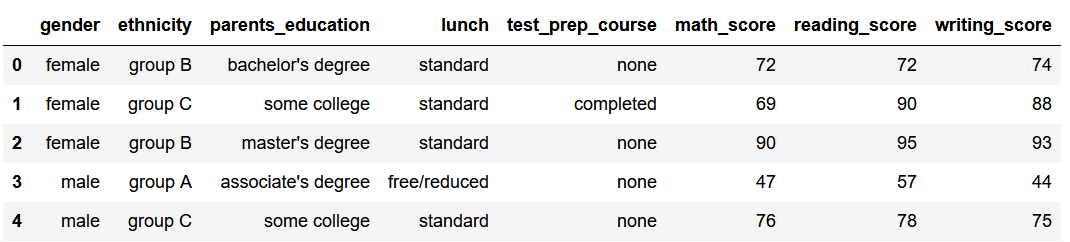
df_exams.rename(columns={'race/ethnicity':'ethnicity'},inplace=True)
df_exams.rename(columns={'parental?level?of?education':'parents_education'},inplace=True)
df_exams.rename(columns={'test?preparation?course':'test_prep_course'},inplace=True)
df_exams.rename(columns={'math?score':'math_score'},inplace=True)
df_exams.rename(columns={'reading?score':'reading_score'},inplace=True)
df_exams.rename(columns={'writing?score':'writing_score'},inplace=True)
查看前5行的信息
df_exams.head()
接下來查看類別型數據是否均勻,數值型數據是否服從正態分布。
df_exams['ethnicity'].value_counts()
group C    319
group D    262
group B    190
group E    140
group A     89
Name: ethnicity, dtype: int64
以宗族信息這一列為例,可以看出C的占比較重,group A 只有89例。這也就說明當選擇從每個group抽取80個樣本是不合適的,因為這對A來說每次抽取,樣本信息幾乎沒有發生什么變化。
exams?=?['math_score','reading_score','writing_score']
for?exam?in?exams:
????y?=?df_exams[exam]
????plt.figure(1);?plt.title('Normal')
????sns.distplot(y,?kde=False,?fit=stats.norm)
????plt.figure(2);?plt.title('Johnson?SU')
????sns.distplot(y,?kde=False,?fit=stats.johnsonsu)
????fig?=?plt.figure()
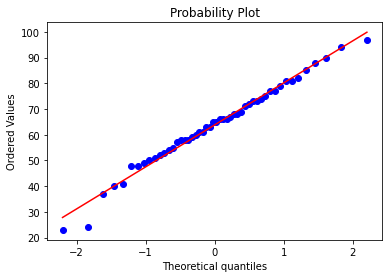
????res?=?stats.probplot(df_exams[exam],?plot=plt)
????plt.show()
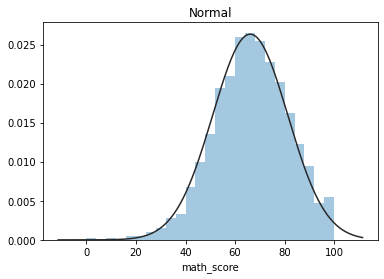
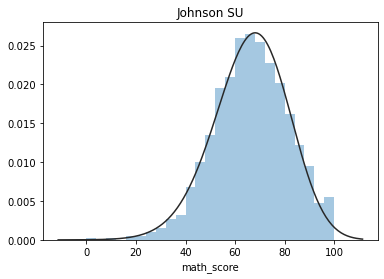
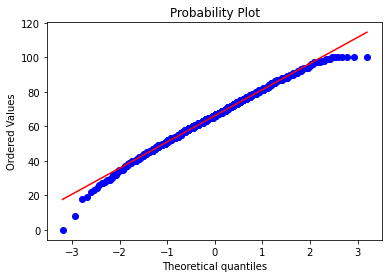
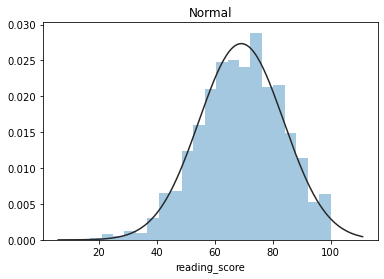
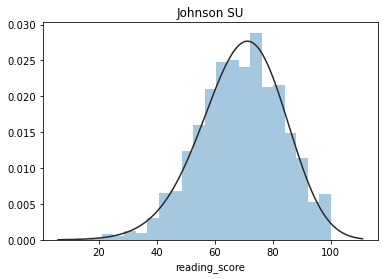
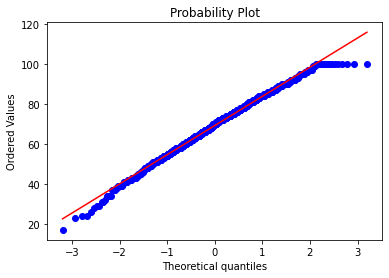
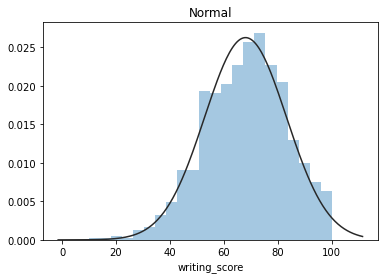
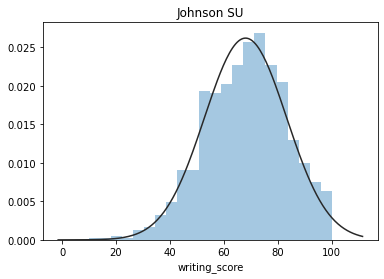
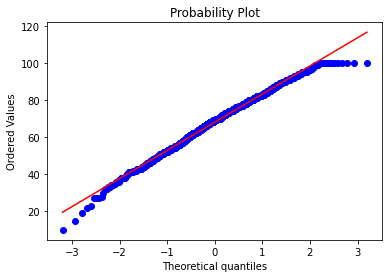
這些圖片說明數據并不是完全服從正態分布,密度函數的尾部與正態分布有些偏離,但大體還是可以認為近似服從正態分布的,如果數據不服從正態分布,Z檢驗和T檢驗將是無法使用的。到目前為止請注意,我們用的都是全部的數據喲,而假設檢驗的思想是用樣本的信息來推斷總體的信息,所以接下來我們要從總體中取出樣本。
#?從總體中隨機抽取一定比例的樣本
df_exams?=?df_exams.sample(frac=1)
假設檢驗被用來以科學嚴謹的方式檢驗一個關于數據的理論,這樣我們就不會僅僅依賴于偶然性或主觀假設。接下來我們要進行的是兩個正態總體均值的檢驗,以學生分數為例,就是去檢驗兩個不同的group的分數是否有明顯的不同 。當建立一個假設檢驗時,有一個原假設和一個備擇假設。還必須設置顯著性水平,通常為5%(Scipy,statsmodel)。假設檢驗可以分為單尾或雙尾。單尾的情況,例如,“A組得分>B組”。雙尾的情況例如“A組的得分與B組不同”。簡單介紹了這些 接下來,我們從a組和B組各抽取50名學生作為樣本,然后計算該數據樣本的Z分數。
?z分數可以回答這樣一個問題:“一個給定數距離平均數多少個標準差?”,在平均數之上的分數會得到一個正的標準分數,在平均數之下的分數會得到一個負的標準分數。z分數是一種可以看出某分數在分布中相對位置的方法。
?
group_a_sample?=?df_exams[df_exams['ethnicity']?==?'group?A']
group_a_sample?=?group_a_sample[:50]
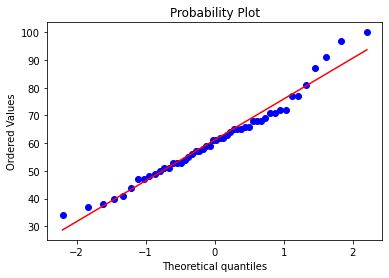
#?繪制QQ圖,檢驗正態性
fig?=?plt.figure()
res?=?stats.probplot(group_a_sample['math_score'],?plot=plt)
plt.show()
group_b_sample?=?df_exams[df_exams['ethnicity']?==?'group?B']
group_b_sample?=?group_b_sample[:50]
fig?=?plt.figure()
res?=?stats.probplot(group_b_sample['math_score'],?plot=plt)
plt.show()
print(stats.zscore(group_a_sample['math_score']))
print(stats.zscore(group_b_sample['math_score']))
[ 0.47126865  0.05544337  2.06526555  0.26335601  0.33266022 -0.01386084
  0.26335601 -0.77620719  0.05544337  0.54057286 -1.67716196 -0.01386084
 -0.91481561  2.68900347 -1.19203247  1.37222342 -0.70690297 -0.56829455
  0.7484855  -0.56829455 -0.70690297 -0.49899034  0.26335601  1.09500657
  0.67918129 -1.60785775  0.33266022  0.47126865 -0.2910777  -0.36038191
  0.67918129 -0.8455114  -1.8850746  -0.42968612  0.7484855  -1.46924932
 -0.98411983  1.09500657 -0.98411983  0.47126865 -0.15246927  1.7880487
 -0.2910777   0.1940518  -0.15246927 -0.56829455  0.12474758  2.48109083
 -0.22177348 -1.39994511]
[-0.68278212 -2.57240054 -0.05290932 -1.69057861  0.26202709 -0.17888388
 -0.24187116  0.57696349 -0.7457694  -0.17888388  0.70293805  0.82891261
  0.45098893 -0.36784572  0.82891261  0.07306525 -0.93473124 -0.430833
  0.26202709 -0.99771852  1.33281086 -0.87174396  1.5217727   1.89969638
  1.08086173 -0.80875668  0.57696349  0.13605253 -0.99771852  0.63995077
  0.51397621 -1.43862949  2.08865822 -0.36784572  1.64774726 -2.50941326
 -0.55680756 -0.36784572 -0.05290932  1.14384902 -1.50161677  0.32501437
  0.07306525  0.13605253  0.13605253  0.95488717  1.08086173 -0.61979484
  0.19903981 -0.30485844]
Z檢驗
下面的代碼是z測試的一個示例。測試是看A組樣本的“數學平均得分”是否小于總體平均值。
A組學生的平均“數學成績”與總體平均值相同。
A組學生的平均“數學成績”小于總體平均值。
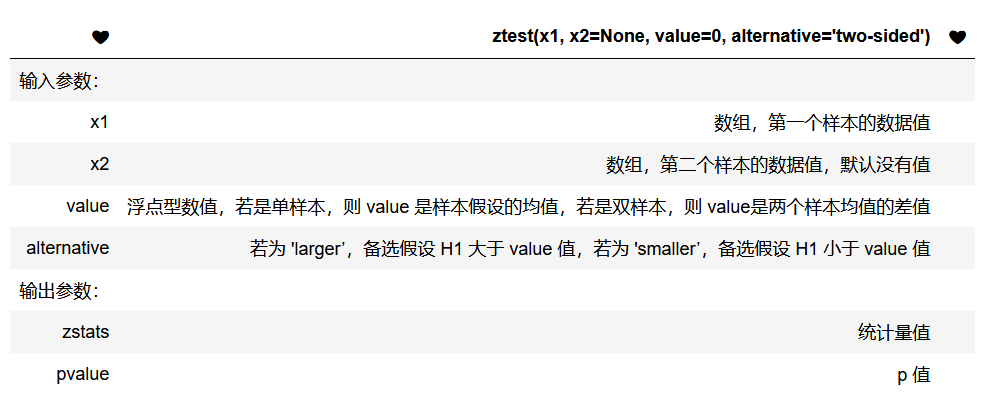
首先介紹一下statsmodels 包中的 ztest 函數的一般用法如下:
#?計算總體均值和樣本均值
population_mean?=?df_exams['math_score'].mean()
sample_group_a_mean?=?group_a_sample['math_score'].mean()
print(population_mean,sample_group_a_mean)

#?這是單樣本檢驗
zstats,?pvalue?=?mstats.ztest(group_a_sample['math_score'],x2=None,value=population_mean,alternative='smaller')
print(pvalue)
66.089 61.2
0.008850880637695917
可以看出P值非常的小,小于5%,則在顯著性水平為5%的條件下,我們要拒絕原假設
T檢驗
在T檢驗中,假設樣本為正態分布,且總體參數未知。有3種情況:
獨立樣本t檢驗,比較兩個樣本所代表的兩個總體均值是否存在顯著差異。除了要求樣本來自正態分布,還要求兩個樣本的總體方差相等(ttest_ind)
配對樣本t檢驗,配對樣本主要是同一實驗前后效果的比較,或者同一樣品用兩種方法檢驗結果的比較。可以把配對樣本的差作為變量(ttest_rel)
單樣本t檢驗,單樣本t檢驗是樣本均值與總體均值的比較問題。其中總體服從正態分布,總體的方差未知,從正態總體中抽樣得到n個個體組成抽樣樣本,計算抽樣樣本均值和標準差,判斷總體均值與抽樣樣本均值是否相同。(ttest_1samp)
下面是這3個假設檢驗的例子。注意:樣本的隨機性導致他們可能通過也可能不通過假設,所以可能你得到的結論和我不同。
獨立樣本t檢驗
讓我們來看看A組和B組在“數學成績”功能上的得分是否不同。
=樣本組A的平均“數學成績”與樣本組B相同。
=樣本組A的平均“數學成績”與樣本組B不同。
在5%顯著性水平下測試。這是一個雙尾檢驗。
#?當不確定兩總體方差是否相等時,應先利用levene檢驗,檢驗兩總體是否具有方差齊性。
print(stats.levene(group_a_sample['math_score'],group_b_sample['math_score']))
print(group_a_sample['math_score'].var(),group_b_sample['math_score'].var())

tscore,pvalue?=?stats.ttest_ind(group_a_sample['math_score'],group_b_sample['math_score'],equal_var=False)
print(pvalue)

print(group_a_sample['math_score'].mean(),group_b_sample['math_score'].mean())
LeveneResult(statistic=0.3789408560110682, pvalue=0.5395976230546553)
212.44897959183675 257.1983673469388
0.39114162148079246
61.2 63.84
P值小于5%,則在顯著性水平為5%的條件下,我們應拒絕原假設,認為兩組成績不相同。
配對樣本t檢驗
接下來看看A組在“數學成績”和“閱讀成績”上的得分是否不同。
=樣本組A的平均“數學成績”與“閱讀成績”相同。
=樣本組A的平均“數學成績”與“閱讀成績”不同。
在5%顯著性水平下測試。使用ttest_rel,這是一個雙尾檢驗。
tscore,pvalue?=?stats.ttest_rel(group_a_sample['math_score'],group_a_sample['reading_score'])
print(pvalue)

print(group_a_sample['math_score'].mean(),group_a_sample['reading_score'].mean())
0.025329567098176128
61.2 64.26
P值小于5%,則在顯著性水平為5%的條件下,我們應拒絕原假設,認為兩個科目的成績不相同。
單樣本t檢驗
讓我們看看A組樣本的平均“數學分數”是否與總體平均值相同。
=樣本組A的平均“數學成績”與總體“數學成績”平均值相同。
=樣本組A的平均“數學成績”與總體“數學成績”平均數不同。
在5%顯著性水平下測試。這是一個雙尾測試。
tscore,pvalue?=?stats.ttest_1samp(group_a_sample['math_score'],df_exams['math_score'].mean())
print(pvalue)

print(group_a_sample['math_score'].mean(),df_exams['math_score'].mean())
0.02167469754070706
61.2 66.089
P值小于5%,則在顯著性水平為5%的條件下,我們應拒絕原假設。
后期文章將會涉及其他類型的檢驗,方差分析,一元回歸分析等,我將盡量減少不必要的數學推導公式,把最通俗易懂的內容呈現給大家。
由于微信平臺算法改版,公號內容將不再以時間排序展示,如果大家想第一時間看到我們的推送,強烈建議星標我們和給我們多點點【在看】。星標具體步驟為:
(1)點擊頁面最上方“小詹學Python”,進入公眾號主頁。
(2)點擊右上角的小點點,在彈出頁面點擊“設為星標”,就可以啦。
感謝支持,比心。


)


)


