由于項目的需要,需要畫一個折線圖。
傳統的Teechart、MSChart、HighSpeedChart一般是只能配置在x86系統下,等到使用x64系統下運行就是會報出不知名的錯誤,這個地方讓人很苦惱。
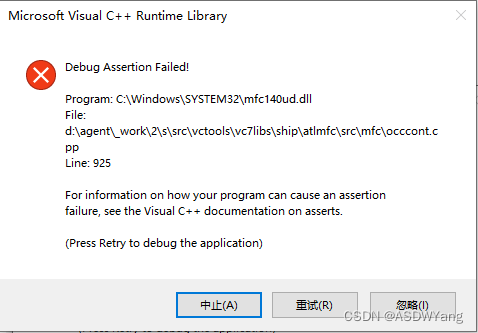
我在進行配置的過程之中,使用Teechart將x86配置好了,可以正常使用,但是嫁接到x64系統下就不可以使用了。HighSpeedChart也是同樣在x64系統下使用會出現如下錯誤,并且在進行設置x軸的時候,x軸類型只能是int類型,賊其難用。配置了半天結果x64位用不了,x64系統真的不建議使用上述控件方式。
經過長時間的思索,還是直接用代碼畫一個吧,配置環境過于困難。
首先拉出一個Picture?Control控件,然后將其ID進行更改為IDC_PIC_CTRL

在自己的.h文件之中進行定義變量
?CStatic m_PicCtrl2;CRect m_rect;然后在相應的按鈕下進行功能的定義(以依次修改按鈕為例)
// TODO: 在此添加控件通知處理程序代碼
int click = 6;
std::vector<CString> use;
std::vector<std::string> xAxisLabels = { "0"};
std::vector<double> yAxisValues = { 0 };void CMFCApplication2Dlg::OnBnClickedButton5()
{CPaintDC dc(this); // 使用設備上下文繪制// 清空窗口CRect rect;GetClientRect(&rect); // 獲取繪制區域大小dc.FillSolidRect(rect, RGB(255, 255, 255)); // 填充白色背景// 繪制圖形的代碼// ...CWnd* pWnd = GetDlgItem(IDC_PIC_CTRL); // 獲取Picture Control的指針pWnd->GetClientRect(&rect); // 獲取繪制區域大小CDC* pDC = pWnd->GetDC(); // 獲取繪圖設備上下文// 繪制背景pDC->FillSolidRect(rect, RGB(255, 255, 255));// 設置坐標軸參數int marginX = rect.Width() / 8.0;int marginY = rect.Height() / 8.0;time_t now = time(0);tm* localTime = localtime(&now);char buffer[80];strftime(buffer, 80, "%Y-%m-%d 仰角角度測量試驗", localTime);CString cstringTime(buffer);CString chartTitle = (cstringTime) ;CString xAxisTitle = _T("時間(時:分:秒)");CString yAxisTitle = _T("角度(°)");// 繪制橫軸線和縱軸線pDC->MoveTo(rect.left + marginX + 3, rect.bottom - marginY * 1.5);pDC->LineTo(rect.right - marginX, rect.bottom - marginY * 1.5);pDC->MoveTo(rect.left + marginX, rect.top + marginY * 1.5);pDC->LineTo(rect.left + marginX, rect.bottom - marginY * 1.5 - 3);// 繪制箭頭線/*pDC->MoveTo(rect.right - marginX, rect.bottom - marginY * 1.5);pDC->LineTo(rect.right - marginX - 6.0, rect.bottom - marginY * 1.5 - 6.0);pDC->MoveTo(rect.right - marginX, rect.bottom - marginY * 1.5);pDC->LineTo(rect.right - marginX - 6.0, rect.bottom - marginY * 1.5 + 6.0 );*/// 繪制坐標軸標題pDC->SetBkMode(TRANSPARENT);// 設置大標題文本顏色pDC->SetTextColor(RGB(0, 0, 255)); // 深藍色// 設置大標題文本粗細CFont font;font.CreateFont(16, 0, 0, 0, FW_BOLD, FALSE, FALSE, FALSE, DEFAULT_CHARSET, OUT_DEFAULT_PRECIS,CLIP_DEFAULT_PRECIS, DEFAULT_QUALITY, DEFAULT_PITCH | FF_SWISS, _T("Arial")); // 創建一個16像素的粗體Arial字體pDC->SelectObject(&font); // 設置字體pDC->TextOut(rect.Width() / 2, rect.bottom - marginY * 0.5, chartTitle);//大標題// 設置大標題文本顏色pDC->SetTextColor(RGB(0, 0, 0)); // 黑色pDC->TextOut(rect.left + (double)marginX * 7.2, rect.bottom - marginY * 1.6, xAxisTitle);//x軸標題pDC->TextOut(rect.left + marginX - 30, rect.top + marginY / 2, yAxisTitle);//Y軸標題//std::vector<std::string> xAxisLabels = { "0","北京", "上海", "南京" };//std::vector<double> yAxisValues = { 0,0.2, 0.5, 1.8 };std::string currentTime = getCurrentTimeAsString();//點擊次數增加if (yAxisValues.size() == 1){xAxisLabels.push_back(currentTime);yAxisValues.push_back(2.2);}else if (yAxisValues.size() == 2){xAxisLabels.push_back(currentTime);yAxisValues.push_back(4.2);}else if (yAxisValues.size() == 3){xAxisLabels.push_back(currentTime);yAxisValues.push_back(1.2);}else if (yAxisValues.size() == 4){xAxisLabels.push_back(currentTime);yAxisValues.push_back(2.2);}else if (yAxisValues.size() == 5){xAxisLabels.push_back(currentTime);yAxisValues.push_back(6.2);}else if (yAxisValues.size() == 6){xAxisLabels.push_back(currentTime);yAxisValues.push_back(5.2);}else{//當點擊次數大于六次xAxisLabels.erase(xAxisLabels.begin());yAxisValues.erase(yAxisValues.begin());xAxisLabels.push_back(currentTime);yAxisValues.push_back(8.2);}int numPoints = yAxisValues.size();int xInterval = (rect.Width() - 2 * marginX) / (numPoints - 1);//x軸間隔int yInterval = (rect.Height() - 2 * marginY) / (13 - 1);//y軸間隔   這個地方的是縱軸的最大數量// 繪制橫軸標簽刻度for (int i = 0; i < numPoints; i++){int x = rect.left + marginX + i * xInterval;CPen pen;pen.CreatePen(PS_SOLID, 1, RGB(0, 0, 210)); // 創建一個紅色的實線畫筆pDC->SelectObject(&pen); // 設置畫筆pDC->MoveTo(x, rect.bottom - marginY * 1.5); //橫軸小標記pDC->LineTo(x, rect.bottom - marginY * 1.5 + 5);pDC->TextOut(x - 10, rect.bottom - marginY * 1.5 + 10, CString(xAxisLabels[i].c_str()));}//將最大的值進行/12操作,for (int i = 0; i < 13; i++)//重新繪制縱軸  這個地方的8是最大值{// 尋找最大值的迭代器auto maxIt = std::max_element(yAxisValues.begin(), yAxisValues.end());double maxValue;// 如果找到了最大值,則打印它if (maxIt != yAxisValues.end()){maxValue = *maxIt;}CPen pen;pen.CreatePen(PS_SOLID, 1, RGB(0, 0, 210)); // 創建一個紅色的實線畫筆pDC->SelectObject(&pen); // 設置畫筆double y = (double)(rect.bottom) - (double)marginY * 1.5 - ((double)10.0 / (double)12.0 * (double)i) * (double)yInterval; //根據實際大小進行設定  這個地方需要注意yInterval變量與pDC->MoveTo(rect.left + marginX, y);     //縱軸小標記pDC->LineTo(rect.left + marginX - 5, y);double value = (maxValue / (double)12.0) * (double)i; // 假設i是一個整數變量std::stringstream ss;ss << std::fixed << std::setprecision(4) << value;std::string strValue = ss.str();CString cstrValue(strValue.c_str());pDC->TextOut(rect.left + marginX * 0.8 - 30, y - 5, cstrValue);}// 繪制折線for (int i = 0; i < numPoints - 1; i++){int x1 = rect.left + marginX + i * xInterval;int y1 = rect.bottom - marginY * 1.5 - (yAxisValues[i]*12.0/10.0) * yInterval;int x2 = rect.left + marginX + (i + 1) * xInterval;int y2 = rect.bottom - marginY * 1.5 - (yAxisValues[i + 1]*12.0/10.0) * yInterval;CPen pen;pen.CreatePen(PS_SOLID, 1, RGB(125, 0, 0)); // 創建一個紅色的實線畫筆pDC->SelectObject(&pen); // 設置畫筆pDC->MoveTo(x1, y1);pDC->LineTo(x2, y2);pDC->SetTextColor(RGB(255, 0, 0)); // 深藍色//繪制數值pDC->TextOut(x2 - 8, y2 - 20, CString(std::to_string(yAxisValues[i+1]).c_str()));//這個地方的標記需要變成4個小數點}pWnd->ReleaseDC(pDC);
}
在使用上述代碼的時候需要進行頭文件的引入
#include <iostream>
#include <iomanip>
#include <sstream>
#include <string>
#include <atlstr.h>#include <iostream>
#include <ctime>
#include <cstring>#include <iostream>
#include <sstream>
#include <chrono>
using namespace std;
最后測試的展示情況是如下所示: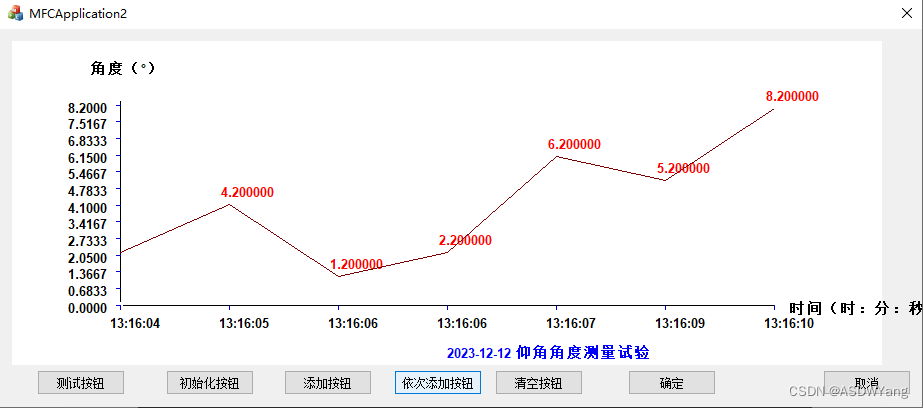
上述的依次添加按鈕是按下一次,添加一個折現,只是個示例的過程,也可以改為實時動態的過程,只要添加個定時器就可以了,比較簡單。關于界面部分,自己進行修改修改,進行美化一下就可以使用了。上述代碼比較通俗易懂,按照自己的邏輯寫的。

)
)
)
![力扣每日一題day34[110. 平衡二叉樹]](http://pic.xiahunao.cn/力扣每日一題day34[110. 平衡二叉樹])

![[ 藍橋杯Web真題 ]-冬奧大抽獎](http://pic.xiahunao.cn/[ 藍橋杯Web真題 ]-冬奧大抽獎)


