前言
前面的文章我們已經介紹了如何獲取滬深300成分股所述行業以及權重的數據,想要了解這部分內容的小伙伴可以閱讀上一篇文章
springboot+jdbcTemplate+sqlite編程示例——以滬深300成分股數據處理為例-CSDN博客
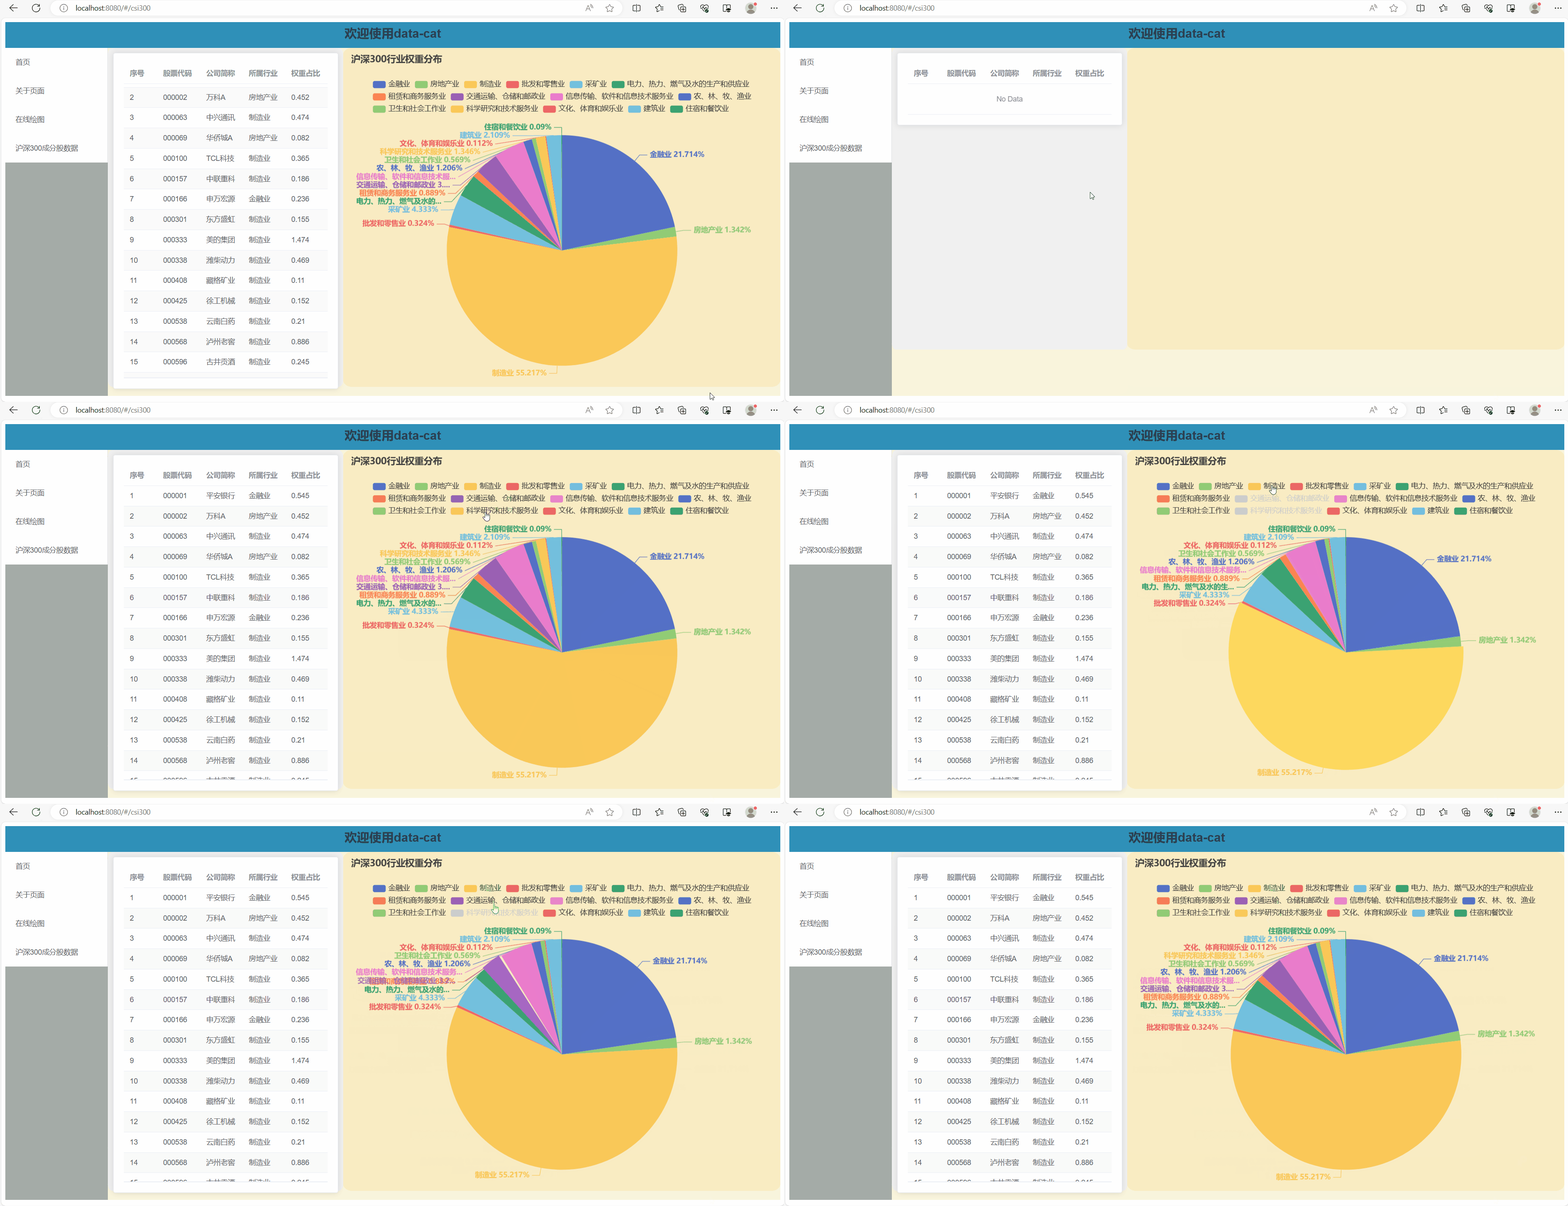
那么有了上文獲取的數據,我們實際上可以計算一下滬深300按照行業分布的權重占比數據,最后的成果如下所示

?是不是效果還挺酷的,下面就來介紹一下技術細節。
后端技術細節
首先來講一下后端的技術細節,其實后端需要做的就是從表中獲取按行業區分的權重數據,我們先來看一下數據表

數據表中包含了所述行業和權重占比,那么思路就很明確了,我們只需要查出所有的行業,然后按照行業統計權重之和就行了。
我們的實體類非常簡單,就是所屬行業和對應的權重
@Data
@AllArgsConstructor
@NoArgsConstructor
public class CSI300DistVO {private String industry;private Double weight;}
接著就是使用JdbcTemplate將數據查出來
public List<CSI300DistVO> queryDist() {// 首先查詢所有的行業String sql = "SELECT DISTINCT industry FROM "+ tableName;List<String> industrys = jdbcTemplate.queryForList(sql, String.class);// 查詢每個行業的權重和List<CSI300DistVO> csi300DistVOList = new ArrayList<>();for(int i=0; i<industrys.size(); i++) {sql = "SELECT SUM(weight) FROM " + tableName +" WHERE industry=?";Object[] params = new Object[] {industrys.get(i),};Double weight = jdbcTemplate.queryForObject(sql, params,Double.class);// 保留四位小數String tmp = String.format("%.4f", weight);weight = Double.parseDouble(tmp);CSI300DistVO entity = new CSI300DistVO(industrys.get(i), weight);csi300DistVOList.add(entity);log.info(entity.toString());}return csi300DistVOList;}?然后通過get請求提供查詢服務
@RequestMapping("/queryDist")@ResponseBodypublic String queryDist() {List<CSI300DistVO> csi300DistVOS = sqlIteCSI300Dao.queryDist();return JSON.toJSONString(csi300DistVOS);}最后獲取的數據如下
[{"industry": "金融業","weight": 21.714
}, {"industry": "房地產業","weight": 1.342
}, {"industry": "制造業","weight": 55.217
}, {"industry": "批發和零售業","weight": 0.324
}, {"industry": "采礦業","weight": 4.333
}, {"industry": "電力、熱力、燃氣及水的生產和供應業","weight": 3.193
}, {"industry": "租賃和商務服務業","weight": 0.889
}, {"industry": "交通運輸、倉儲和郵政業","weight": 3.242
}, {"industry": "信息傳輸、軟件和信息技術服務業","weight": 4.308
}, {"industry": "農、林、牧、漁業","weight": 1.206
}, {"industry": "衛生和社會工作業","weight": 0.569
}, {"industry": "科學研究和技術服務業","weight": 1.346
}, {"industry": "文化、體育和娛樂業","weight": 0.112
}, {"industry": "建筑業","weight": 2.109
}, {"industry": "住宿和餐飲業","weight": 0.09
}]
后端的邏輯非常簡單,下面來介紹一下前端的技術細節。?
前端技術細節
前端我們采用的技術棧是vue+elemenet-plus+axios+echarts,思路大概就是都使用axios請求后端的數據,等到數據獲取到了然后再將echarts圖標繪制到頁面上。
這里面主要是echart餅圖的繪制,這里面我研究了好久,參數還挺多的,我會著重介紹一下。
我們之前說過,整個過程就是首先使用axios通過get請求獲取后端數據,然后再進行圖標的渲染,我們知道axios的請求是異步的,我們需要首先請求數據,等到數據請求成功后再進行圖表的繪制。
下面我將繪制餅狀圖的代碼都貼出來
// 繪制餅狀圖create_pie() {var url = "http://localhost:9001/queryDist";axios.get(url).then((response) => {console.log(response);for (var i = 0; i < response.data.length; i++) {this.pie_data.push({value: response.data[i].weight,name: response.data[i].industry,});}console.log(this.pie_data);var myChart = this.echarts.init(this.$refs["myChart"]);var option = {title: {text: "滬深300行業權重分布", //標題},tooltip: {},legend: {y: 50,textStyle: {fontSize: 14,},},label: {show: true,},series: [{name: "分布", //數據的名字type: "pie", //表示柱狀圖radius: "70%", //圓的半徑center: ["50%", "60%"],label: {formatter: function (params) {console.log(params.name + " " + params.value + "%");return params.name + " " + params.value + "%";},textStyle: {fontSize: 14,fontWeight: "bolder",},color: "inherit",},data: this.pie_data,selectedMode: "single", //選中效果,使選中區域偏離圓心一小段距離,single或者multipleselectedOffset: 10, //偏離圓心的一小段距離},],};// 使用剛指定的配置項和數據顯示圖表。myChart.setOption(option);}).catch((error) => {console.log(error);});},我們介紹一些比較重要的參數,繪制的時候比較重要的參數都在series中

series中對應的參數如下:?
- name:名稱
- type:圖標的類型,當設置成"pie"的時候表示餅狀圖
- radues:表示餅狀圖半徑的大小
- center:表示圓心在畫面中的位置,橫著的是x軸,豎著的是y軸,我這樣設置就會讓餅狀圖中屏幕中間偏下的位置,方便上方標簽的顯示
- label:表示餅狀圖中標簽的文字顯示
- formatter表示我們要顯示標簽的格式,我們可以自定義要顯示的內容
- textStyle可以設置文字的大小和樣式
- color可以設置文字的顏色,"inherit"表示顏色跟隨對應的扇形的顏色
- data:我們要展示的數據
- selectedMode:表示選中的效果
- selectedOffset:扇形被選中的時候放大的幅度
我們目前只是用了這些屬性,當然echart還有非常多的屬性可以設置,感興趣的可以自行探索。
下面是這個頁面的完整代碼
<template><div><el-row class="container"><div class="left-grid"><el-card><el-table:data="table_data":show-header="true":max-height="615"stripe><el-table-columnprop="id"label="序號"width="65%"></el-table-column><el-table-column prop="code" label="股票代碼"></el-table-column><el-table-column prop="name" label="公司簡稱"></el-table-column><el-table-column prop="industry" label="所屬行業"></el-table-column><el-table-column prop="weight" label="權重占比"></el-table-column></el-table></el-card></div><div class="right-grid" ref="myChart"></div></el-row></div>
</template><script>
import axios from "axios";
import { getCurrentInstance } from "vue";
export default {data() {return {table_data: [],pie_data: [],echarts: getCurrentInstance().appContext.config.globalProperties.$echarts,};},mounted() {this.init();},methods: {init() {var url = "http://localhost:9001/queryAll";axios.get(url).then((response) => {this.table_data = response.data;console.log(response);}).catch((error) => {console.log(error);});this.create_pie();},// 繪制餅狀圖create_pie() {var url = "http://localhost:9001/queryDist";axios.get(url).then((response) => {console.log(response);for (var i = 0; i < response.data.length; i++) {this.pie_data.push({value: response.data[i].weight,name: response.data[i].industry,});}console.log(this.pie_data);var myChart = this.echarts.init(this.$refs["myChart"]);var option = {title: {text: "滬深300行業權重分布", //標題},tooltip: {},legend: {y: 50,textStyle: {fontSize: 14,},},label: {show: true,},series: [{name: "分布", //數據的名字type: "pie", //表示柱狀圖radius: "70%", //圓的半徑center: ["50%", "60%"],label: {formatter: function (params) {console.log(params.name + " " + params.value + "%");return params.name + " " + params.value + "%";},textStyle: {fontSize: 14,fontWeight: "bolder",},color: "inherit",},data: this.pie_data,selectedMode: "single", //選中效果,使選中區域偏離圓心一小段距離,single或者multipleselectedOffset: 10, //偏離圓心的一小段距離},],};// 使用剛指定的配置項和數據顯示圖表。myChart.setOption(option);}).catch((error) => {console.log(error);});},},
};
</script><style scoped>
.container {display: grid;grid-template-columns: 35% 65%;width: 100%;height: 80vh;
}
.left-grid {background-color: #f0f0f0;border-radius: 2%;padding: 10px;height: 95%;
}
.right-grid {background-color: #f9ecc3;border-radius: 2%;padding: 10px;height: 95%;
}
</style>
最后再放一張顯示的效果

數據分析
這部分我們進行一下簡單的數據分析。

從數據中可以看出來,目前滬深300指數中制造業占比最高,高達55.217%;金融業第二,占比21.714%;排名第三的是采礦業,占比4.333%;排名第四的是信息技術服務業,占比4.308%;排名第五的是物流行業,占比3.242%;排名第六的是電力等基礎設施行業,占比3.193%,剩下的一些行業占比就比較低了。
從這組數據中我們可以看出來,我們國家的經濟發展還是以制造業為主,金融業為輔的模式,至少滬深300指數構成來看是這樣的。
好了,本文就到這里了,有什么想說的歡迎留言和我交流。?


)


 和 execute() 方法有什么區別?)


——視覺感知)