BUUCTF:https://buuoj.cn/challenges
題目描述:
注意:得到的 flag 請包上 flag{} 提交
密文:
下載附件,解壓得到一張.jpg圖片。

解題思路:
1、用010 Editor看了一下,剛開始以為是修改寬高的題,沒有想到這個方向。(想到也不會做)
在010 Editor中看到,在圖片數據的后面附加了很多的無關數據。(“FF D9”為jpg文件結尾)
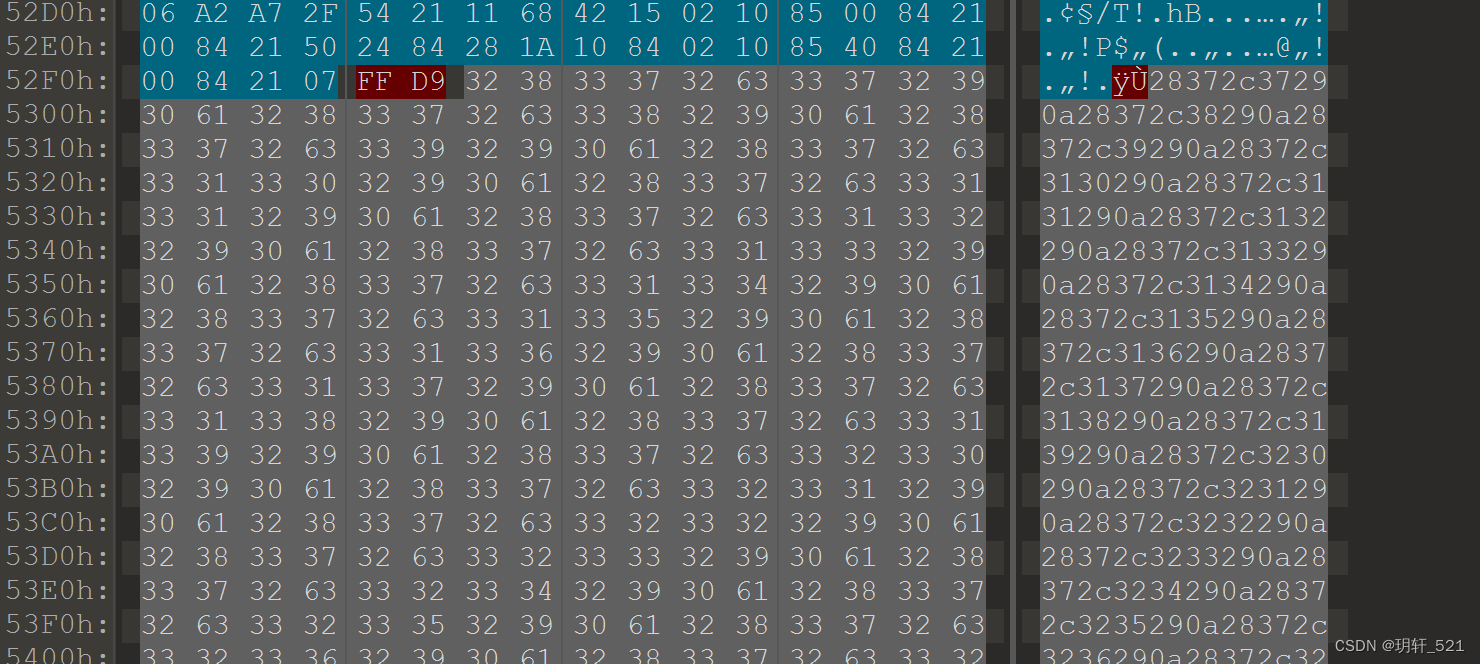
2、將這些數據轉換一下,看看是什么文件的數據。將全部的灰色數據復制下來,新建一個txt文本,粘貼進去保存。
在010 Editor中,使用“文件”選項卡的“導入16進制文件”選項,導入剛才新建的txt文件。

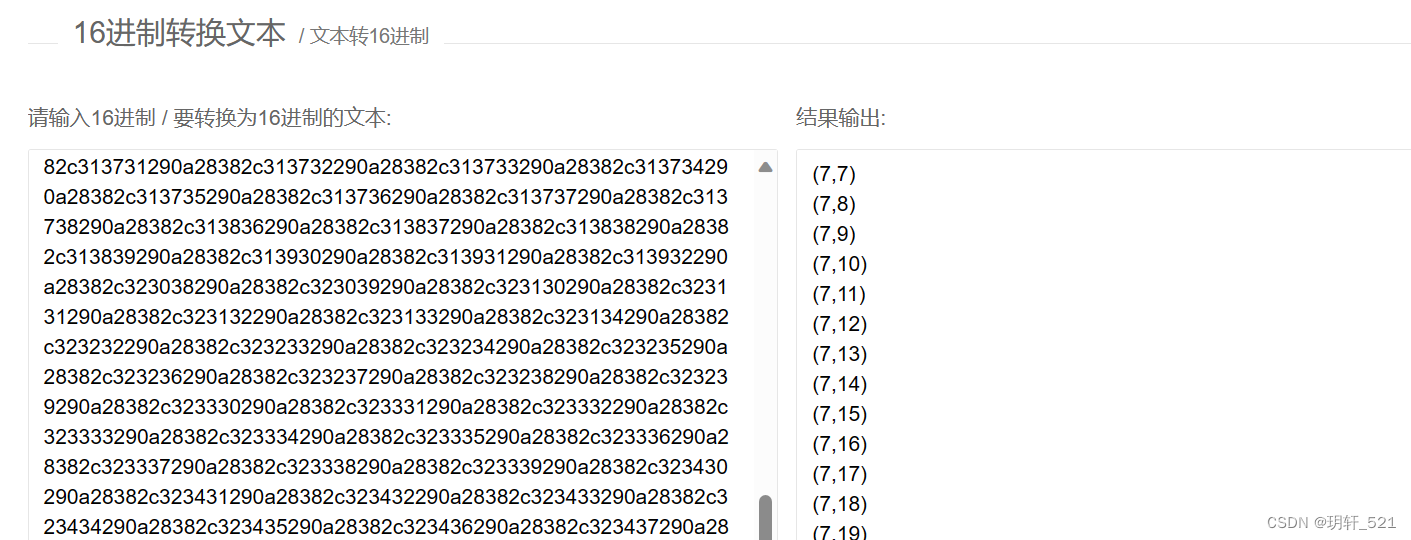
得到一堆坐標數據,接下來嘗試將數據轉換為圖像。
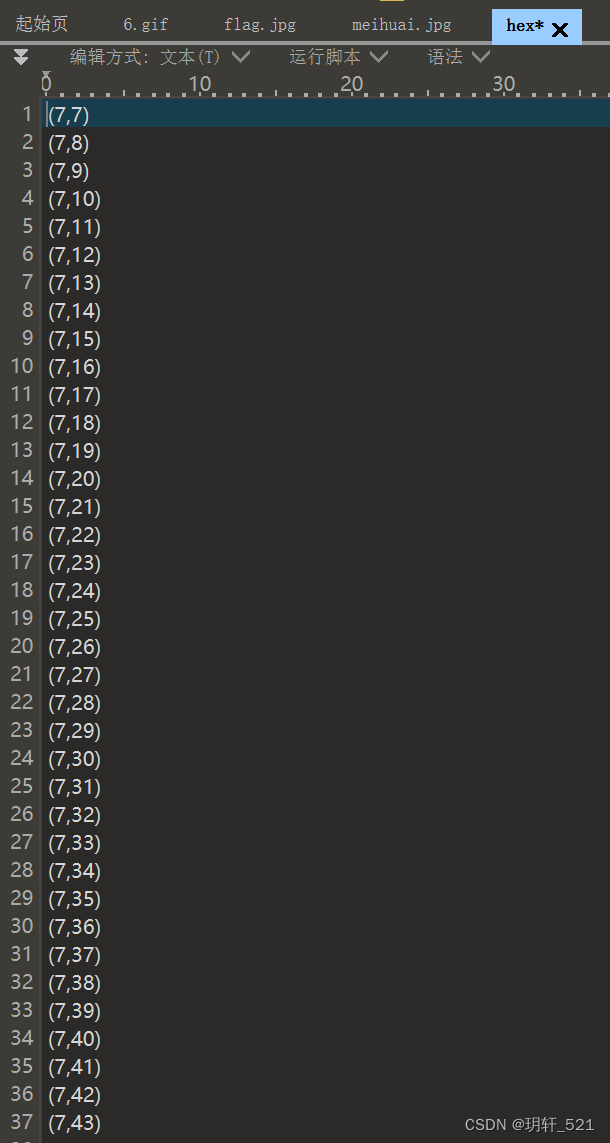
(這一步其實就是將16進制的數據轉換為ASCII字符,使用任意轉換工具都可以,這里提供一個python腳本)
with open('hex.txt', 'r') as h: # hex.txt為要轉換的文本文件val = h.read()h.close()with open('result.txt', 'w') as re: # 轉換完成后寫入result.txttem = ''for i in range(0, len(val), 2):tem = '0x' + val[i] + val[i+1]tem = int(tem, base=16)print(chr(tem), end="")re.write(chr(tem))re.close()
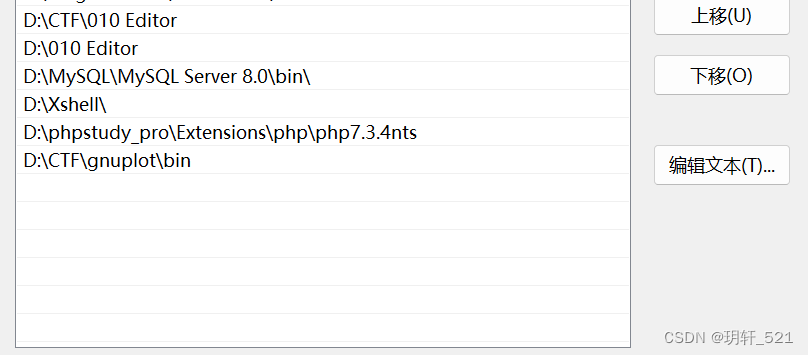
3、使用gnuplot來進行繪制圖像(gnuplot下載地址,提取碼:wel5),安裝好gnuplot之后,需要去環境變量(查看高級系統設置)里添加變量,然后就可以在命令行里運行gnuplot了。
4、使用gnuplot之前需要先將坐標數據格式轉換成gnuplot可以識別的格式,下面是Python腳本:
with open('result.txt', 'r') as res: # 坐標格式文件比如(7,7)re = res.read()res.close()with open('gnuplotTxt.txt', 'w') as gnup: # 將轉換后的坐標寫入gnuplotTxt.txtre = re.split()tem = ''for i in range(0, len(re)):tem = re[i]tem = tem.lstrip('(')tem = tem.rstrip(')')for j in range(0, len(tem)):if tem[j] == ',':tem = tem[:j] + ' ' + tem[j + 1:]gnup.write(tem + '\n')gnup.close()
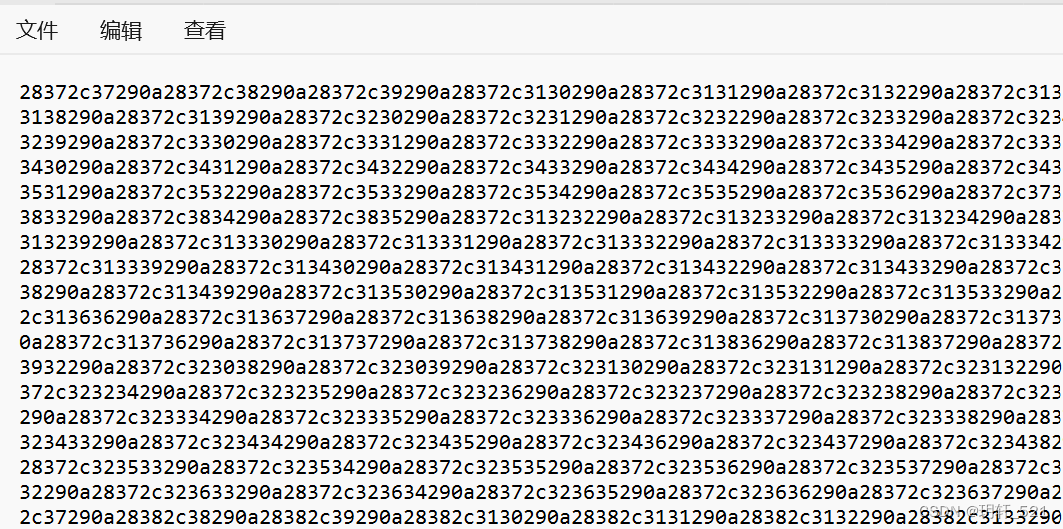
轉換之后是這樣的數據格式。
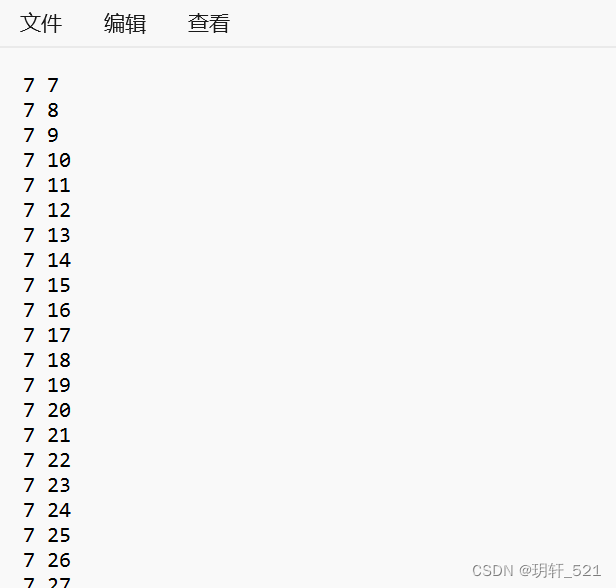
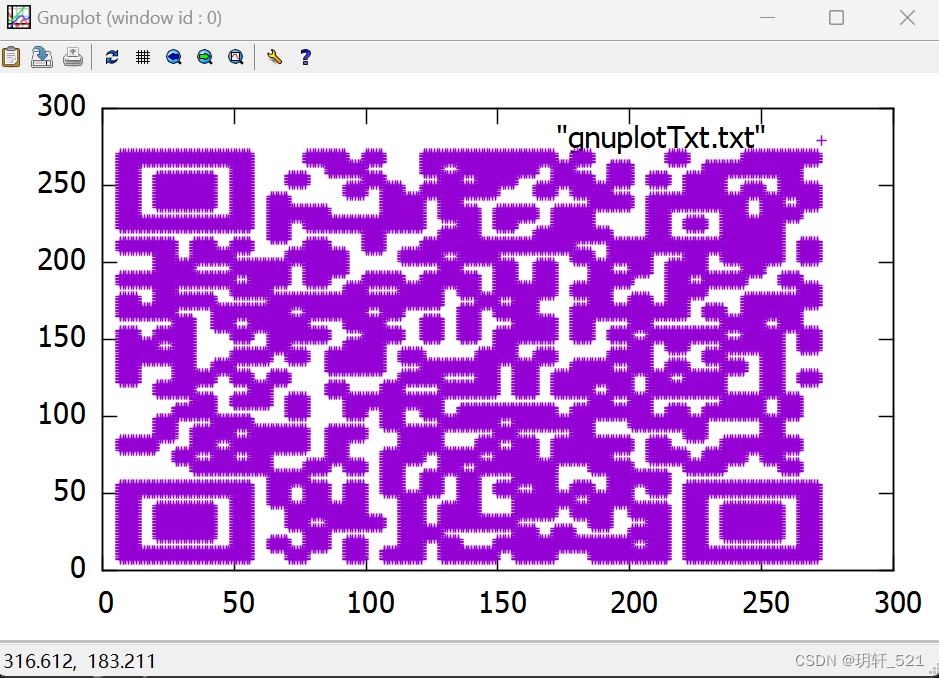
5、將gnuplotTxt.txt放到gnuplot.exe的文件夾下,啟動gnuplot,在命令行使用如下命令即可繪圖。
plot "gnuplotTxt.txt"
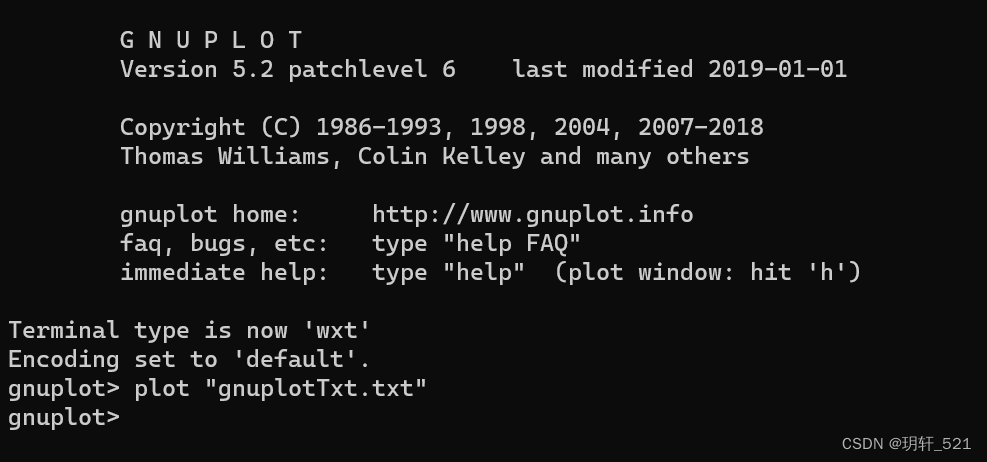
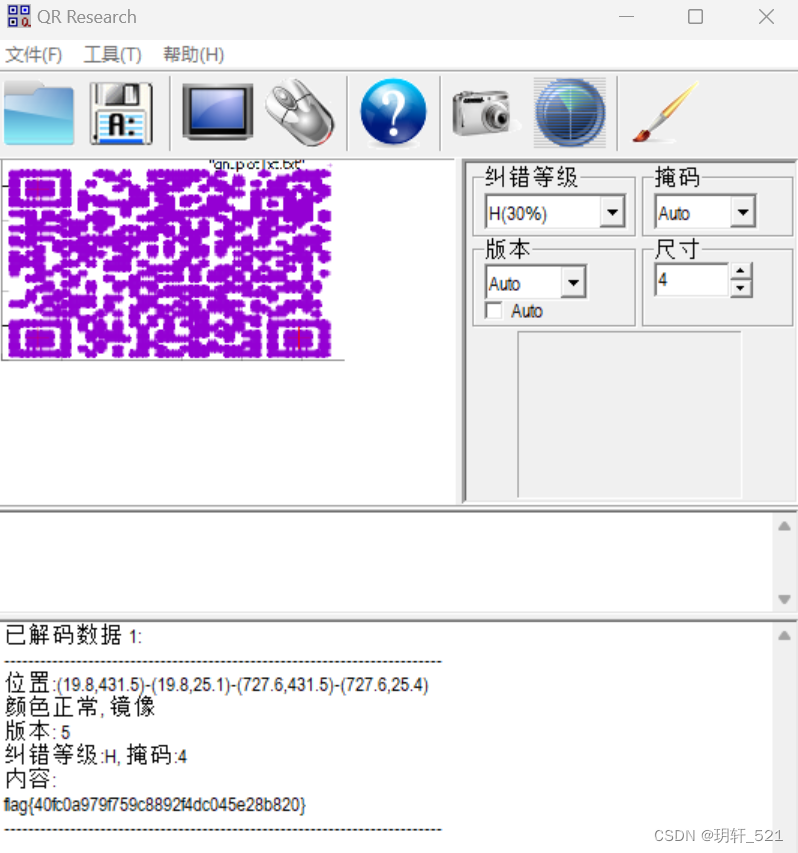
得到一張二維碼圖片,掃描二維碼得到flag。
(原來一開始圖片屬性就有提示)

flag:
flag{40fc0a979f759c8892f4dc045e28b820}

)


dami CMS)


