npm install echarts -D
?
// "echarts": "^5.3.2", [推薦版本]
// "zrender": "^5.3.2"  [如果報錯的話就安裝這個]
<template><view class="container"><view id="myChart" class="chart"></view></view>
</template>
?
<script>
import * as echarts from 'echarts/dist/echarts.min.js';
?
// 開啟觸摸事件支持,用于適配移動端觸摸屏設備。
echarts.env.touchEventsSupported = true;
?
// 明確關閉微信小程序適配模式,因為當前是瀏覽器環境
echarts.env.wxa = false;
?
// 同時啟用SVG和Canvas兩種渲染模式,ECharts會根據瀏覽器能力自動選擇:
// Canvas更適合大數據量場景
// SVG更適合交互操作和動畫
echarts.env.svgSupported = true;
echarts.env.canvasSupported = true;
?
// 啟用DOM操作支持,這是瀏覽器環境下圖表渲染的基礎能力
echarts.env.domSupported = true;
?
export default {data() {return {chart: null}},
?methods: {initChart() {let base = +new Date(1968, 9, 3);let oneDay = 24 * 3600 * 1000;let date = [];let data = [Math.random() * 300];for (let i = 1; i < 20000; i++) {var now = new Date((base += oneDay));date.push([now.getFullYear(), now.getMonth() + 1, now.getDate()].join('/'));data.push(Math.round((Math.random() - 0.5) * 20 + data[i - 1]));}
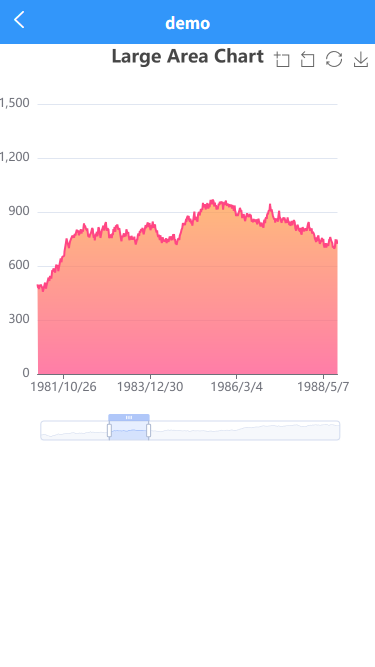
?const option = {tooltip: {trigger: 'axis',position: function (pt) {return [pt[0], '10%'];}},title: {left: 'center',text: 'Large Area Chart'},toolbox: {feature: {dataZoom: {yAxisIndex: 'none'},restore: {},saveAsImage: {}}},xAxis: {type: 'category',boundaryGap: false,data: date},yAxis: {type: 'value',boundaryGap: [0, '100%']},dataZoom: [{type: 'inside',start: 0,end: 10},{type: 'slider',start: 0,end: 10,height: 20,bottom: 10,handleSize: '100%'}],series: [{name: 'Fake Data',type: 'line',symbol: 'none',sampling: 'lttb',itemStyle: {color: 'rgb(255, 70, 131)'},areaStyle: {color: new echarts.graphic.LinearGradient(0, 0, 0, 1, [{offset: 0,color: 'rgb(255, 158, 68)'},{offset: 1,color: 'rgb(255, 70, 131)'}])},data: data}]};
?// 確保 DOM 渲染完成后再初始化圖表this.$nextTick(() => {const chartDom = document.getElementById('myChart');if (chartDom) {this.chart = echarts.init(chartDom);this.chart.setOption(option);
?
?// 手動綁定觸摸事件this.bindTouchEvents(chartDom);}});},
?bindTouchEvents(element) {let startX = 0;let startY = 0;
?element.addEventListener('touchstart', (e) => {if (e.touches.length === 1) {startX = e.touches[0].clientX;startY = e.touches[0].clientY;}}, {passive: false});
?element.addEventListener('touchmove', (e) => {// 阻止默認滾動行為e.preventDefault();}, {passive: false});},
?handleResize() {if (this.chart) {this.chart.resize();}}},
?mounted() {// 延遲初始化確保 DOM 完全加載this.initChart();
?window.addEventListener('resize', this.handleResize);},
?beforeDestroy() {if (this.chart) {this.chart.dispose();}window.removeEventListener('resize', this.handleResize);}
}
</script>
?
<style scoped>
.container {width: 100%;height: 100%;
}
?
.chart {width: 100vw;height: 400px;touch-action: none; /* 關鍵:禁用瀏覽器默認的觸摸行為 */
}
</style>

)

:AI MCP驅動的智能工作流邏輯編排)


![[SWERC 2020] Safe Distance題解](http://pic.xiahunao.cn/[SWERC 2020] Safe Distance題解)


.net面試(static))


)


