文章目錄
- 概要
- 小程序中使用echarts
- 1. ec-canvas
- 2. 下載項目
- 3. 去echarts官網定制:
- 4.點擊下載
- 5.引入使用
- echarts的option配置知識點歸納整理(還在更新):
- 小結
概要
小程序中使用echarts(簡單詳細)
小程序中使用echarts
在echarts官網中有介紹到:echarts-for-weixin 項目提供了一個小程序組件,用這種方式可以方便地使用 ECharts。
步驟:
1. ec-canvas
點擊上方鏈接下載項目ec-canvas
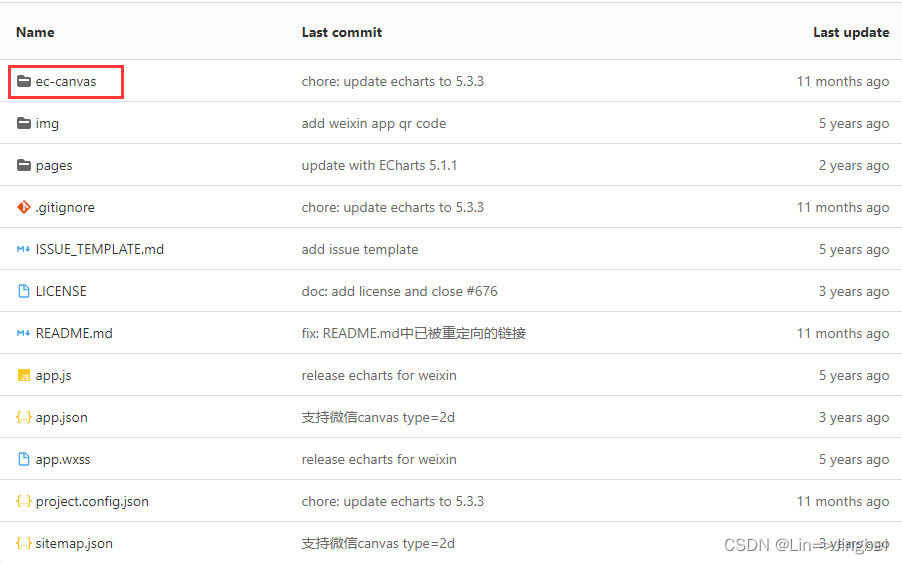
2. 下載項目
下載這個項目文件夾到自己的電腦上
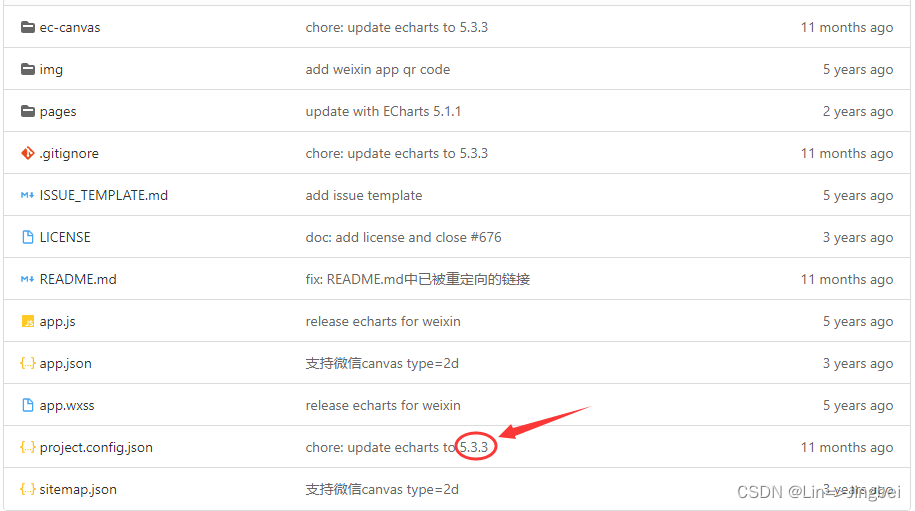
注意:需注意下載的是哪個版本,之后在echarts官網定制時選用的版本是和這個項目的版本一樣的,否則可能出不來,小程序中不會放很多的echarts圖表,否則整個項目太大了,會帶不動,所以小程序一般是使用在線定制
3. 去echarts官網定制:
點擊下載——下載——方法三中的在線定制

在定制頁面中選擇你需要使用的圖表,注意!注意!注意!這里的選擇版本,必須和上面下載的ec-canvas中的echarts.js的版本對應,必須!必須!必須!選擇完成后,翻到最下面點擊下載按鈕。
4.點擊下載
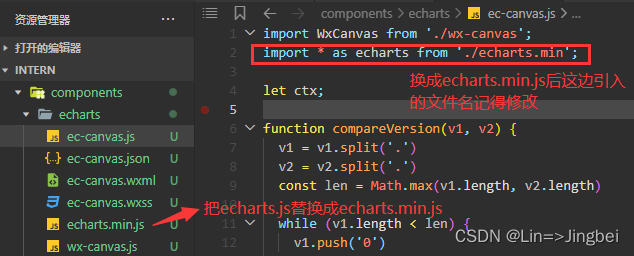
下載完成后,找到下載的文件:echarts.min.js ,然后在你小程序項目中新建一個components,把echarts這個目錄放進去,原目錄中的echarts.js刪了不要,太大了,換成上一步下載的echarts.min.js,還有一點注意的就是ec-canvas.js的import引入的是原來的echarts.js文件,你需要自己改成剛才下載的文件
5.引入使用
然后就可以引入使用了,在js文件中引入此文件(自己找此文件位置并引入)
 import * as echarts from '../../components/echarts/echarts.min'function bar(canvas, width, height, dpr) {const chart = echarts.init(canvas, null, {width: width,height: height,// devicePixelRatio: dpr});canvas.setChart(chart);let option = {xAxis: {type: 'category',data: ['Mon', 'Tue', 'Wed', 'Thu', 'Fri', 'Sat', 'Sun']},yAxis: {type: 'value'},series: [{data: [120, 200, 150, 80, 70, 110, 130],type: 'bar',showBackground: true,backgroundStyle: {color: 'rgba(180, 180, 180, 0.2)'}}]};chart.setOption(option);return chart;
}
在date里寫:
data: {ec: {onInit: bar},},
所有的操作都在option中,需要配置其他屬性的話,可查看配置項手冊或者打開示例配置
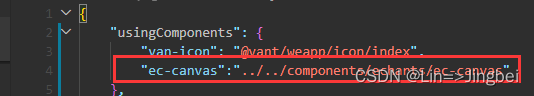
JSON文件引入的是目錄中的ec-canvas.js
WXML文件:這里的ec是組件對象,對應著js文件里data的ec
<view class="ec-box"><ec-canvas canvas-id="echart-bar" ec="{{ec}}"></ec-canvas></view>
wxss文件:(給echarts的容器設置寬高)
ec1-box {width: 100%;height: 406rpx;
}
這樣echarts的引入和使用就成功了。
echarts的option配置知識點歸納整理(還在更新):
- 通用:
1、grid: {left: "0", //距離容器左邊的距離right: "0",  //距離容器右邊的距離bottom: "0",  //距離容器下邊的距離top: "33",  //距離容器上邊的距離containLabel: true //是否顯示坐標軸},
2、xAxis: [{type: 'category',  // 坐標軸類型// prettier-ignoreaxisLabel: {  // 設置X軸坐標軸名稱字體樣式textStyle: {fontSize: "10",fontWeight: '400',color: '#999999',fontFamily: 'PingFangSC-Regular, PingFang SC'},},axisTick: {show: false  // 是否顯示X軸坐標軸刻度},axisLine: {show: false  // 是否顯示X軸坐標軸線},data: ['07/08', '07/09', '07/10', '今天']  // X軸字段數據}],
3、yAxis: [{type: 'value',   // 坐標軸類型axisLabel: {   // 設置Y軸坐標軸名稱字體樣式textStyle: {fontSize: "10",fontWeight: '400',color: '#999999',fontFamily: 'PingFangSC-Regular, PingFang SC'},},name: '元',  // 設置Y軸坐標軸單位nameTextStyle: { //  單位樣式color: "#999999", //  字體顏色fontSize: 10, //  字體大小padding: [0, 26, 0, 0], //  內填充fontFamily: 'PingFangSC-Regular, PingFang SC',  // 字體fontWeight: 400, }}],
4、tooltip: { // 提示框組件show: true,confine: false, //是否將 tooltip 框限制在圖表的區域內backgroundColor: 'rgba(0,0,0,0.65)', //提示框浮層背景色trigger: 'axis',dashOffset: 10,padding: 6, //上右下左內邊距textStyle: { //提示框浮層的文本樣式color: '#fff',fontSize: 10,lineHeight: 10,},axisPointer: { //坐標軸指示器配置項type: 'line', //直線指示器z: 1,lineStyle: {type: 'dashed',color: '#979797',shadowOffsetY: -7,shadowColor: '#979797',}},},
5、 legend: {  // 圖例組件orient: 'horizontal', //  布局朝向(橫向/(縱向:vertical))right: 0, // legend位置調整icon: "circle", // legend標記樣式itemHeight: 8, // legend標記樣式高度itemWidth: 8, // legend標記樣式寬度itemGap: 12, // legend標記的間距textStyle: {  // 圖例文本樣式fontSize: 10,fontFamily: 'PingFangSC-Regular, PingFang SC',fontWeight: 400,color: '#666666',padding: [0, 0, 0, 6] //文字與圖形之間的左右間距},data: ['收入', '支出']  //圖例數據數組},
- 柱形圖:
1、series: [{ // 雙柱圖數據name: '收入',type: 'bar',barWidth: '10', // 柱狀圖寬度barGap: '60%', // 多柱形柱形間隔label: {// 設置顯示labelshow: true,// 設置label的位置position: 'top',// 設置label的文字顏色color: '#999999',fontFamily: 'PingFangSC-Regular, PingFang SC',fontWeight: 500,fontSize: '10',// 格式化label文字formatter: function (data) {return Math.round(data.value).toFixed(2)},},data: [25.6, 76.7, 135.6, 162.2,],itemStyle: {color: new echarts.graphic.LinearGradient(0, 1, 0, 0, [{ // 設置柱狀圖漸變色offset: 0,color: "#FF991C" // 0% 處的顏色}, {offset: 0.6,color: "#ffb720" // 60% 處的顏色}, {offset: 1,color: "#FFCD24 " // 100% 處的顏色}], false),barBorderRadius: [3, 3, 0, 0], // 柱形圖圓角},},{name: '支出',type: 'bar',barWidth: '10', // 柱狀圖寬度label: {// 設置顯示labelshow: true,// 設置label的位置position: 'top',// 設置label的文字顏色color: '#999999',fontFamily: 'PingFangSC-Regular, PingFang SC',fontWeight: 500,fontSize: '10',// 格式化label文字formatter: function (data) {return Math.round(data.value).toFixed(2)},},data: [70.7, 175.6, 182.2, 48.7],itemStyle: {color: new echarts.graphic.LinearGradient(0, 1, 0, 0, [{ // 設置柱狀圖漸變色offset: 0,color: "#4186F5" // 0% 處的顏色}, {offset: 0.6,color: "#73affa" // 60% 處的顏色}, {offset: 1,color: "#9CD2FF " // 100% 處的顏色}], false),barBorderRadius: [3, 3, 0, 0], // 柱形圖圓角},}]
- 折線圖:
1、 series: [{ // 折線圖數據name: '完成訂單',type: 'line',stack: 'Total',symbol: 'circle', // 折線圖折點樣式(實心)symbolSize: 4, // 折線圖折點的大小樣式lineStyle: {color: 'pink' // 設置折線顏色},data: [120, 132, 101, 134, 90, 230, 210]},{name: '取消訂單',type: 'line',symbol: 'circle', // 折線圖折點樣式(實心)symbolSize: 4, // 折線圖折點的大小樣式stack: 'Total',data: [220, 182, 191, 234, 290, 330, 310]},]};
小結
以上就是小程序使用echarts步驟知識點,喜歡的話快點贊、收藏吧!謝謝!
- 祝:平安順遂

)


)


:【FA模型切換Stage模型指導】 app和deviceConfig的切換)


——入門配置)


