文章目錄
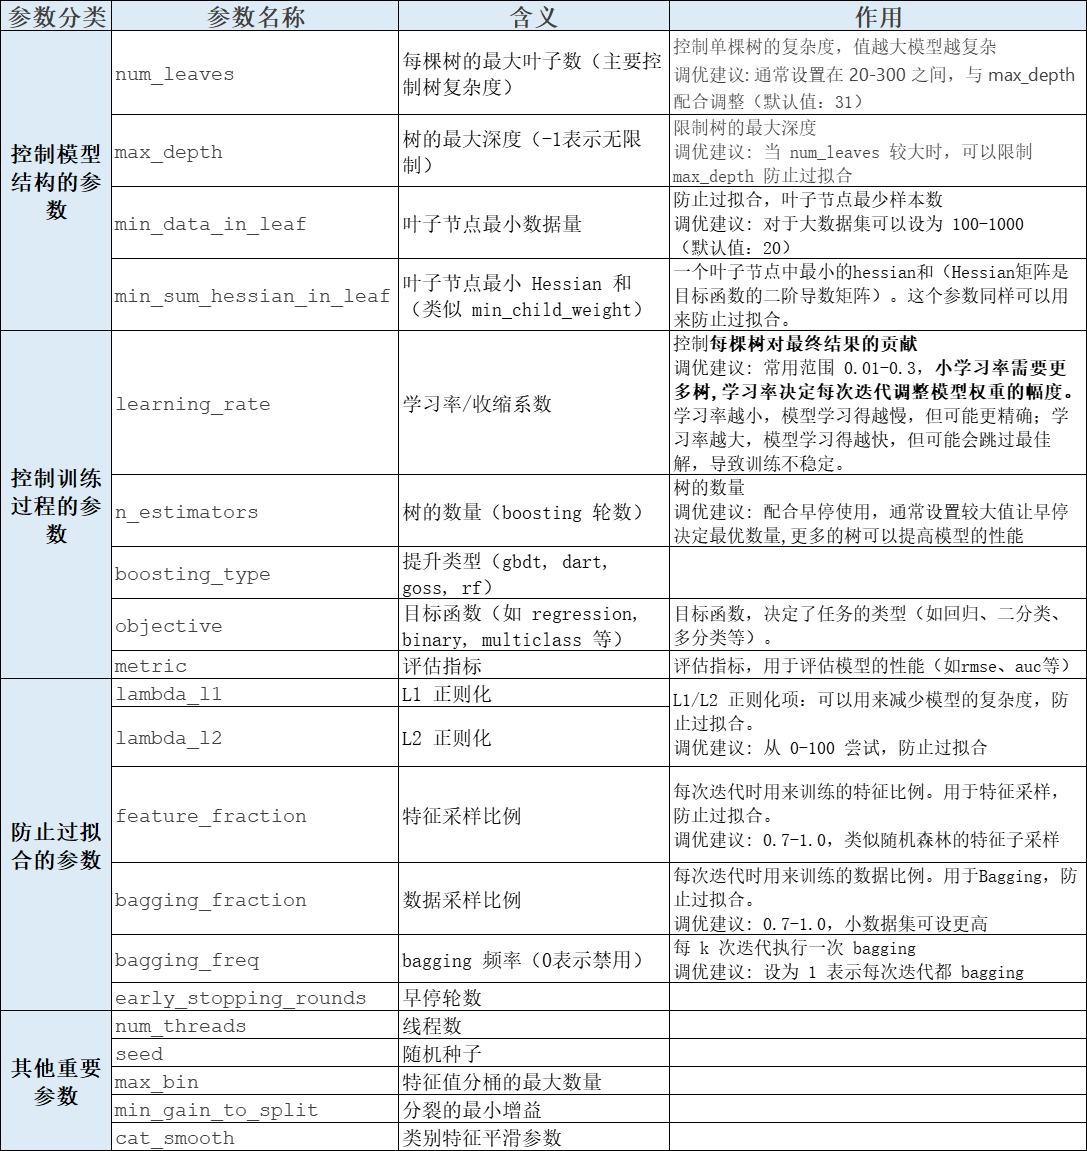
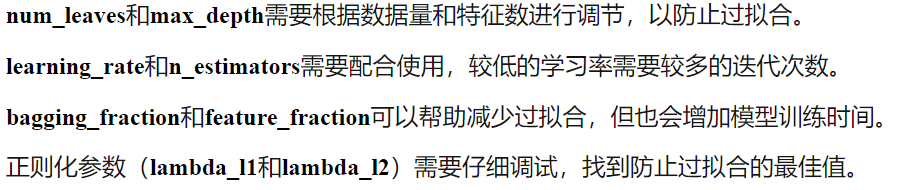
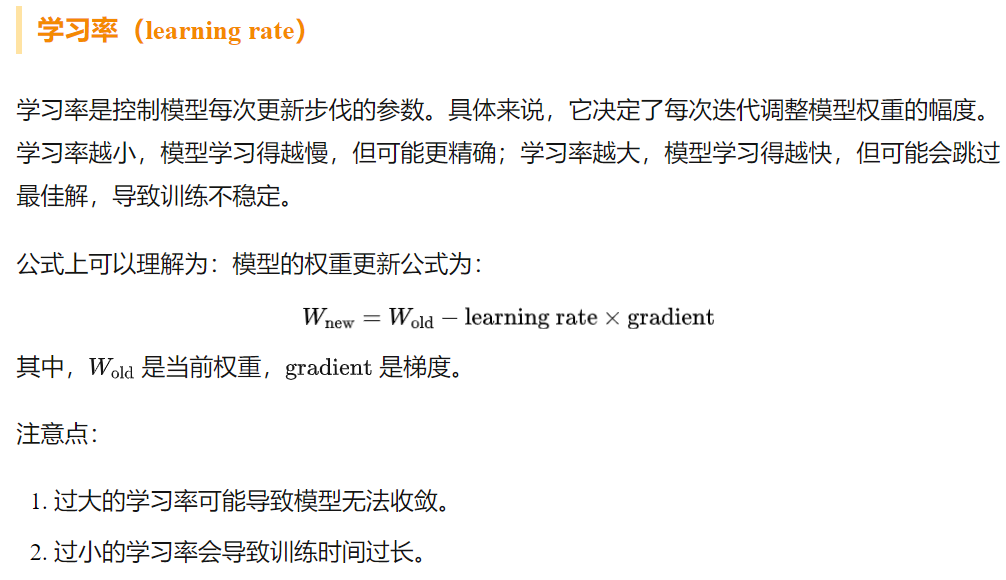
- 1. LightGBM模型參數介紹
- 2. 核心優勢
- 3. python實現LightGBM
- 3.1 基礎實現
- 3.1.1 Scikit-learn接口示例
- 3.1.2 Python API示例
- 3.2 模型調優
- 3.2.1 GridSearchCV簡介
- 3.2.2 LightGBM超參調優
- 3.2.3 GridSearchCV尋優結果
在之前的文章 Boosting算法【AdaBoost、GBDT 、XGBoost 、LightGBM】理論介紹及python代碼實現 中重點介紹了AdaBoost算法的理論及實現,今天對LightGBM 如何實現以及如何調參,著重分析一下。
LightGBM是基于決策樹算法的分布式梯度提升框架,屬于GBDT(Gradient Boosting Decision Tree)家族,與XGBoost、CatBoost并稱為三大主流GBDT工具。
1. LightGBM模型參數介紹


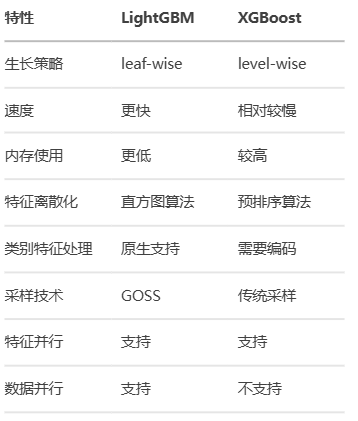
2. 核心優勢
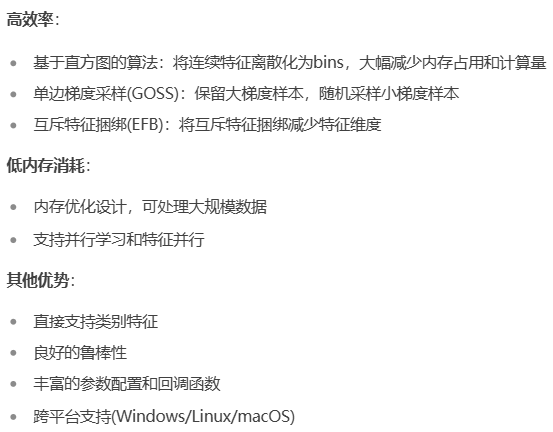
與XGBoost相比較
3. python實現LightGBM
3.1 基礎實現
3.1.1 Scikit-learn接口示例
import numpy as np
import pandas as pd
from sklearn.datasets import load_iris
from sklearn.model_selection import train_test_split
from sklearn.datasets import load_breast_cancer
import lightgbm as lgb
from sklearn.metrics import accuracy_score, classification_report, confusion_matrix,mean_squared_error
import matplotlib.pyplot as plt
import warnings
warnings.filterwarnings("ignore")
plt.rcParams['font.sans-serif'] = ['SimHei'] # 用來正常顯示中文標簽
plt.rcParams['axes.unicode_minus'] = False # 用來正常顯示負號#導入數據
data = load_breast_cancer()
X = data.data
y = data.target# 分割數據集,80%作為訓練集,20%作為測試集
X_train, X_test, y_train, y_test = train_test_split(X, y, test_size=0.4, random_state=42)# 創建Dataset
train_data = lgb.Dataset(X_train, label=y_train)
test_data = lgb.Dataset(X_test, label=y_test, reference=train_data)# 設置參數
params = {'objective': 'binary', #目標函數,決定了任務的類型(二分類 regression 回歸)'metric': 'binary_logloss', #二分類對數損失(Binary Logarithmic Loss)'num_leaves': 31,'learning_rate': 0.05,'feature_fraction': 0.9
}# 訓練模型
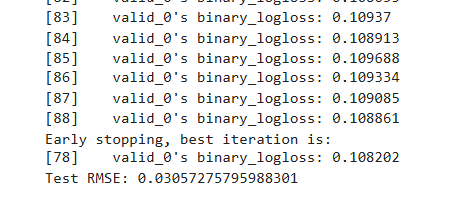
gbm = lgb.train(params,train_data,num_boost_round=100,valid_sets=[test_data],early_stopping_rounds=10)# 預測
y_pred = gbm.predict(X_test, num_iteration=gbm.best_iteration)# 評估
rmse = mean_squared_error(y_test, y_pred)
print(f'Test RMSE: {rmse}')
3.1.2 Python API示例
import numpy as np
import pandas as pd
from sklearn.datasets import load_iris
from sklearn.model_selection import train_test_split
from sklearn.datasets import load_breast_cancer
import lightgbm as lgb
from sklearn.metrics import accuracy_score, classification_report, confusion_matrix,mean_squared_error
import matplotlib.pyplot as plt
import warnings
warnings.filterwarnings("ignore")
plt.rcParams['font.sans-serif'] = ['SimHei'] # 用來正常顯示中文標簽
plt.rcParams['axes.unicode_minus'] = False # 用來正常顯示負號#導入數據
data = load_breast_cancer()
X = data.data
y = data.target# 分割數據集,80%作為訓練集,20%作為測試集
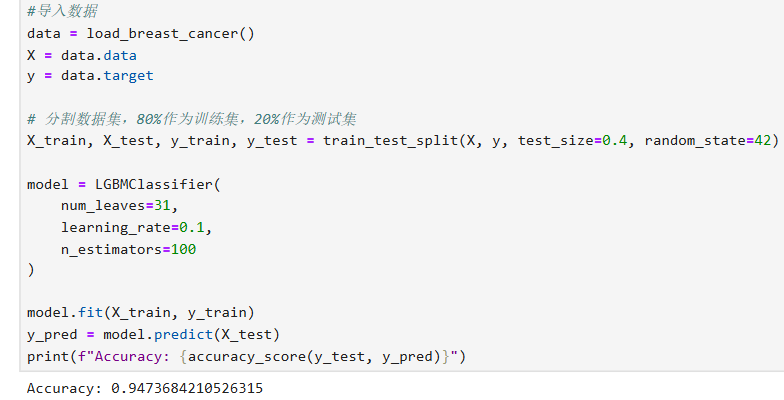
X_train, X_test, y_train, y_test = train_test_split(X, y, test_size=0.4, random_state=42)model = LGBMClassifier(num_leaves=31,learning_rate=0.1,n_estimators=100
)model.fit(X_train, y_train)
y_pred = model.predict(X_test)
print(f"Accuracy: {accuracy_score(y_test, y_pred)}")
3.2 模型調優
模型調優也參考之前自己寫過的文檔
Python模型優化超參尋優過程
GridSearchCV是scikit-learn庫中用于超參數調優的重要工具,它通過網格搜索和交叉驗證的方式尋找最優的模型參數組合,下面介紹使用GridSearchCV對LGBM參數調優。
3.2.1 GridSearchCV簡介
關于GridSearchCV簡單再介紹一下
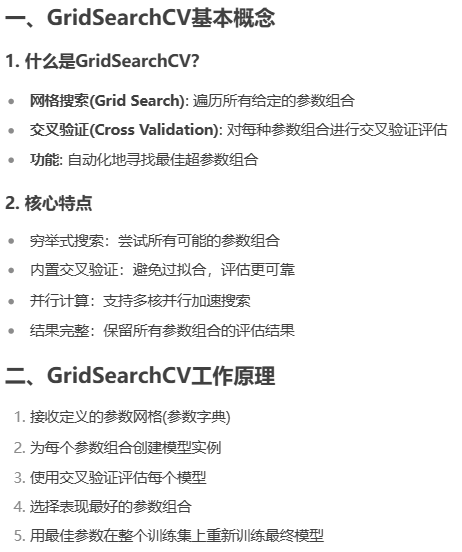
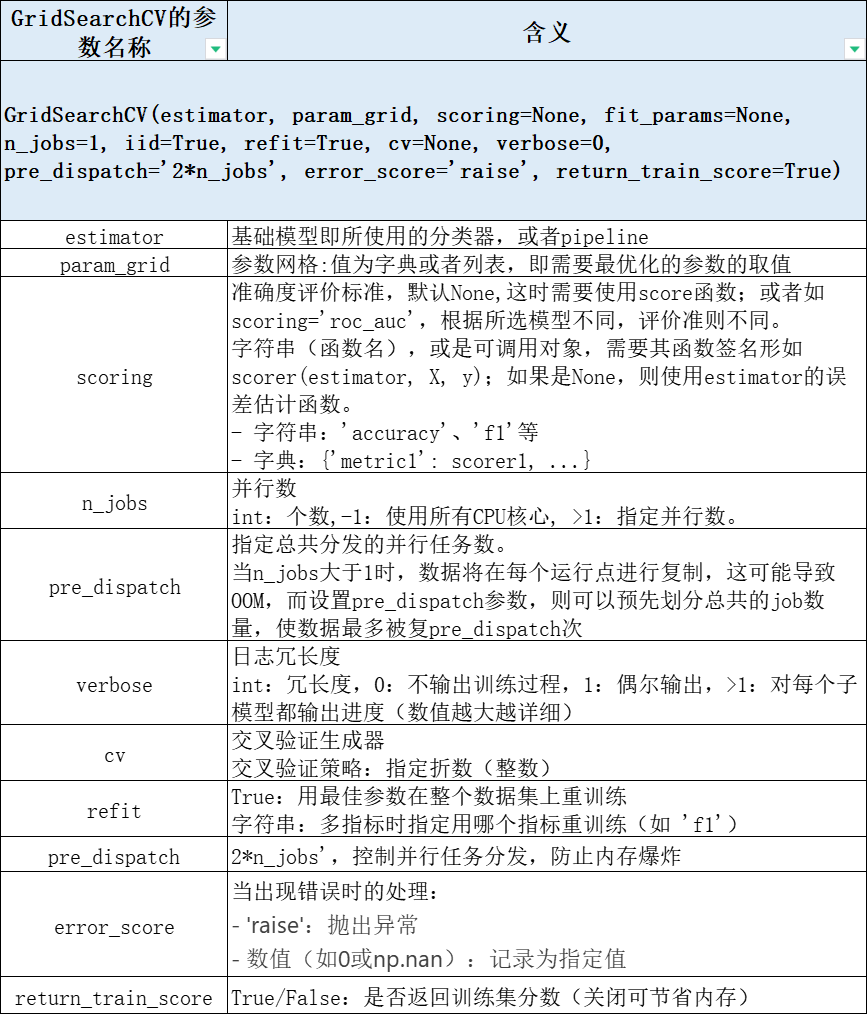
機器學習-GridSearchCV scoring 參數設置!
3.2.2 LightGBM超參調優
(三)提升樹模型:Lightgbm原理深入探究 這篇文章里的關于Lightgbm優化比較深入,感興趣的可以仔細閱讀。
本部分的實現即對LightGBM介紹的參數使用GridSearchCV進行調優,python代碼見下
import numpy as np
import pandas as pd
from sklearn.model_selection import train_test_split, GridSearchCV, cross_val_score
from sklearn.datasets import load_breast_cancer
import lightgbm as lgb
from sklearn.metrics import accuracy_score, classification_report, confusion_matrix,mean_squared_error
import matplotlib.pyplot as plt
import warnings
warnings.filterwarnings("ignore")
plt.rcParams['font.sans-serif'] = ['SimHei'] # 用來正常顯示中文標簽
plt.rcParams['axes.unicode_minus'] = False # 用來正常顯示負號#導入數據
breast_cancer = load_breast_cancer()
breast_cancer_df = pd.DataFrame(breast_cancer.data, columns=breast_cancer.feature_names)
breast_cancer_df['target'] = breast_cancer.targetdaoshu = 20
X = breast_cancer_df.iloc[:,:-1]
y = breast_cancer_df.iloc[:,-1]
XGB_X = X[:-daoshu]
XGB_y = y[:-daoshu]
# 分割數據集,80%作為訓練集,20%作為測試集
X_train, X_test, y_train, y_test = train_test_split(X, y, test_size=0.25, random_state=42)lgb_class = lgb.LGBMClassifier()
# GridSearchCV 參數網格-----------------------------------------------------------
param_grid = {'max_depth': [5,7],'learning_rate': [0.1, 0.5],'n_estimators': [100, 500],'num_leaves':[31,51],'reg_alpha':[0.5,0.8,1],'reg_lambda':[0.5,1]
}grid_search = GridSearchCV(estimator=lgb_class, param_grid=param_grid, scoring='neg_mean_squared_error', cv=2, verbose=2)
grid_search.fit(X_train, y_train)
#網格查找每個參數時的-MSE
par =[]
par_mses = []
for i, par_mse in zip(grid_search.cv_results_['params'],grid_search.cv_results_['mean_test_score']):# print(i, par_mse)par.append(i)par_data = pd.DataFrame(par) par_mses.append(par_mse)par_rmsedata = pd.DataFrame(par_mses)
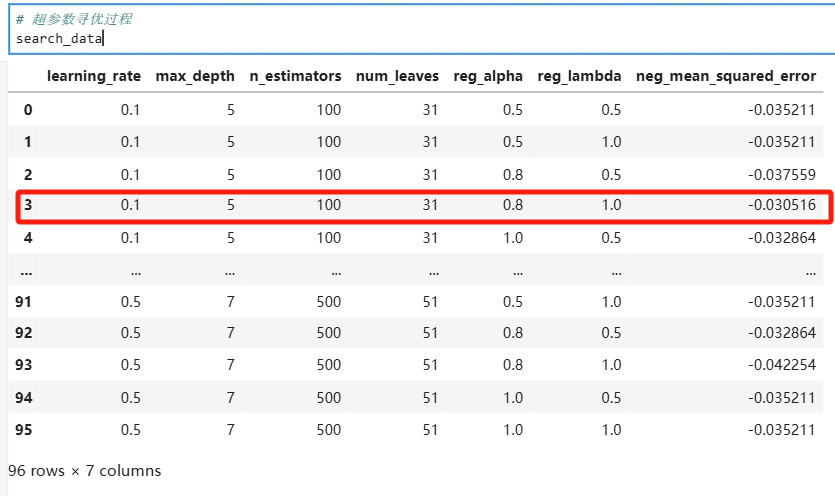
search_data = pd.concat([par_data,par_rmsedata],axis=1)
search_data = search_data.rename(columns={0:"neg_mean_squared_error"})
# 輸出最優參數信息
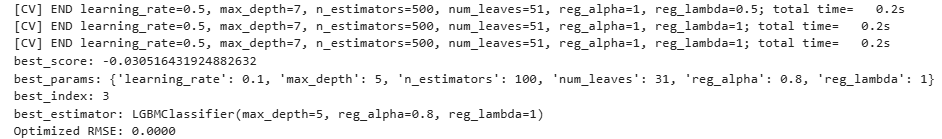
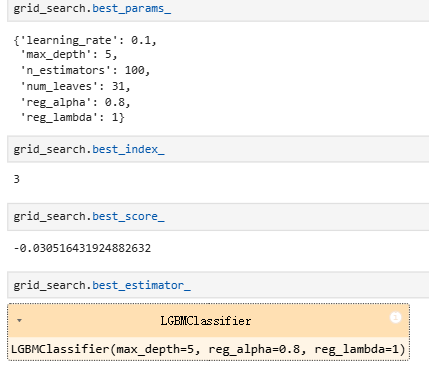
best_params = grid_search.best_params_
print('best_score:',grid_search.best_score_)
print(f"best_params: {best_params}")
print('best_index:',grid_search.best_index_)
print('best_estimator:',grid_search.best_estimator_)# 使用最優參數訓練模型
lgb_class_optimized = lgb.LGBMClassifier(**best_params)
lgb_class_optimized.fit(XGB_X, XGB_y)
# 預測
y_pred_optimized = lgb_class_optimized.predict(X)
rmse_optimized = np.sqrt(mean_squared_error(y, y_pred_optimized))
print(f"Optimized RMSE: {rmse_optimized:.4f}") #最終預測結果的 RMSE #可視化展示
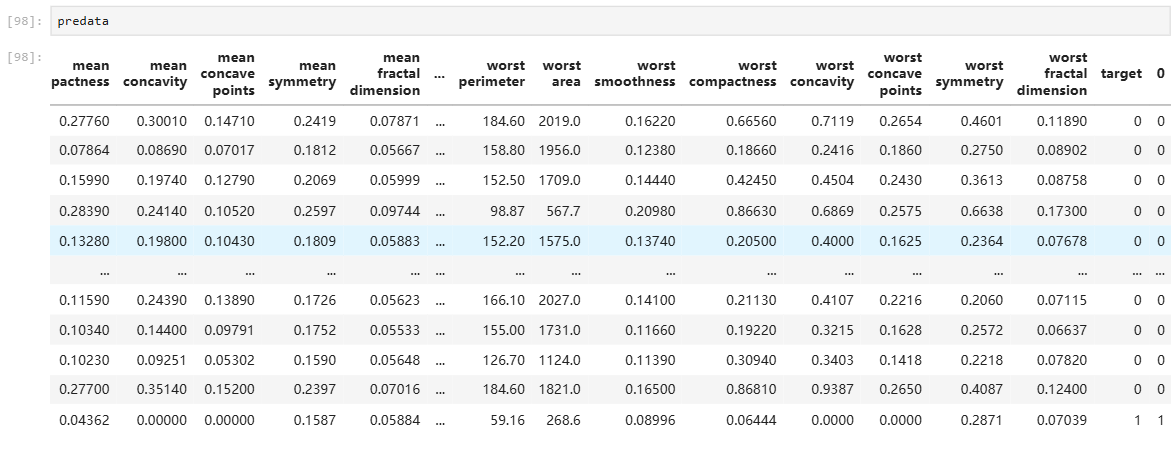
pre_target = pd.DataFrame(y_pred_optimized)
predata= pd.concat([breast_cancer_df,pre_target],axis=1)
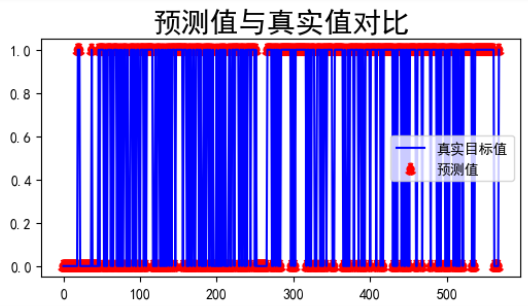
plt.figure(figsize=(6,3))
plt.plot(range(len(predata['target'])),predata['target'],c='blue')
plt.scatter(range(len(predata['target'])),predata.iloc[:,-1:],ls=':',c='red',lw=3)
plt.title('預測值與真實值對比', size= 20)
plt.legend(['真實目標值','預測值'])
plt.show()predata.tail()
部分結果展示
紅色框為最優組合。
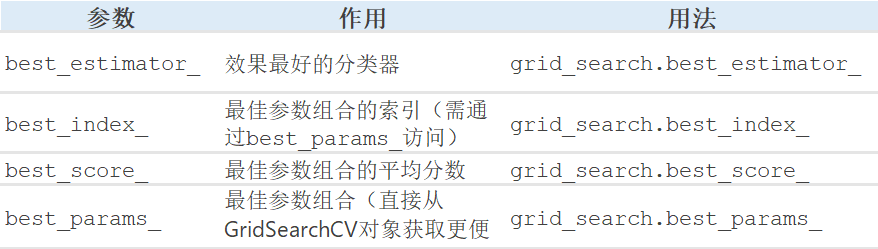
3.2.3 GridSearchCV尋優結果
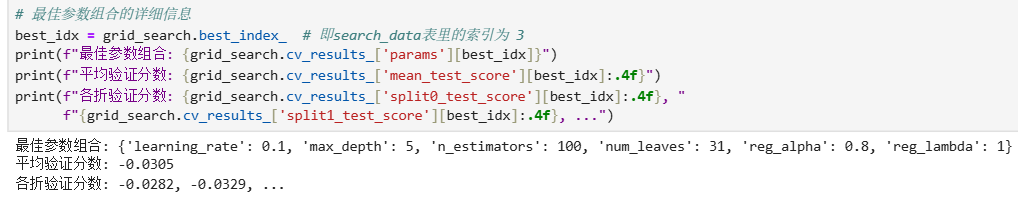
# 最佳參數組合的詳細信息
best_idx = grid_search.best_index_  # 即search_data表里的索引為 3
print(f"最佳參數組合: {grid_search.cv_results_['params'][best_idx]}")
print(f"平均驗證分數: {grid_search.cv_results_['mean_test_score'][best_idx]:.4f}")
print(f"各折驗證分數: {grid_search.cv_results_['split0_test_score'][best_idx]:.4f}, "f"{grid_search.cv_results_['split1_test_score'][best_idx]:.4f}, ...")
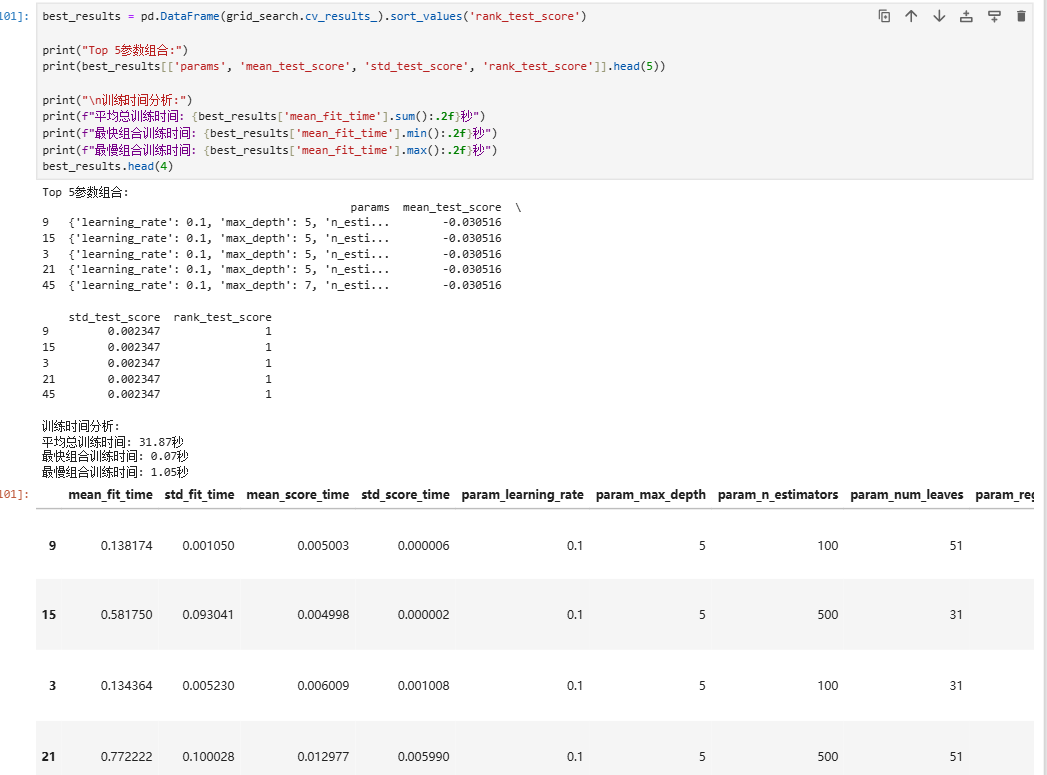
best_results = pd.DataFrame(grid_search.cv_results_).sort_values('rank_test_score')print("Top 5參數組合:")
print(best_results[['params', 'mean_test_score', 'std_test_score', 'rank_test_score']].head(5))print("\n訓練時間分析:")
print(f"平均總訓練時間: {best_results['mean_fit_time'].sum():.2f}秒")
print(f"最快組合訓練時間: {best_results['mean_fit_time'].min():.2f}秒")
print(f"最慢組合訓練時間: {best_results['mean_fit_time'].max():.2f}秒")
best_results.head(4)
)


:深度解析Netty核心參數——從參數配置到生產級優化)
——UDP)

)

)


教程 | 小程序UI設計進階(三)讓界面動起來,實操講透“聚焦”事件)

)