1、封裝的原因
如果在vue項目中有多個組件或者同個組件多出地方需要不同的圖表,因此自己封裝一個方便多次復用的Mycharts圖表組件。
2、具體步驟:
2.1 安裝echarts
pnpm i echarts --save2.2 新建MyCharts組件?:
~components/echarts/MyCharts.vue:
這里需要引入echarts:
import * as echarts from 'echarts';
<template><div><!-- 準備一個有寬高的dom ———— 其他內容從父組件傳過來 --><div :id="uid" :style="style"></div></div>
</template>
<script setup>
import { ref, reactive, computed, onMounted, nextTick } from 'vue'
import * as echarts from 'echarts';
const props =  defineProps({dataSource: {type: Object,default: null,required: true},canvasWidth: {type: String,default: '',required: true},canvasHeight: {type: String,default: '',required: true}
})
const uid = ref('')
const myChart = ref(null)
// 時間戳+隨機字符
uid.value = new Date().getTime() + Math.random().toString(32).slice(2, 10)
console.log('uid:', uid.value);let style = computed(() => ({width: props.canvasWidth,height: props.canvasHeight
}))
console.log('style:', style.value);const init = () => {// 基于準備好的dom,初始化echarts實例myChart.value = echarts.init(document.getElementById(uid.value))// 繪制圖表myChart.value.setOption(props.dataSource)
}
onMounted(() => {// nextTick(() => {//     init()// })init()
})</script>
<style scoped></style>
2.3 需要調用MyCharts組件的父組件:
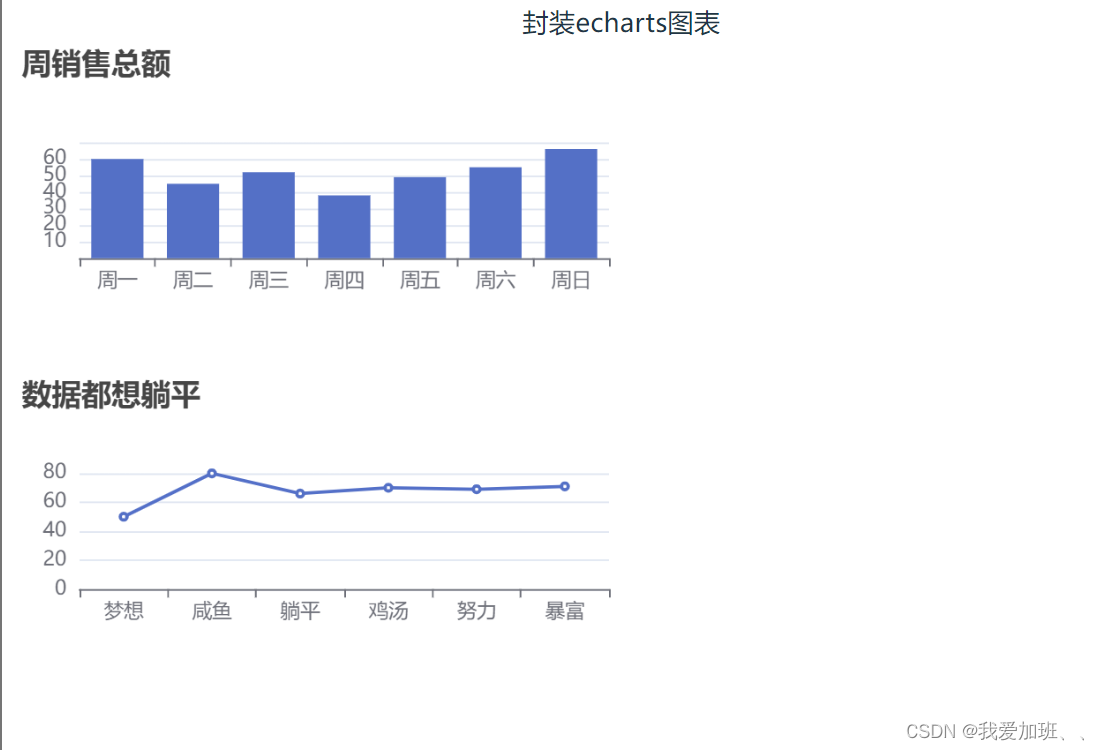
<template><div :style="{ transform: `scale(${scale})` }"><div class="title">封裝echarts圖表</div><!-- 調用圖表組件 --><MyCharts :dataSource="dataSource" :canvasWidth="canvasWidth" :canvasHeight="canvasHeight"></MyCharts><MyCharts :dataSource="dataSource2" :canvasWidth="canvasWidth" :canvasHeight="canvasHeight"></MyCharts></div>
</template>
<script setup>
import { ref, reactive } from 'vue'
import MyCharts from '../../components/echarts/MyCharts.vue'    // 引入封裝的圖表組件
import { useSelfAdaption } from '../../hooks/useSelfAdaption'const dataSource = reactive({title: {text: '周銷售總額'},tooltip: {},xAxis: {data: ['周一', '周二', '周三', '周四', '周五', '周六', '周日']},yAxis: {},series: [{name: '小米',type: 'bar',data: [60, 45, 52, 38, 49, 55, 66]}]
})
const dataSource2 = reactive({title: {text: '數據都想躺平'},tooltip: {},xAxis: {data: ['夢想', '咸魚', '躺平', '雞湯', '努力', '暴富']},yAxis: {},series: [{name: 'vivo',type: 'line',data: [50, 80, 66, 70, 69, 71]}]
})
const canvasWidth = ref('400px')
const canvasHeight = ref('200px')// 自適應 - 縮放
const { scale } = useSelfAdaption()</script>
<style lang="less" scoped>
.title{text-align: center;
}
</style>
3、效果:
4、這里我還引入了前面封裝好的自適應大屏的useSelfAdaption的hooks方法?:
import { useSelfAdaption } from '../../hooks/useSelfAdaption'// 自適應 - 縮放
const { scale } = useSelfAdaption()
使用:?:style="{ transform: `scale(${scale})` }"
<template><div :style="{ transform: `scale(${scale})` }"><div class="title">封裝echarts圖表</div>這樣你就成功封裝好了一個echarts圖表組件并成功使用啦!
擴展:
? ? ? ? 性能優化:
在數據可視化大屏中,圖表的性能尤為重要。我們可以通過以下方式進行優化:
合理使用debounce來減少窗口大小變化時的resize事件觸發頻率。
使用canvas渲染模式,相比于svg,canvas在大數據量下有更好的性能表現。
利用ECharts的showLoading和hideLoading方法,在數據加載時顯示加載動畫,避免用戶看到空白的圖表。
????????交互優化:
為了提升用戶體驗,我們可以增加一些交互功能:
提供縮放控制,允許用戶通過鼠標滾輪或者按鈕來縮放圖表。
實現圖表的導出功能,允許用戶將當前的圖表保存為圖片或者PDF文件。


—元組(Tuple)操作)


![[大師C語言(第十九篇)]C語言函數式編程技術詳解](http://pic.xiahunao.cn/[大師C語言(第十九篇)]C語言函數式編程技術詳解)


)


的順序控制)


