1.安裝Docker
sudo mkdir -p /etc/docker
sudo tee /etc/docker/daemon.json <<-'EOF'
{"registry-mirrors":["https://hub-mirror.c.163.com"]
}
EOF
export DOWNLOAD_URL="https://hub-mirror.163.com/docker-ce"curl -fsSL https://get.docker.com/ |sh檢查docker版本查看是否安裝成功
docker -v安裝Docker-compose
sudo curl -L "https://github.com/docker/compose/releases/download/1.29.2/docker-compose-$(uname -s)-$(uname -m)" -o /usr/local/bin/docker-compose檢查版本
docker-compose -v
2.安裝prometheus
通過克隆gitee的代碼來進行安裝Prometheus
因為docker-compose安裝Prometheus需要進行大量的配置,這里推薦直接從gitee上克隆已經配置好的docker-compose文件
mkdir /datacd /datagit clone https://gitee.com/linge365/docker-prometheus.gitcd docker-prometheus當然以上這一步需要安裝git,也可以直接訪問https://gitee.com/linge365/docker-prometheus.git 下載對應的壓縮包,解壓后移動到/data目錄下即可
運行prometheus
運行命令
cd /data/docker-prometheusdocker-compose up -d檢查是否運行成功
查看正在運行的docker容器
docker ps[root@node1 bak]# docker ps
CONTAINER ID IMAGE COMMAND CREATED STATUS PORTS NAMES
932d17a43046 grafana/grafana:9.4.3 "/run.sh" 4 hours ago Up 15 seconds 0.0.0.0:3000->3000/tcp, :::3000->3000/tcp grafana
69256ba5c47e prom/prometheus:v2.37.6 "/bin/prometheus --c…" 4 hours ago Up 16 seconds 0.0.0.0:9090->9090/tcp, :::9090->9090/tcp prometheus
dbf5c7d39319 google/cadvisor:latest "/usr/bin/cadvisor -…" 4 hours ago Up 15 seconds 8080/tcp cadvisor
e9b1088b5767 prom/alertmanager:v0.25.0 "/bin/alertmanager -…" 4 hours ago Up 15 seconds 0.0.0.0:9093->9093/tcp, :::9093->9093/tcp alertmanager
b41ff00ca41b prom/node-exporter:v1.5.0 "/bin/node_exporter …" 4 hours ago Up 16 seconds 0.0.0.0:9100->9100/tcp, :::9100->9100/tcp node-exporter
到這里對應的容器就全部啟動了,這里需要將對應的端口開放進行訪問(云服務器需要開放對應的安全組或者防火墻),然后通過服務器ip+端口號在瀏覽器中即可訪問.(很重要)
web訪問地址
| 應用 | 訪問地址 | 備注 |
|---|---|---|
| prometheus | http://127.0.0.1:9090 | 無用戶和密碼 |
| grafana | http://127.0.0.1:3000 | admin/XXX |
| altermanager | http://127.0.0.1:9093 | 無用戶和密碼 |
| node-exporter | http://127.0.0.1:9100/metrics | 無用戶和密碼 |
遇到問題了,我再本機可以訪問這些端口,但是再其他機器上無法訪問端口,
1.防火墻攔截
??查看防火墻狀態firewall-cmd --state
? 關閉防火墻systemctl stop firewalld.service
? 禁止防火墻開機啟動systemctl disable firewalld.service
? 或者打開防火墻,但防火墻開放映射的端口
? firewall-cmd --zone=public --add-port=3000/tcp --permanent
? firewall-cmd --zone=public --add-port=9000/tcp --permanent
? firewall-cmd --zone=public --add-port=9090/tcp --permanent
? firewall-cmd --zone=public --add-port=9100/tcp --permanent 等等
2.沒有開啟ip轉發
? 查看是否開啟
# 1.查看是否開啟,若不等于1則沒有開啟
sysctl net.ipv4.ip_forward
# 2.修改sysctl.conf文件開啟
vim /etc/sysctl.conf
# 3,配置=1
net.ipv4.ip_forward=1
# 4. 重啟網絡,讓配置生效
systemctl restart network
# 5.再次查看是否等于1
sysctl net.ipv4.ip_forward
3.做完上述操作,一定要systemctl restart docker? 。否則也不會好使。
3.檢查各個端口程序
3.1grafana
這里grafana的配置文件中默認配置的密碼為password,所以直接輸入admin/password即可訪問成功.

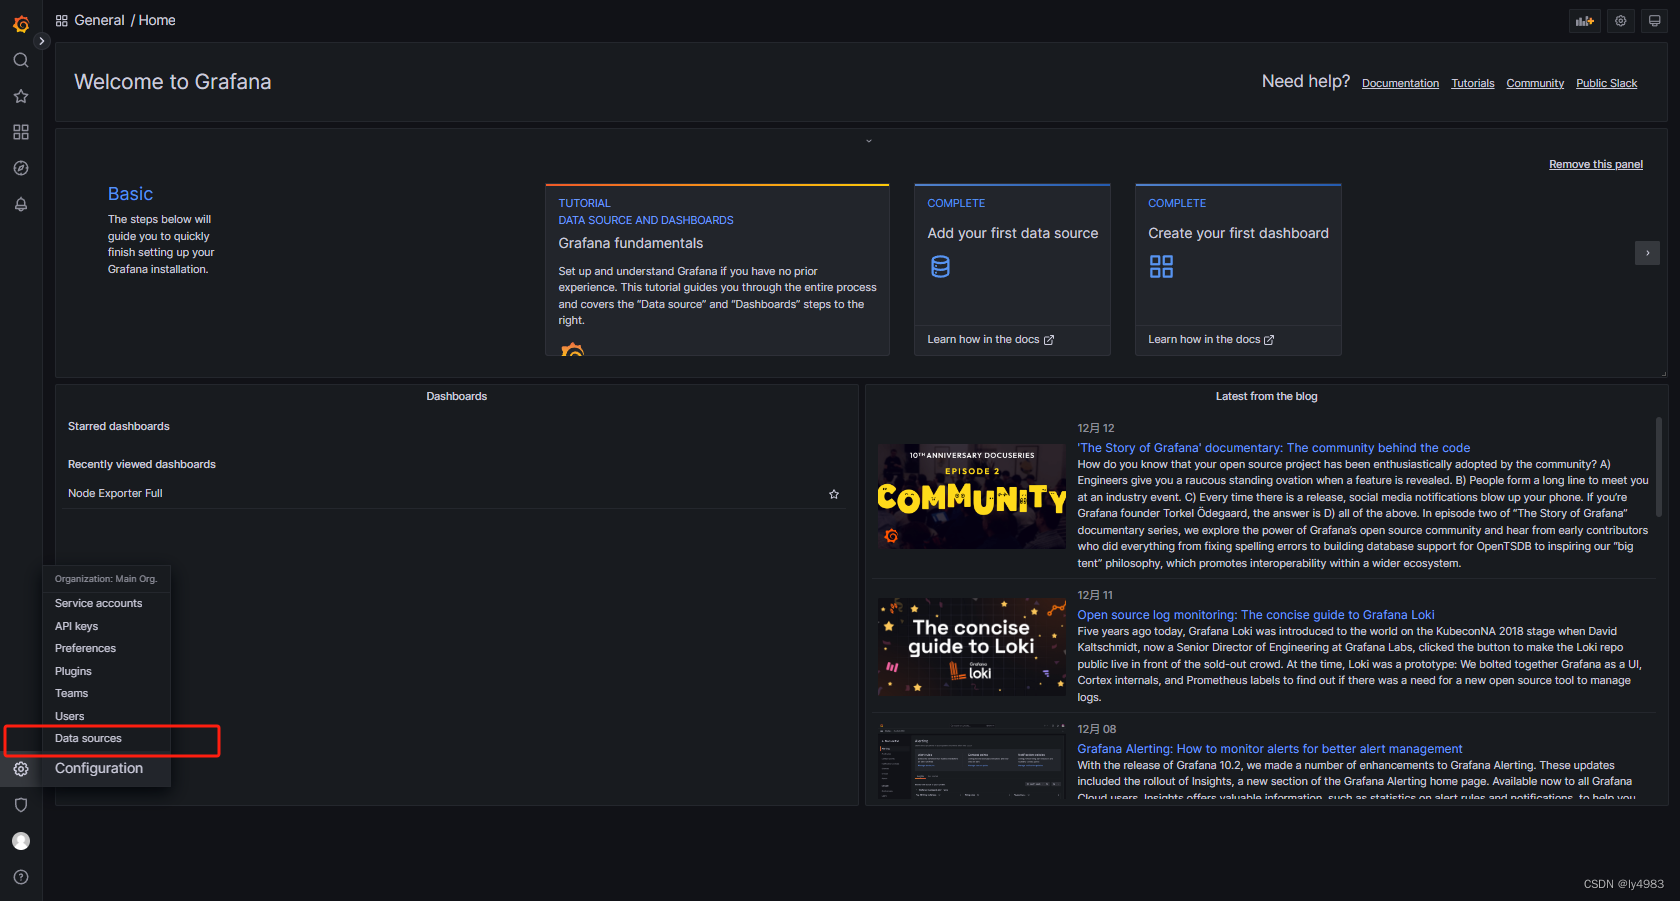
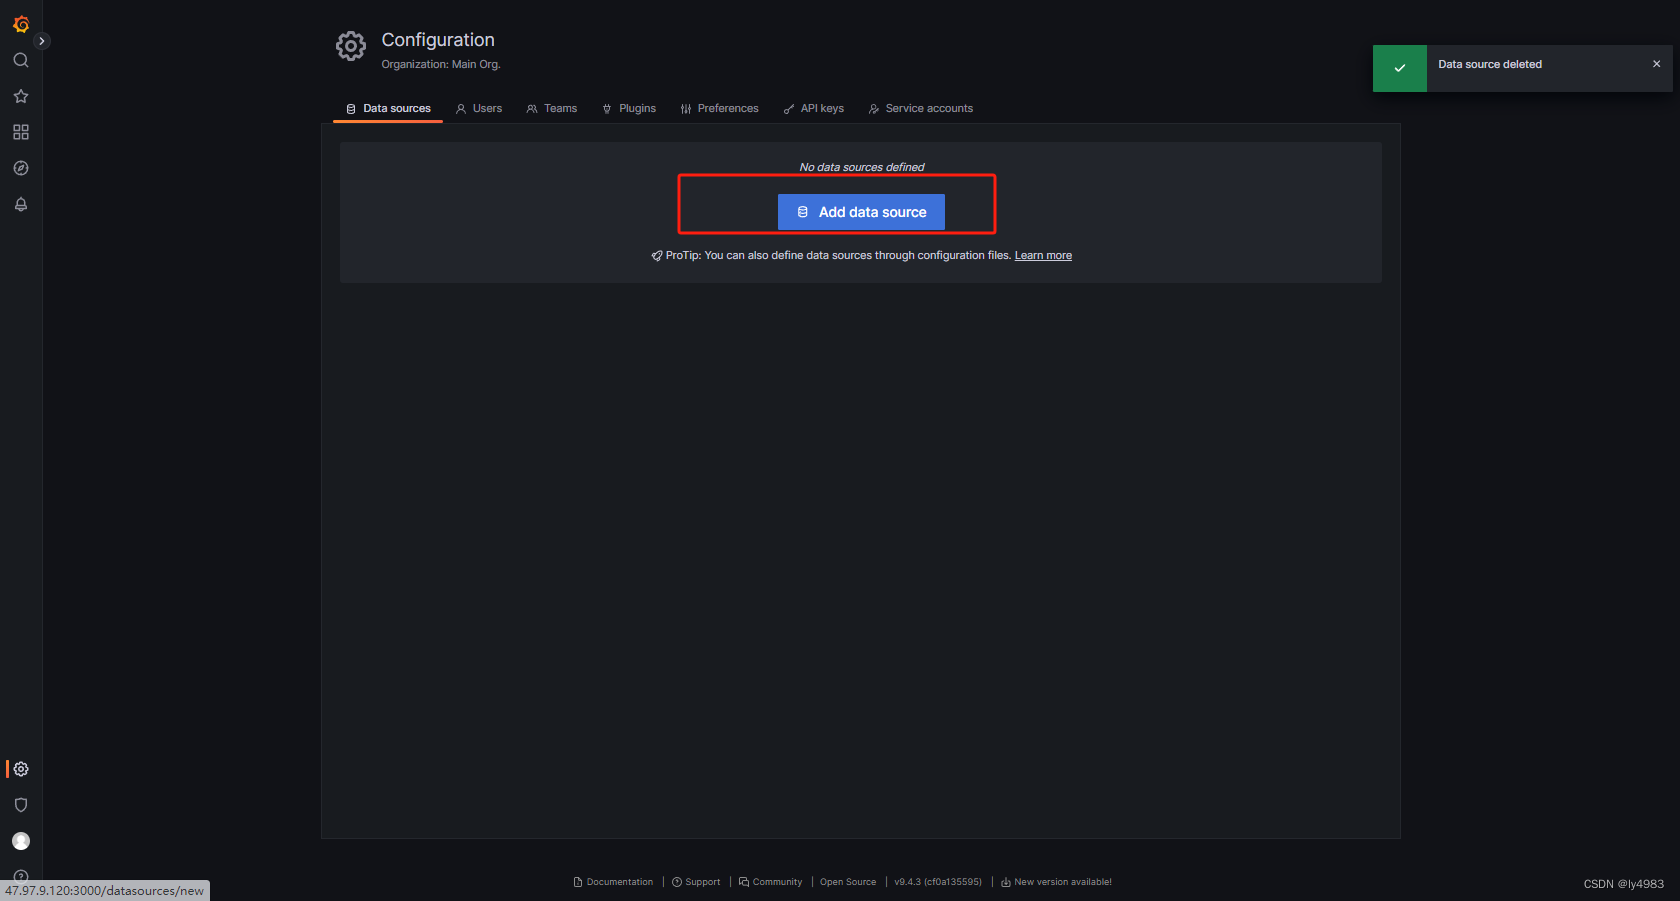
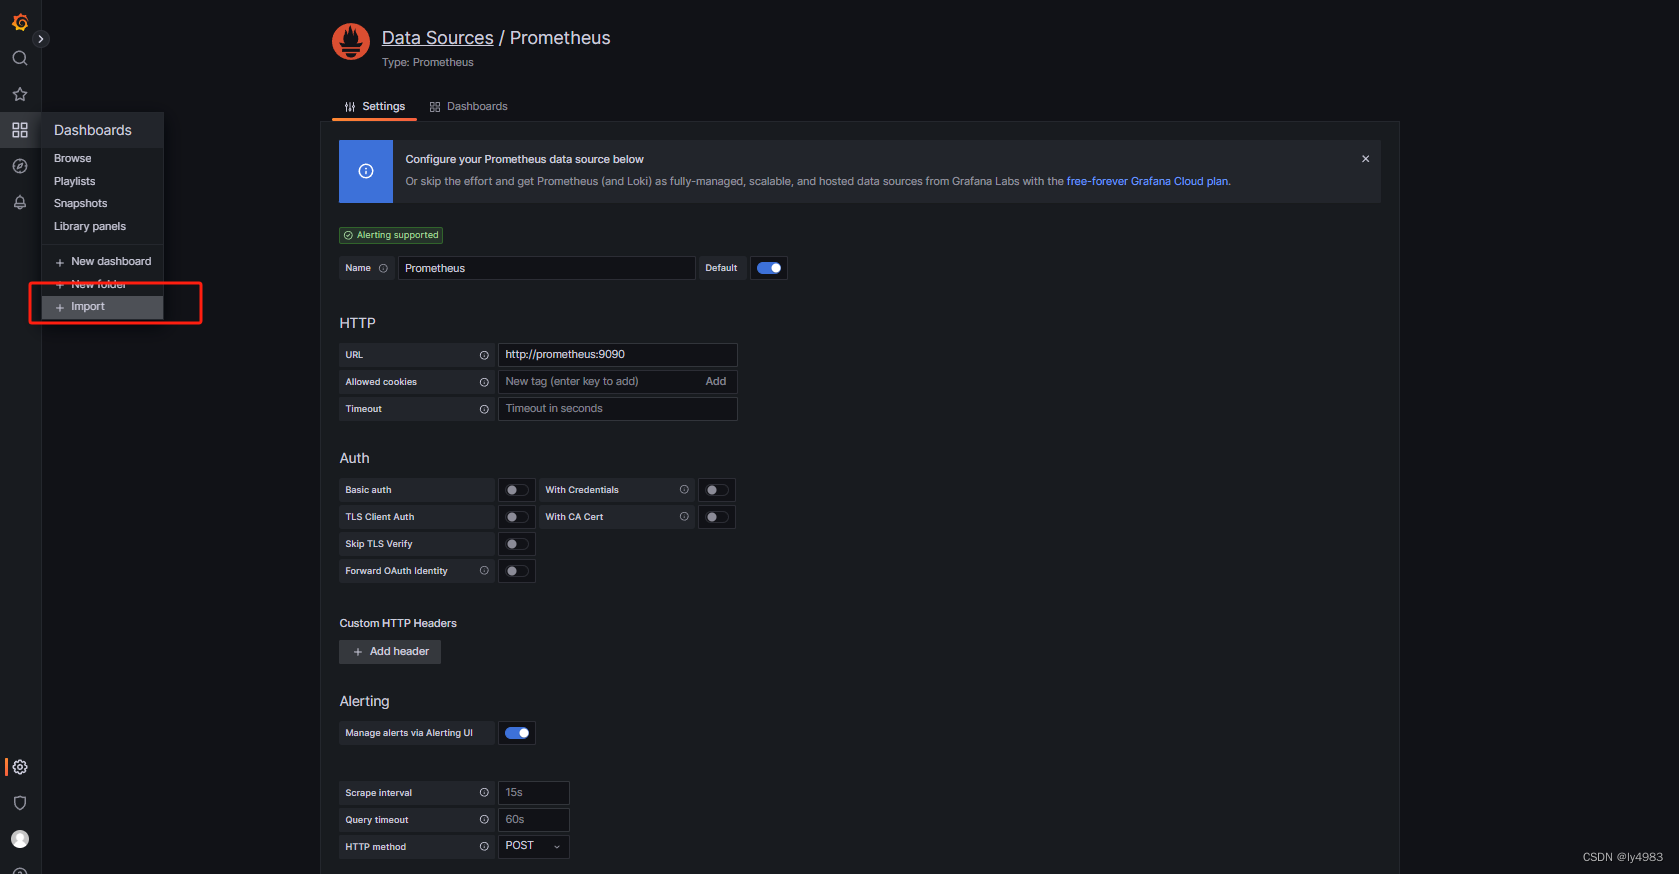
添加數據源
在下方齒輪圖標選擇添加數據源
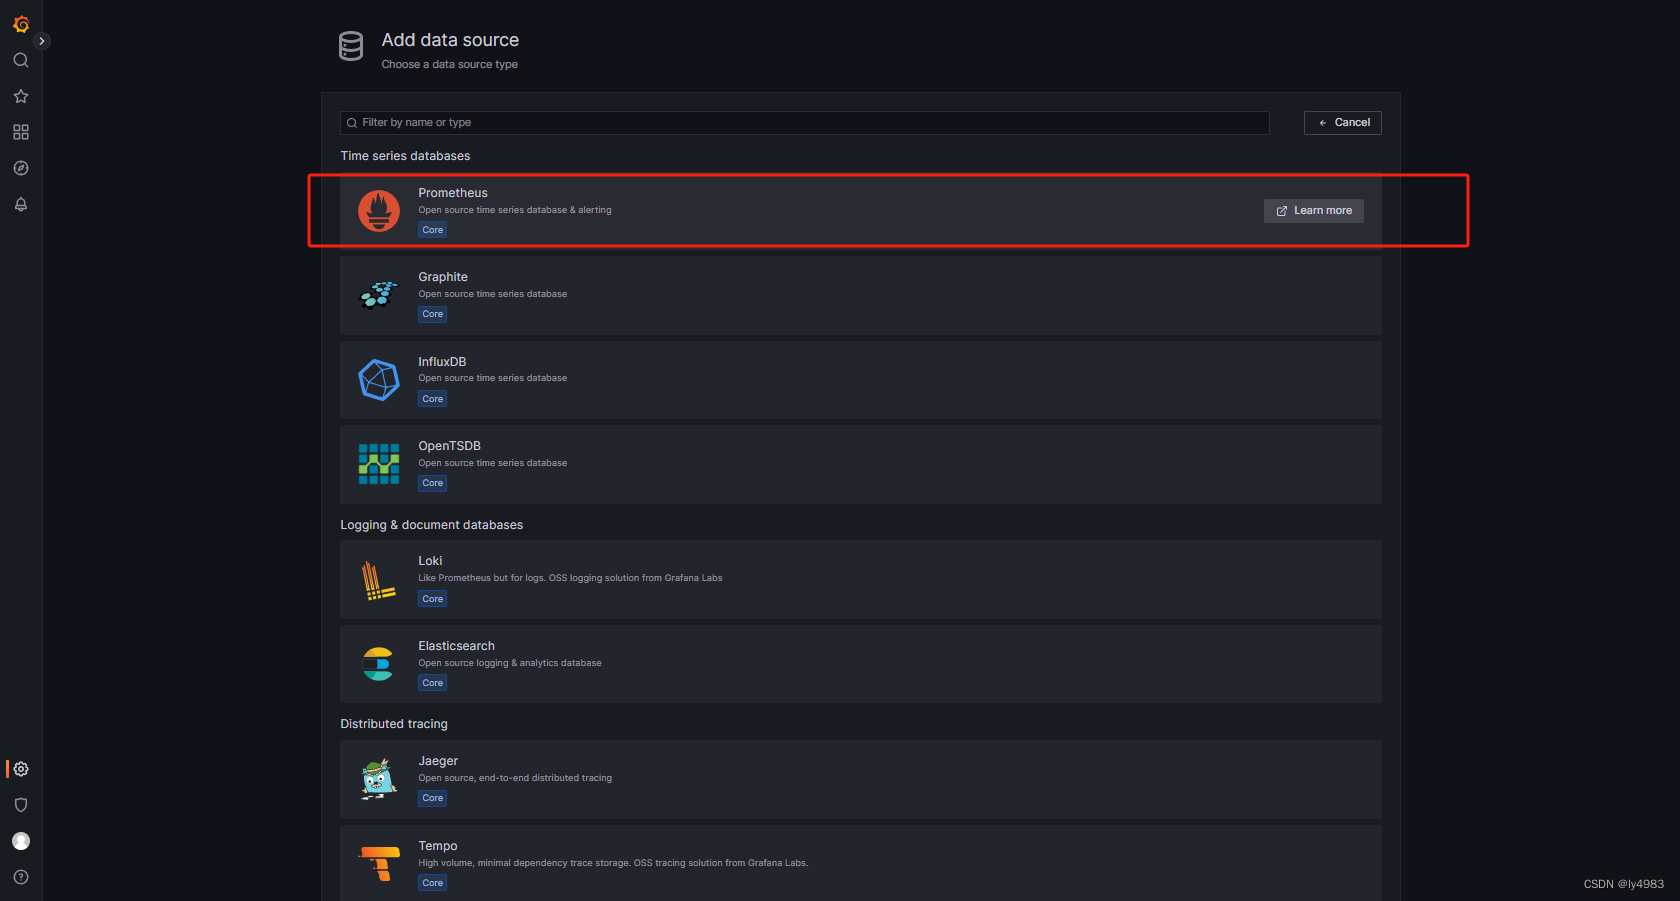
選擇Prometheus作為數據源
填寫Prometheus的地址,這里的ip需要將服務名作為地址填寫在URL中 我填寫的內容是http://10.23.3.2:9090
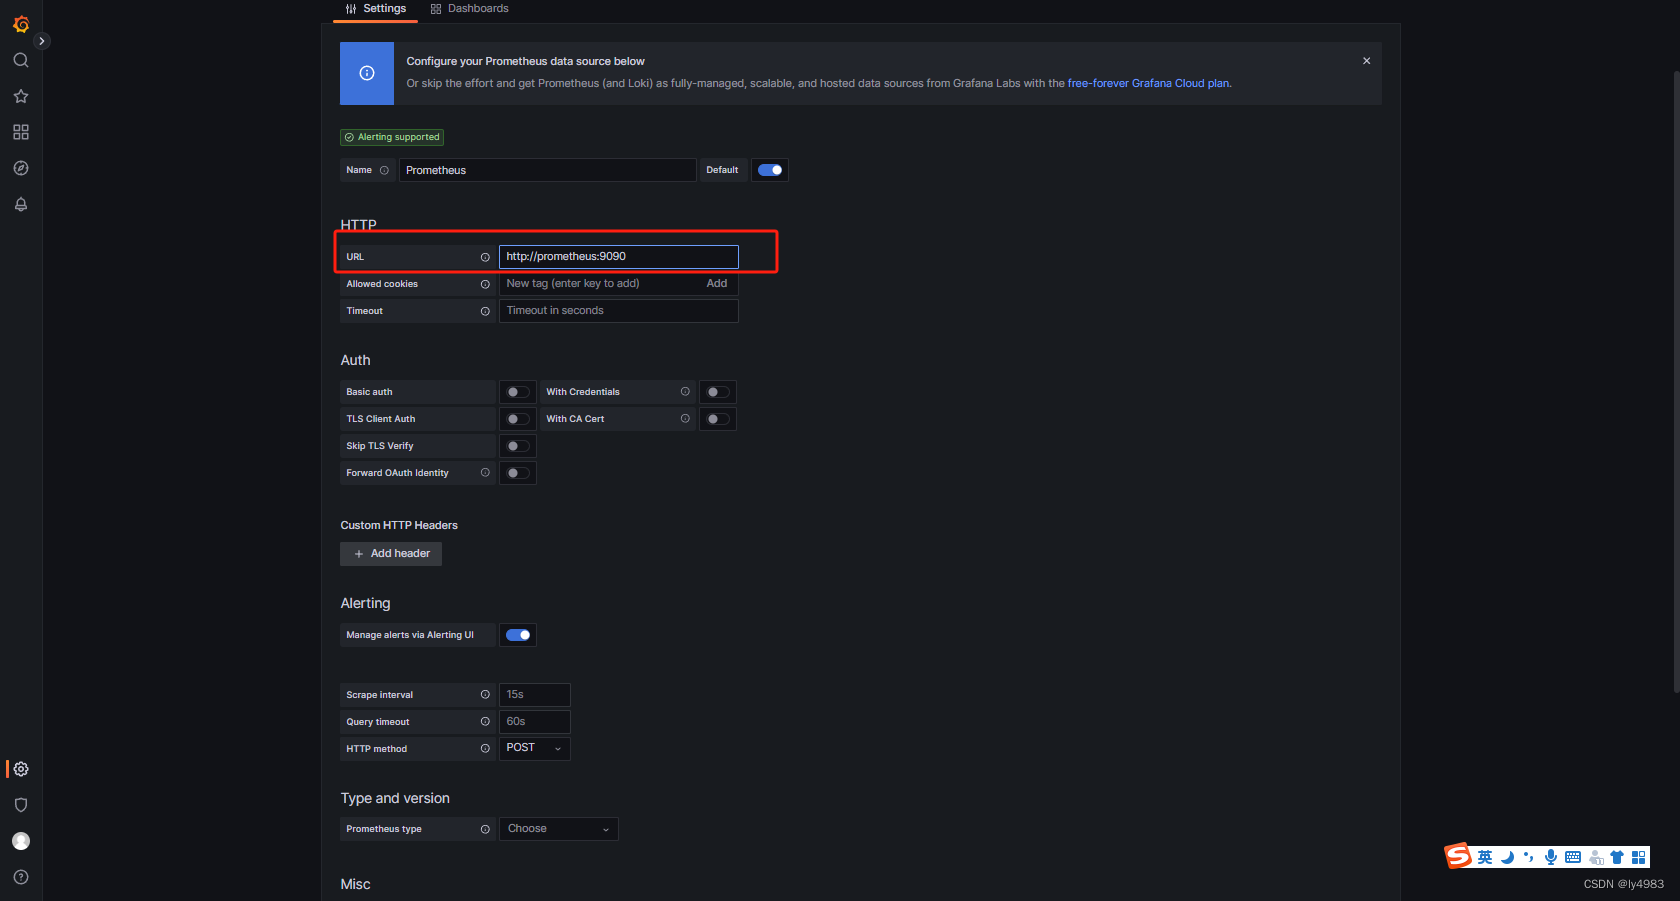
下滑到最下方測試并保存

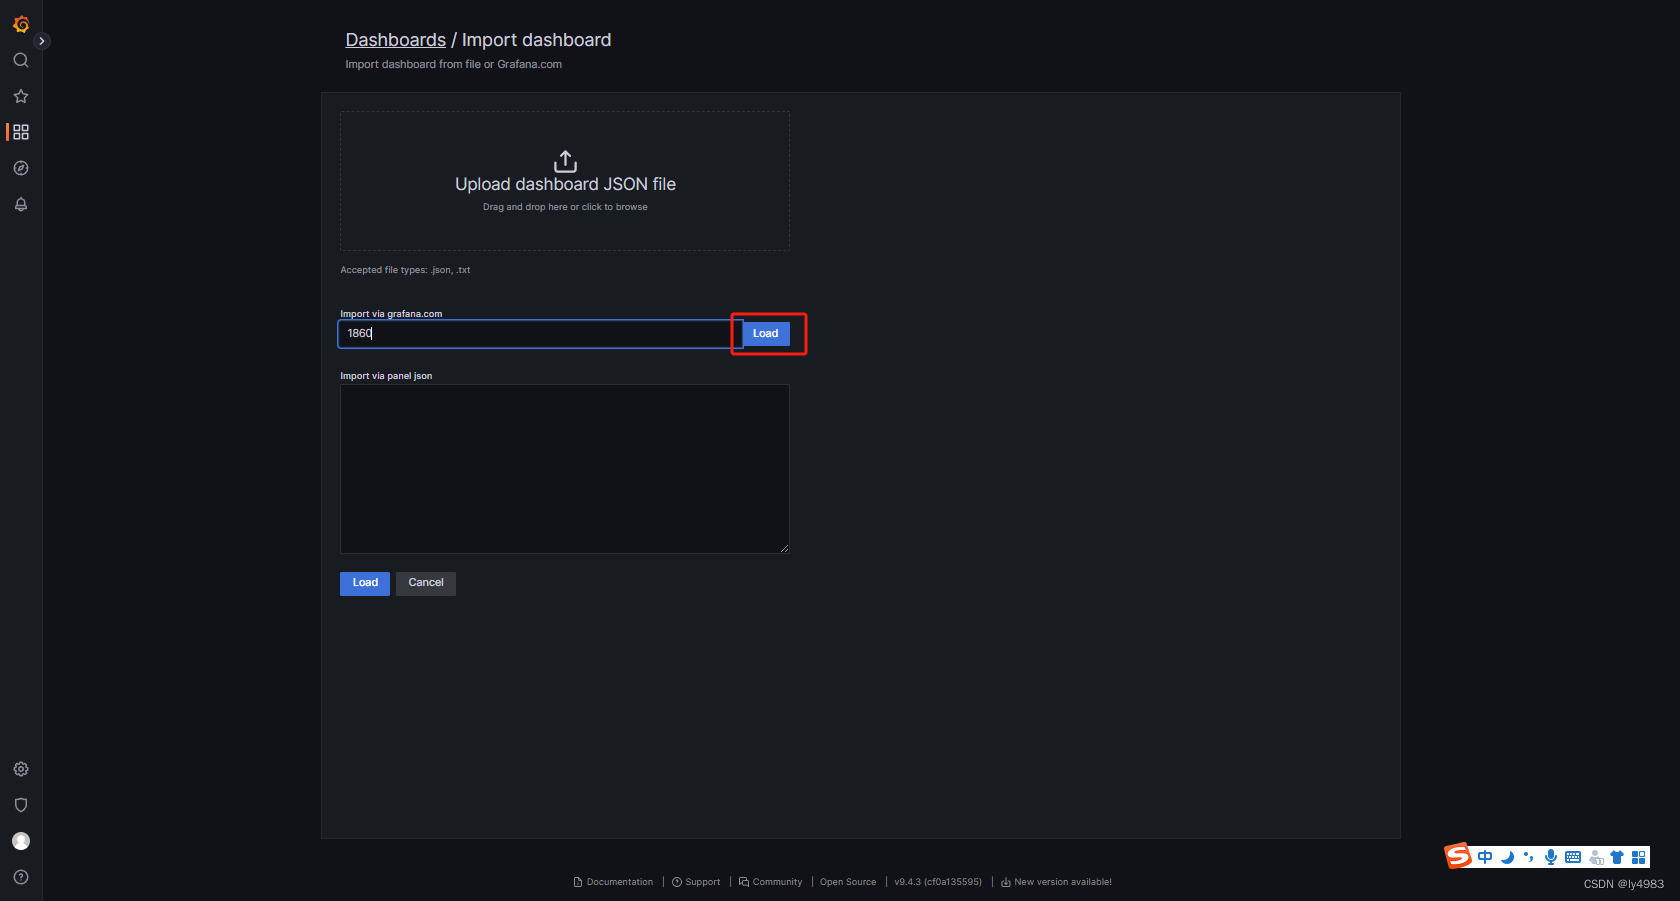
導入儀表盤
選擇左邊儀表盤圖標點擊導入
這里需要導入一個儀表盤的URL或者id
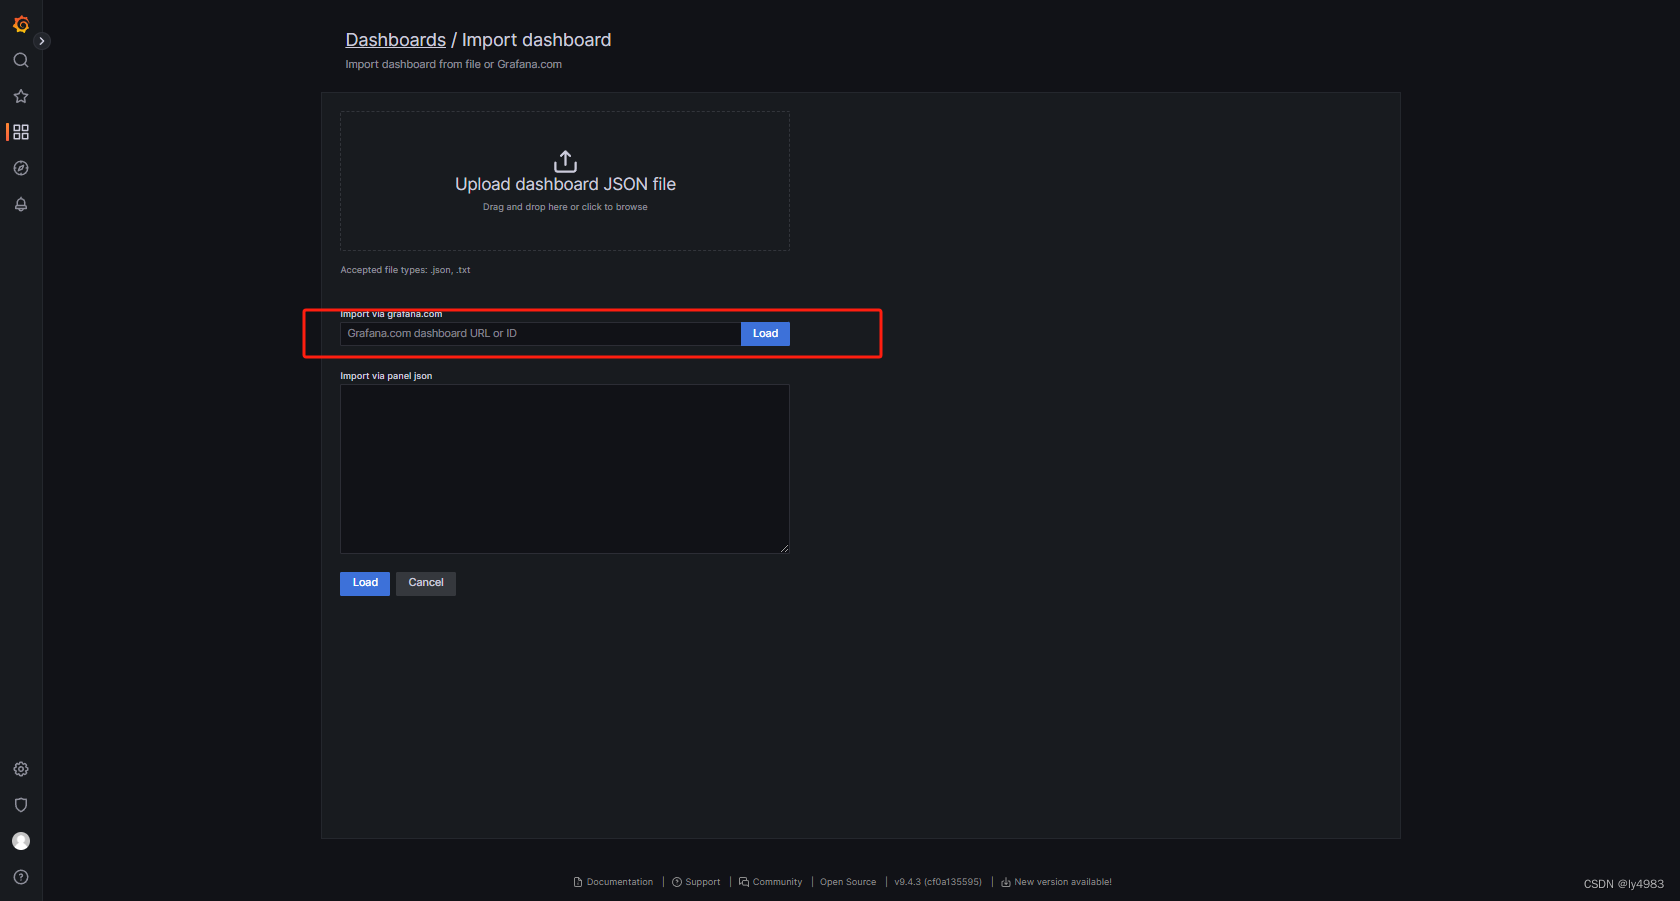
我填寫的是1860
也可以直接訪問https://grafana.com/grafana/dashboards/路徑進入官網進行復制,直接選擇Node Exproter Full
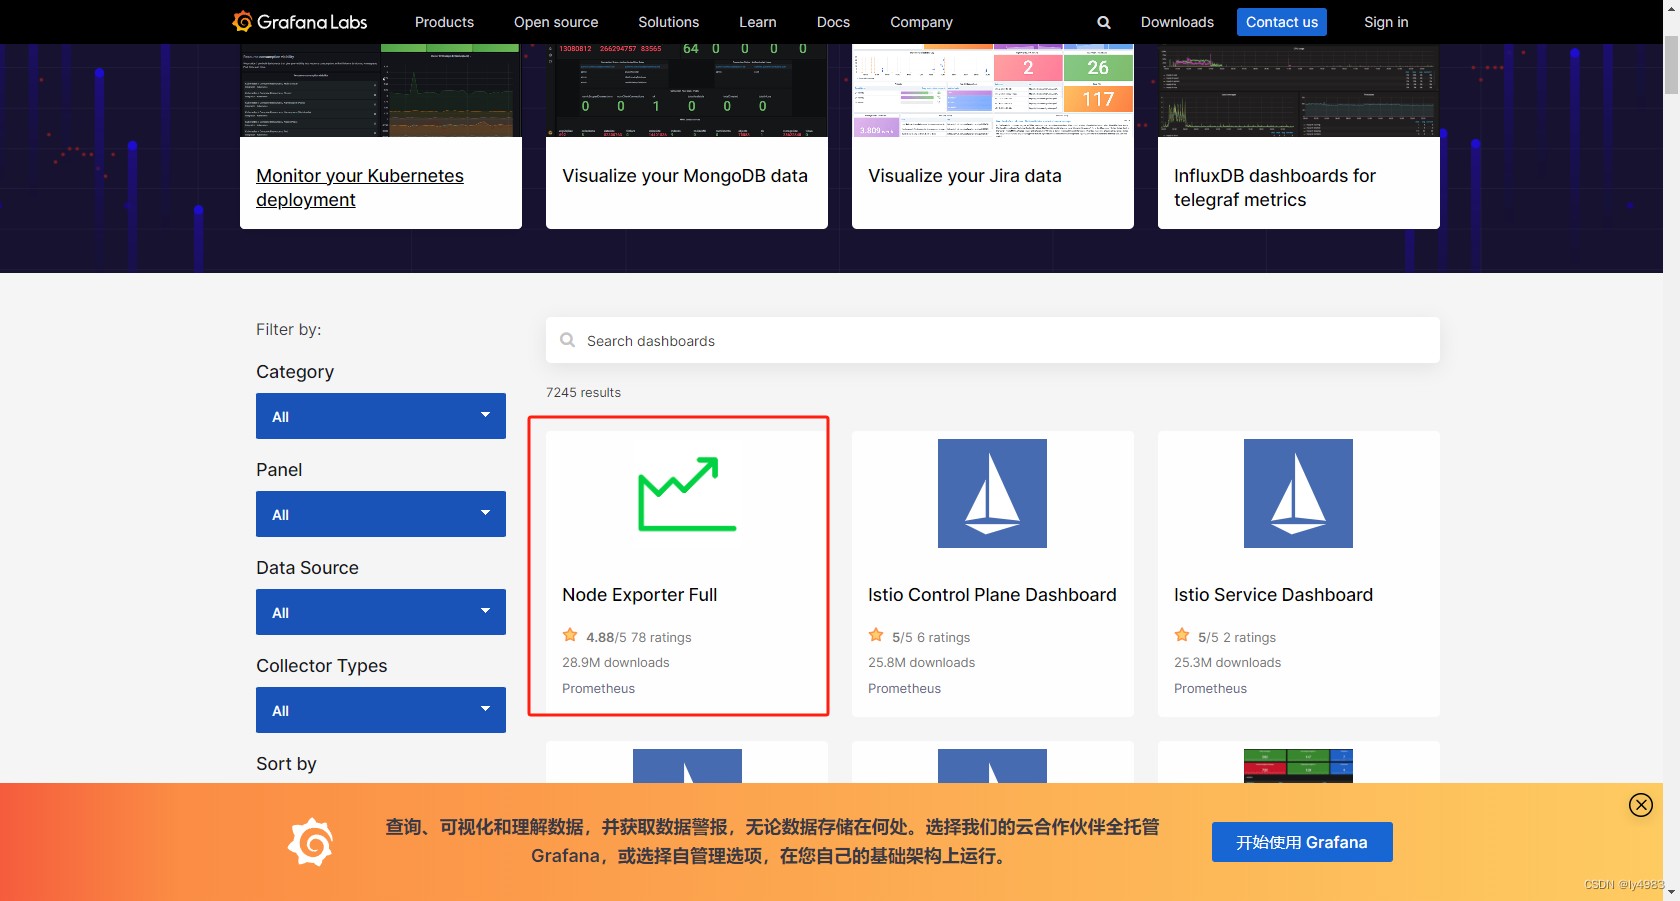
選擇Copy ID
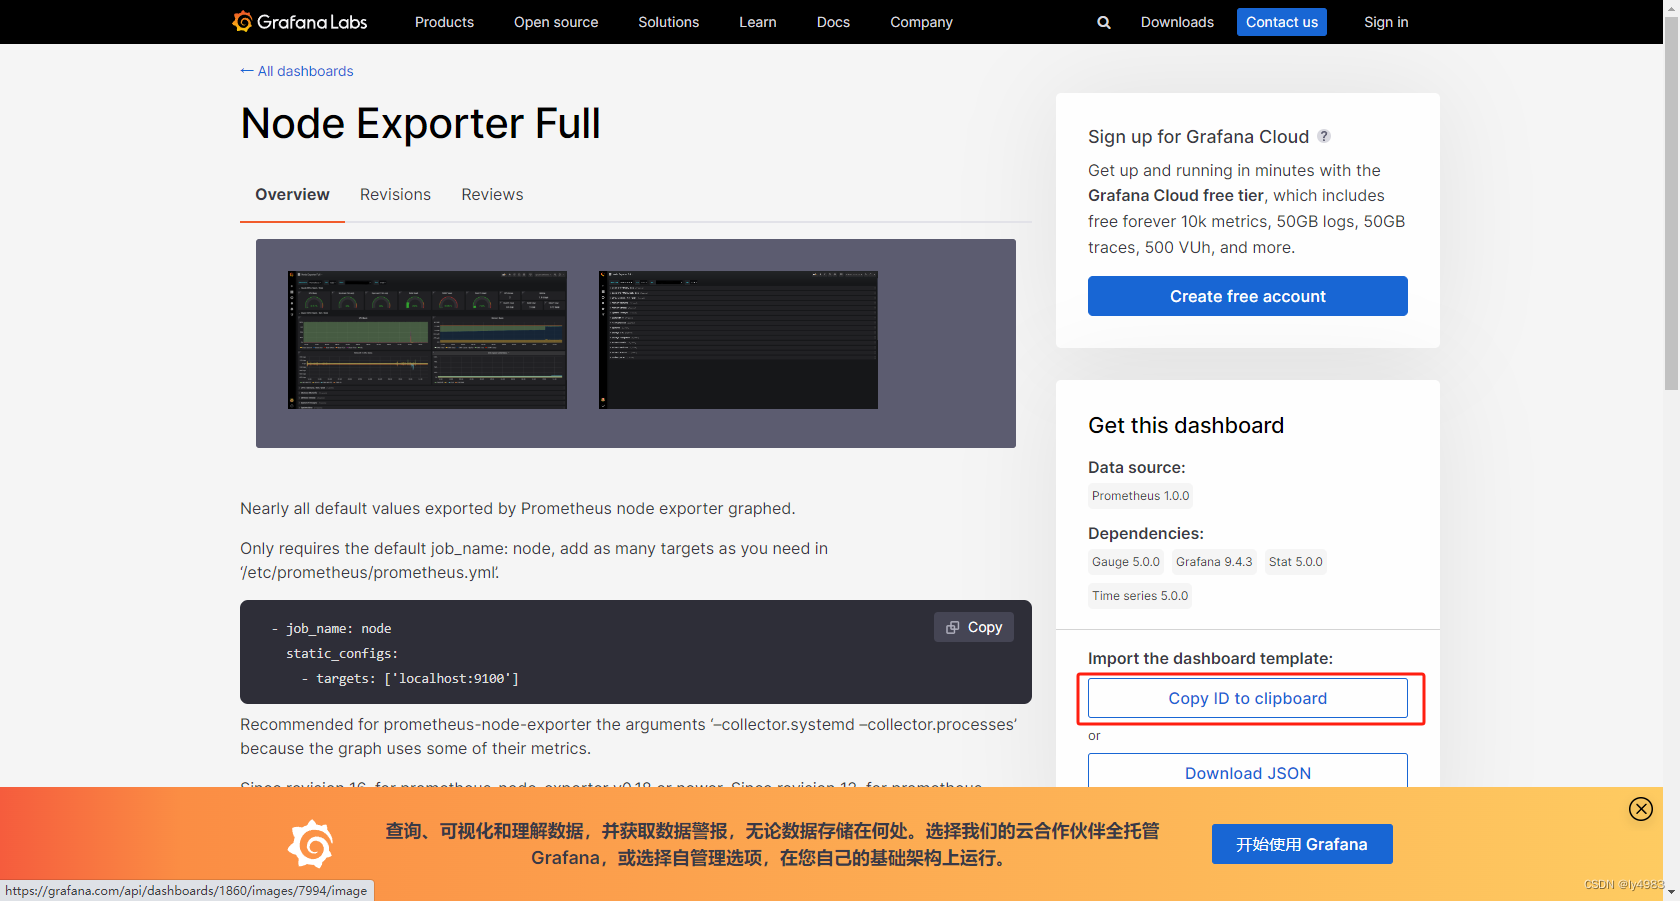
然后粘貼到剛剛的輸入框中,點擊加載(Load)按鈕
然后選擇Prometheus作為數據源
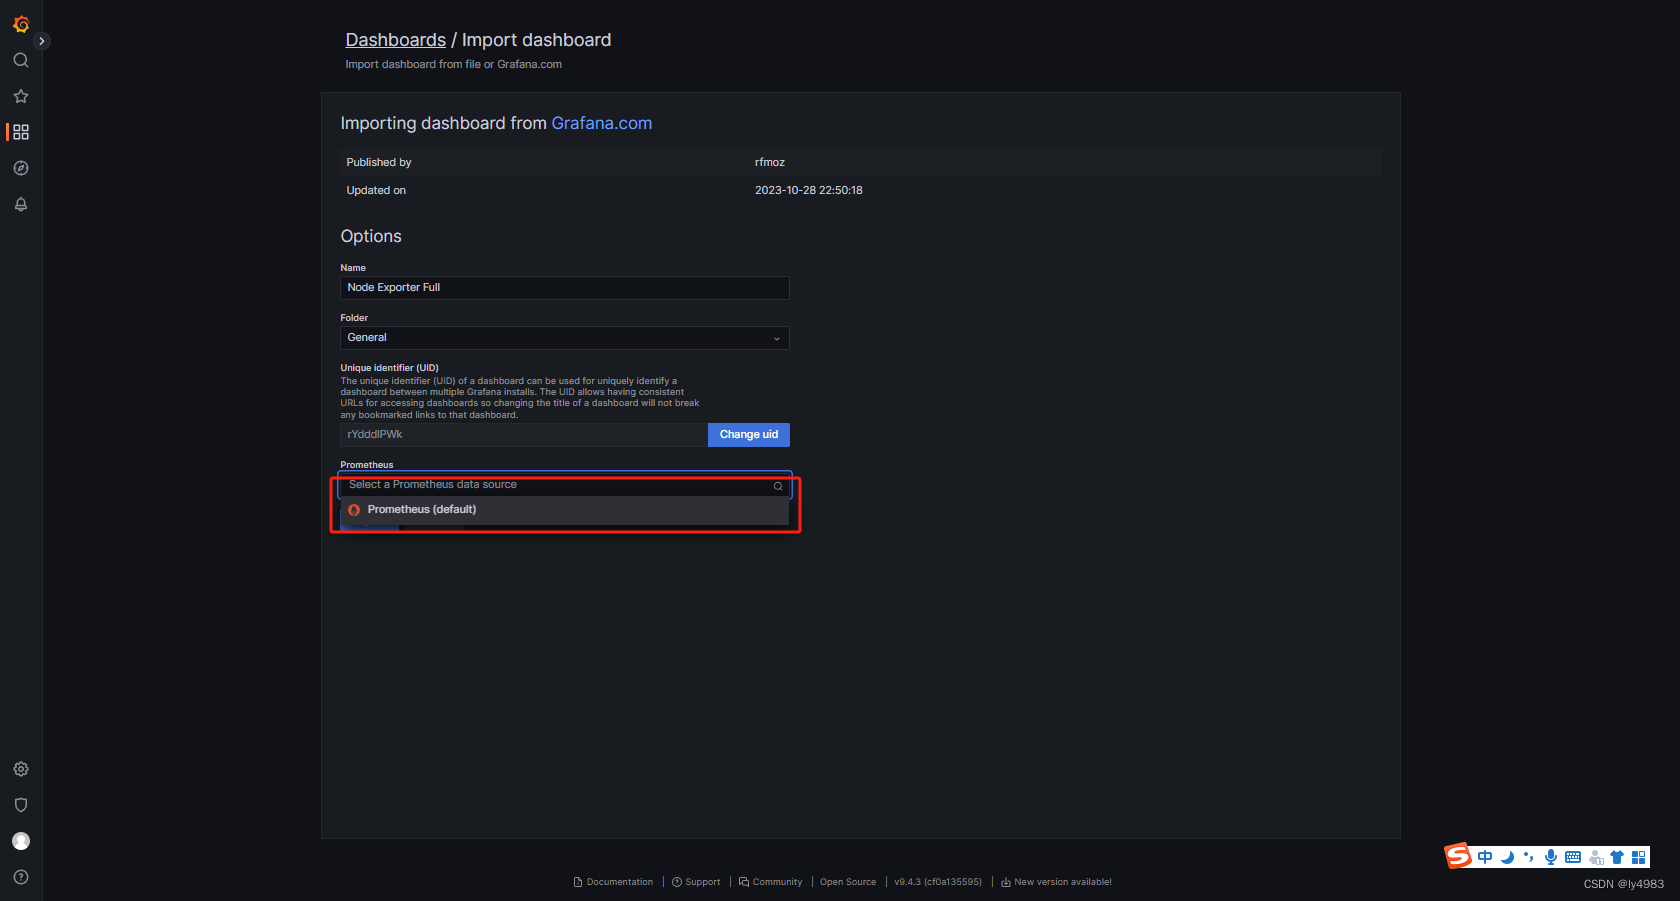
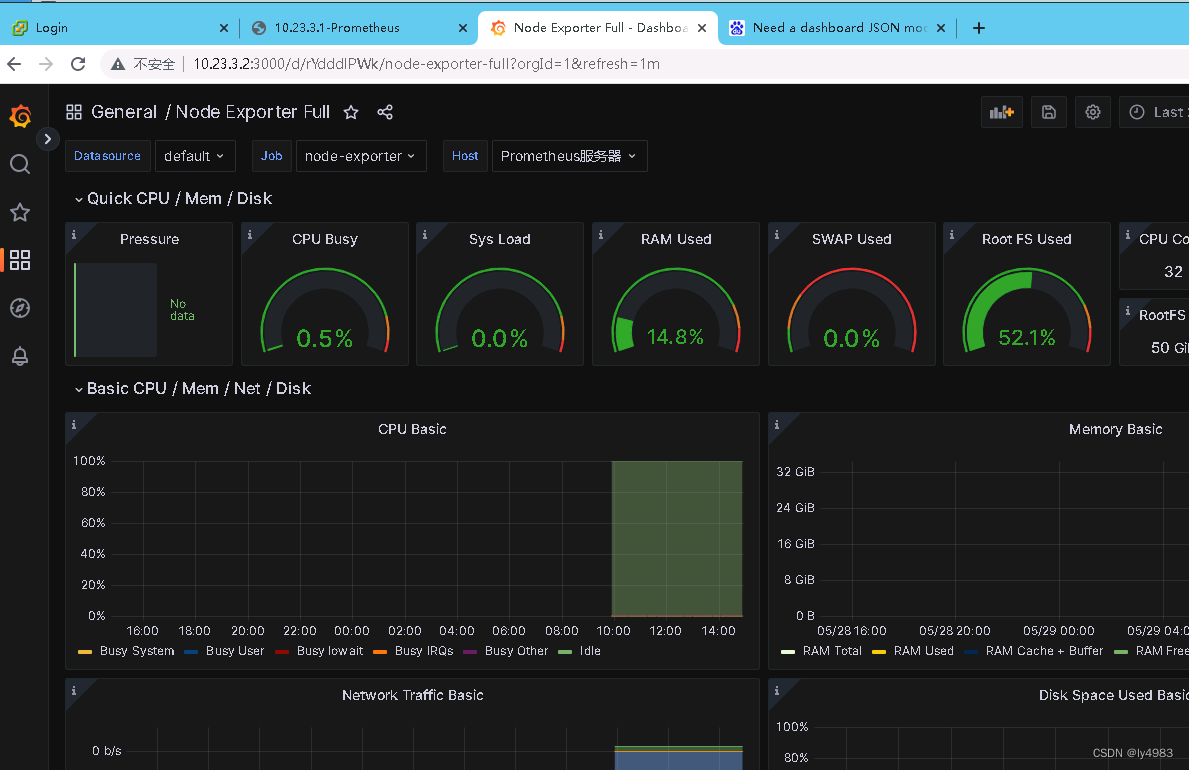
點擊導入,即可進入儀表盤界面
8919的界面
16098? job分組的

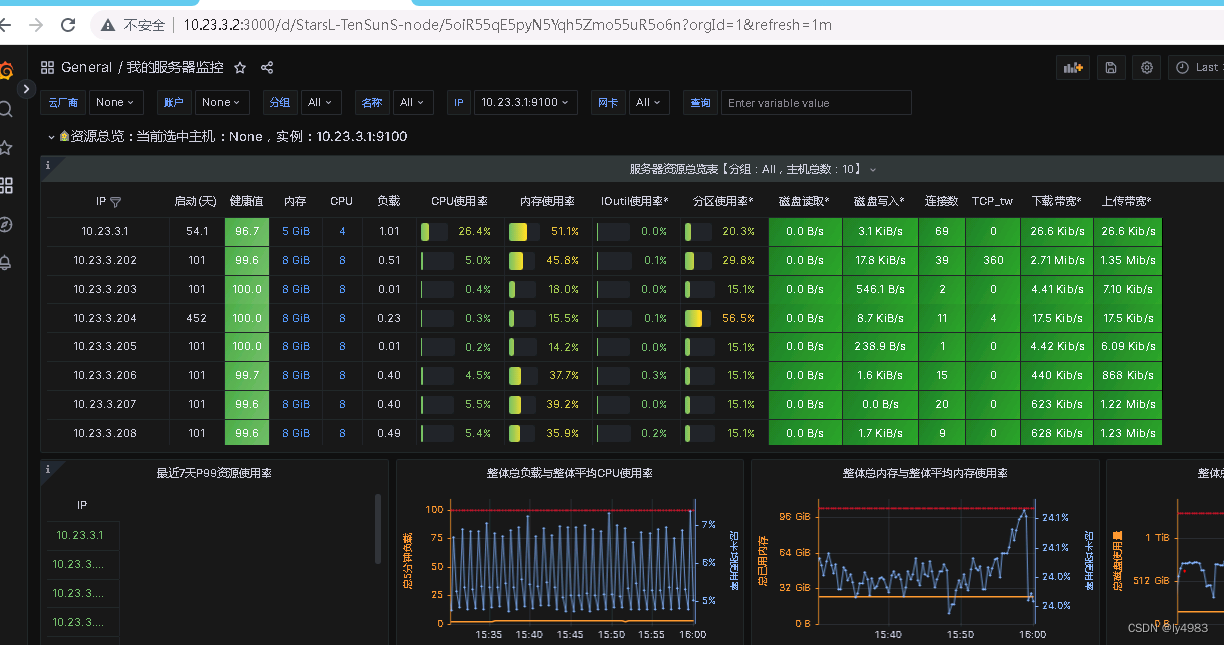
添加精簡導出器
我這邊根據網絡上面的dashardboard進行修改,使用在工作中的dashboard如下圖。
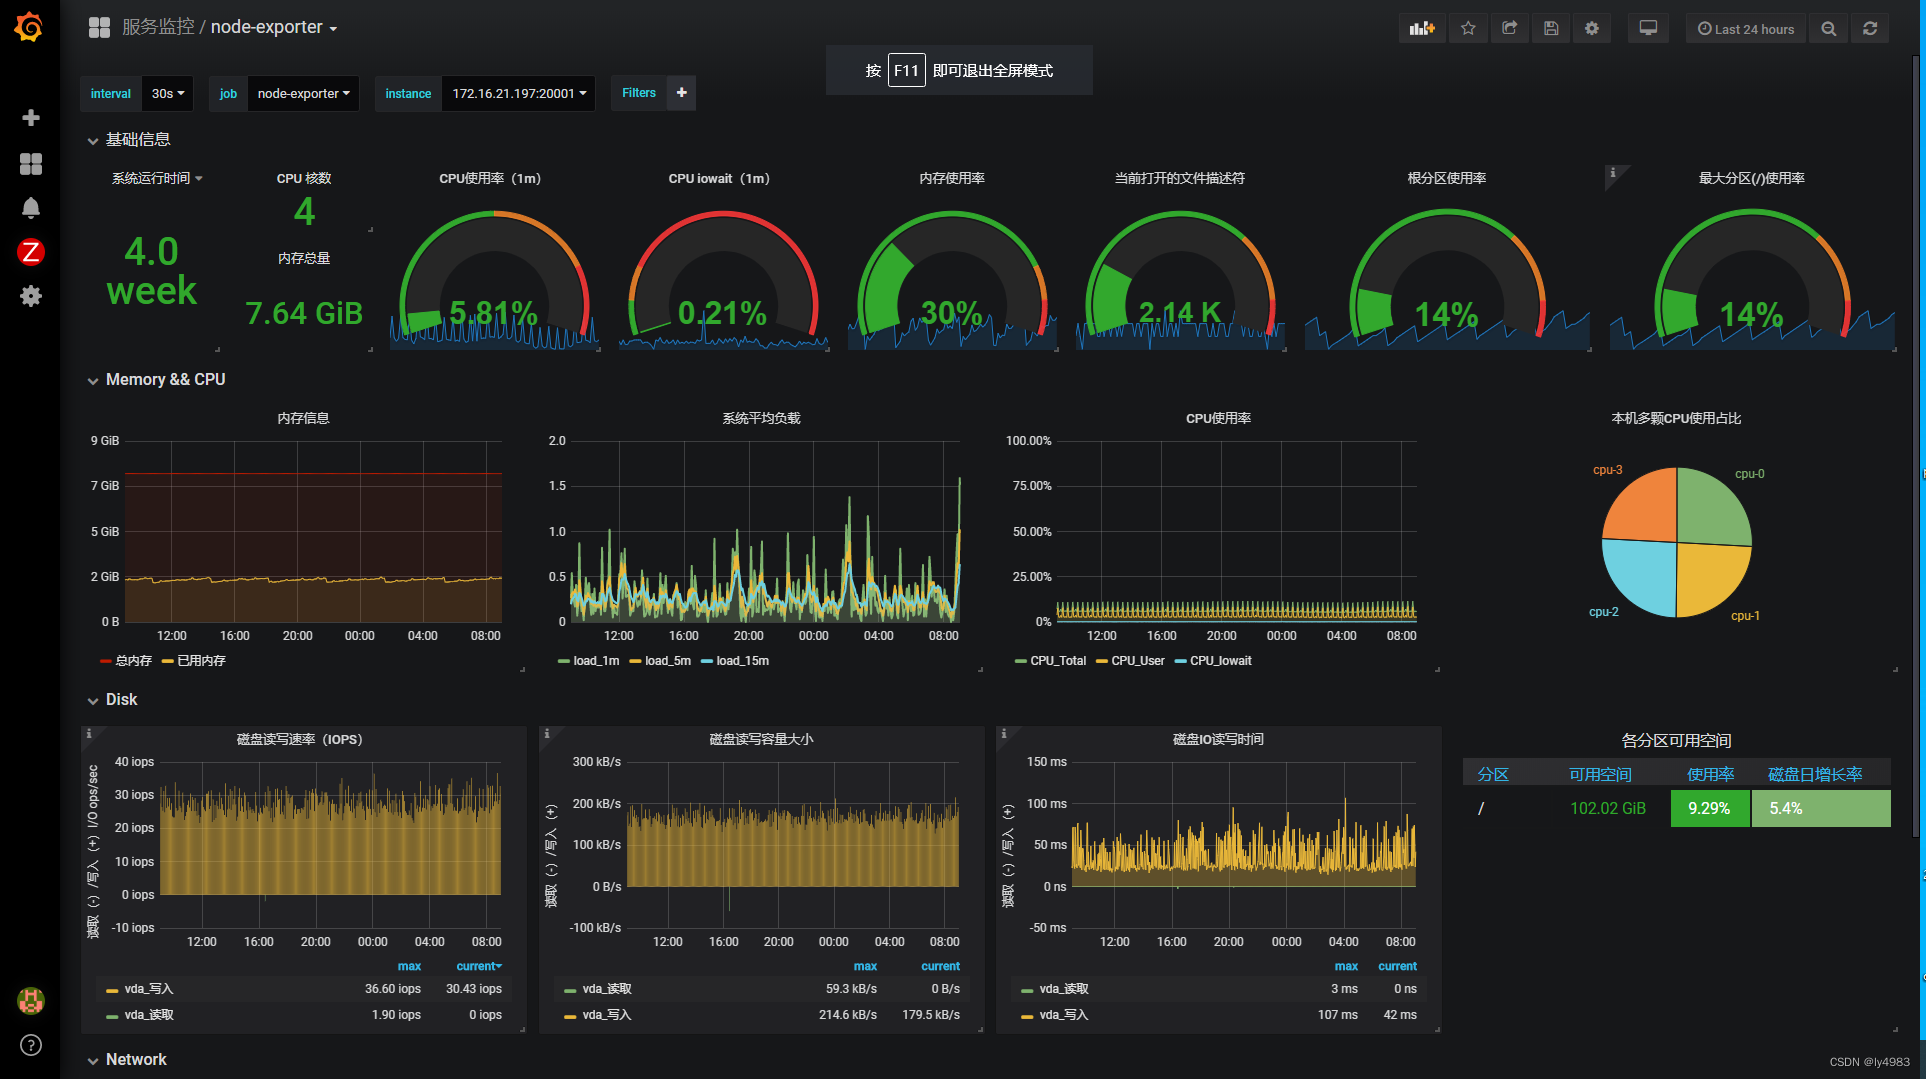
在import中不輸入1860,而是在下面json中輸入一下內容
{"annotations": {"list": [{"builtIn": 1,"datasource": "-- Grafana --","enable": true,"hide": true,"iconColor": "rgba(0, 211, 255, 1)","name": "Annotations & Alerts","type": "dashboard"}]},"description": "node-exporter","editable": true,"gnetId": 8919,"graphTooltip": 1,"id": 131,"iteration": 1569546050404,"links": [],"panels": [{"collapsed": false,"gridPos": {"h": 1,"w": 24,"x": 0,"y": 0},"id": 180,"panels": [],"repeat": null,"title": "基礎信息","type": "row"},{"cacheTimeout": null,"colorBackground": false,"colorPostfix": false,"colorPrefix": false,"colorValue": true,"colors": ["rgba(245, 54, 54, 0.9)","rgba(237, 129, 40, 0.89)","rgba(50, 172, 45, 0.97)"],"datasource": "Prometheus","decimals": 1,"description": "","format": "s","gauge": {"maxValue": 100,"minValue": 0,"show": false,"thresholdLabels": false,"thresholdMarkers": true},"gridPos": {"h": 5,"w": 2,"x": 0,"y": 1},"hideTimeOverride": true,"id": 15,"interval": null,"links": [],"mappingType": 1,"mappingTypes": [{"name": "value to text","value": 1},{"name": "range to text","value": 2}],"maxDataPoints": 100,"nullPointMode": "null","nullText": null,"postfix": "","postfixFontSize": "50%","prefix": "","prefixFontSize": "50%","rangeMaps": [{"from": "null","text": "N/A","to": "null"}],"sparkline": {"fillColor": "rgba(31, 118, 189, 0.18)","full": false,"lineColor": "rgb(31, 120, 193)","show": false},"tableColumn": "","targets": [{"expr": "time() - node_boot_time_seconds{instance=~\"$instance\"}","format": "time_series","hide": false,"instant": true,"intervalFactor": 2,"legendFormat": "","refId": "A","step": 40}],"thresholds": "1,2","title": "系統運行時間","transparent": true,"type": "singlestat","valueFontSize": "100%","valueMaps": [{"op": "=","text": "N/A","value": "null"}],"valueName": "current"},{"cacheTimeout": null,"colorBackground": false,"colorPostfix": false,"colorValue": true,"colors": ["rgba(245, 54, 54, 0.9)","rgba(237, 129, 40, 0.89)","rgba(50, 172, 45, 0.97)"],"datasource": "Prometheus","description": "","format": "short","gauge": {"maxValue": 100,"minValue": 0,"show": false,"thresholdLabels": false,"thresholdMarkers": true},"gridPos": {"h": 2,"w": 2,"x": 2,"y": 1},"id": 14,"interval": null,"links": [],"mappingType": 1,"mappingTypes": [{"name": "value to text","value": 1},{"name": "range to text","value": 2}],"maxDataPoints": 100,"minSpan": 4,"nullPointMode": "null","nullText": null,"postfix": "","postfixFontSize": "50%","prefix": "","prefixFontSize": "50%","rangeMaps": [{"from": "null","text": "N/A","to": "null"}],"sparkline": {"fillColor": "rgba(31, 118, 189, 0.18)","full": false,"lineColor": "rgb(31, 120, 193)","show": false},"tableColumn": "","targets": [{"expr": "count(count(node_cpu_seconds_total{instance=~\"$instance\", mode='system',job=\"$job\"}) by (cpu))","format": "time_series","instant": true,"intervalFactor": 1,"legendFormat": "","refId": "A","step": 20}],"thresholds": "1,2","title": "CPU 核數","transparent": true,"type": "singlestat","valueFontSize": "100%","valueMaps": [{"op": "=","text": "N/A","value": "null"}],"valueName": "current"},{"cacheTimeout": null,"colorBackground": false,"colorValue": true,"colors": ["rgba(50, 172, 45, 0.97)","rgba(237, 129, 40, 0.89)","rgba(245, 54, 54, 0.9)"],"datasource": "Prometheus","decimals": 2,"description": "","format": "percent","gauge": {"maxValue": 100,"minValue": 0,"show": true,"thresholdLabels": false,"thresholdMarkers": true},"gridPos": {"h": 5,"w": 3,"x": 4,"y": 1},"id": 167,"interval": null,"links": [],"mappingType": 1,"mappingTypes": [{"name": "value to text","value": 1},{"name": "range to text","value": 2}],"maxDataPoints": 100,"minSpan": 2,"nullPointMode": "null","nullText": null,"postfix": "","postfixFontSize": "50%","prefix": "","prefixFontSize": "50%","rangeMaps": [{"from": "null","text": "N/A","to": "null"}],"sparkline": {"fillColor": "rgba(31, 118, 189, 0.18)","full": false,"lineColor": "rgb(31, 120, 193)","show": true},"tableColumn": "","targets": [{"expr": "100 - (avg(irate(node_cpu_seconds_total{instance=~\"$instance\",mode=\"idle\",job=\"$job\"}[1m])) * 100)","format": "time_series","hide": false,"interval": "","intervalFactor": 1,"legendFormat": "","refId": "A","step": 20}],"thresholds": "50,80","title": "CPU使用率(1m)","transparent": true,"type": "singlestat","valueFontSize": "80%","valueMaps": [{"op": "=","text": "N/A","value": "null"}],"valueName": "current"},{"cacheTimeout": null,"colorBackground": false,"colorValue": true,"colors": ["rgba(50, 172, 45, 0.97)","rgba(237, 129, 40, 0.89)","rgba(245, 54, 54, 0.9)"],"datasource": "Prometheus","decimals": 2,"description": "","format": "percent","gauge": {"maxValue": 100,"minValue": 0,"show": true,"thresholdLabels": false,"thresholdMarkers": true},"gridPos": {"h": 5,"w": 3,"x": 7,"y": 1},"id": 20,"interval": null,"links": [],"mappingType": 1,"mappingTypes": [{"name": "value to text","value": 1},{"name": "range to text","value": 2}],"maxDataPoints": 100,"minSpan": 2,"nullPointMode": "null","nullText": null,"postfix": "","postfixFontSize": "50%","prefix": "","prefixFontSize": "50%","rangeMaps": [{"from": "null","text": "N/A","to": "null"}],"sparkline": {"fillColor": "rgba(31, 118, 189, 0.18)","full": false,"lineColor": "rgb(31, 120, 193)","show": true},"tableColumn": "","targets": [{"expr": "avg(irate(node_cpu_seconds_total{instance=~\"$instance\",mode=\"iowait\",job=\"$job\"}[1m])) * 100","format": "time_series","hide": false,"interval": "","intervalFactor": 1,"legendFormat": "","refId": "A","step": 20}],"thresholds": "10,20","title": "CPU iowait(1m)","transparent": true,"type": "singlestat","valueFontSize": "80%","valueMaps": [{"op": "=","text": "N/A","value": "null"}],"valueName": "current"},{"cacheTimeout": null,"colorBackground": false,"colorValue": true,"colors": ["rgba(50, 172, 45, 0.97)","rgba(237, 129, 40, 0.89)","rgba(245, 54, 54, 0.9)"],"datasource": "Prometheus","decimals": 0,"description": "","format": "percent","gauge": {"maxValue": 100,"minValue": 0,"show": true,"thresholdLabels": false,"thresholdMarkers": true},"gridPos": {"h": 5,"w": 3,"x": 10,"y": 1},"hideTimeOverride": false,"id": 172,"interval": null,"links": [],"mappingType": 1,"mappingTypes": [{"name": "value to text","value": 1},{"name": "range to text","value": 2}],"maxDataPoints": 100,"minSpan": 4,"nullPointMode": "null","nullText": null,"postfix": "","postfixFontSize": "50%","prefix": "","prefixFontSize": "50%","rangeMaps": [{"from": "null","text": "N/A","to": "null"}],"sparkline": {"fillColor": "rgba(31, 118, 189, 0.18)","full": false,"lineColor": "rgb(31, 120, 193)","show": true},"tableColumn": "","targets": [{"expr": "(1 - (node_memory_MemAvailable_bytes{instance=~\"$instance\",job=\"$job\"} / (node_memory_MemTotal_bytes{instance=~\"$instance\",job=\"$job\"})))* 100","format": "time_series","hide": false,"interval": "10s","intervalFactor": 1,"refId": "A","step": 20}],"thresholds": "80,90","title": "內存使用率","transparent": true,"type": "singlestat","valueFontSize": "80%","valueMaps": [],"valueName": "current"},{"cacheTimeout": null,"colorBackground": false,"colorPostfix": false,"colorPrefix": false,"colorValue": true,"colors": ["rgba(50, 172, 45, 0.97)","rgba(237, 129, 40, 0.89)","rgba(245, 54, 54, 0.9)"],"datasource": "Prometheus","decimals": 2,"description": "","format": "short","gauge": {"maxValue": 10000,"minValue": null,"show": true,"thresholdLabels": false,"thresholdMarkers": true},"gridPos": {"h": 5,"w": 3,"x": 13,"y": 1},"hideTimeOverride": false,"id": 16,"interval": null,"links": [],"mappingType": 1,"mappingTypes": [{"name": "value to text","value": 1},{"name": "range to text","value": 2}],"maxDataPoints": 100,"minSpan": 4,"nullPointMode": "null","nullText": null,"postfix": "","postfixFontSize": "50%","prefix": "","prefixFontSize": "50%","rangeMaps": [{"from": "null","text": "N/A","to": "null"}],"sparkline": {"fillColor": "rgba(31, 118, 189, 0.18)","full": false,"lineColor": "rgb(31, 120, 193)","show": true},"tableColumn": "","targets": [{"expr": "node_filefd_allocated{instance=~\"$instance\",job=\"$job\"}","format": "time_series","instant": false,"interval": "10s","intervalFactor": 1,"refId": "B"}],"thresholds": "7000,9000","title": "當前打開的文件描述符","transparent": true,"type": "singlestat","valueFontSize": "70%","valueMaps": [],"valueName": "current"},{"cacheTimeout": null,"colorBackground": false,"colorValue": true,"colors": ["rgba(50, 172, 45, 0.97)","rgba(237, 129, 40, 0.89)","rgba(245, 54, 54, 0.9)"],"datasource": "Prometheus","decimals": null,"description": "","format": "percent","gauge": {"maxValue": 100,"minValue": 0,"show": true,"thresholdLabels": false,"thresholdMarkers": true},"gridPos": {"h": 5,"w": 4,"x": 16,"y": 1},"id": 166,"interval": null,"links": [],"mappingType": 1,"mappingTypes": [{"name": "value to text","value": 1},{"name": "range to text","value": 2}],"maxDataPoints": 100,"minSpan": 4,"nullPointMode": "null","nullText": null,"postfix": "","postfixFontSize": "50%","prefix": "","prefixFontSize": "50%","rangeMaps": [{"from": "null","text": "N/A","to": "null"}],"repeatDirection": "h","sparkline": {"fillColor": "rgba(31, 118, 189, 0.18)","full": false,"lineColor": "rgb(31, 120, 193)","show": true},"tableColumn": "","targets": [{"expr": "100 - ((node_filesystem_avail_bytes{instance=~\"$instance\",mountpoint=\"/\",fstype=~\"ext4|xfs\",job=\"$job\"} * 100) / node_filesystem_size_bytes {instance=~\"$instance\",mountpoint=\"/\",fstype=~\"ext4|xfs\",job=\"$job\"})","format": "time_series","interval": "10s","intervalFactor": 1,"refId": "A","step": 20}],"thresholds": "70,90","title": "根分區使用率","transparent": true,"type": "singlestat","valueFontSize": "80%","valueMaps": [{"op": "=","text": "N/A","value": "null"}],"valueName": "current"},{"cacheTimeout": null,"colorBackground": false,"colorValue": true,"colors": ["rgba(50, 172, 45, 0.97)","rgba(237, 129, 40, 0.89)","rgba(245, 54, 54, 0.9)"],"datasource": "Prometheus","decimals": null,"description": "通過變量maxmount獲取最大的分區。","format": "percent","gauge": {"maxValue": 100,"minValue": 0,"show": true,"thresholdLabels": false,"thresholdMarkers": true},"gridPos": {"h": 5,"w": 4,"x": 20,"y": 1},"id": 154,"interval": null,"links": [],"mappingType": 1,"mappingTypes": [{"name": "value to text","value": 1},{"name": "range to text","value": 2}],"maxDataPoints": 100,"minSpan": 4,"nullPointMode": "null","nullText": null,"postfix": "","postfixFontSize": "50%","prefix": "","prefixFontSize": "50%","rangeMaps": [{"from": "null","text": "N/A","to": "null"}],"repeat": null,"repeatDirection": "h","sparkline": {"fillColor": "rgba(31, 118, 189, 0.18)","full": false,"lineColor": "rgb(31, 120, 193)","show": true},"tableColumn": "","targets": [{"expr": "100 - ((node_filesystem_avail_bytes{instance=~\"$instance\",mountpoint=\"$maxmount\",fstype=~\"ext4|xfs\",job=\"$job\"} * 100) / node_filesystem_size_bytes {instance=~\"$instance\",mountpoint=\"$maxmount\",fstype=~\"ext4|xfs\",job=\"$job\"})","format": "time_series","interval": "10s","intervalFactor": 1,"refId": "A","step": 20}],"thresholds": "70,90","title": "最大分區($maxmount)使用率","transparent": true,"type": "singlestat","valueFontSize": "80%","valueMaps": [{"op": "=","text": "N/A","value": "null"}],"valueName": "current"},{"cacheTimeout": null,"colorBackground": false,"colorValue": true,"colors": ["rgba(245, 54, 54, 0.9)","rgba(237, 129, 40, 0.89)","rgba(50, 172, 45, 0.97)"],"datasource": "Prometheus","decimals": null,"description": "","format": "bytes","gauge": {"maxValue": 100,"minValue": 0,"show": false,"thresholdLabels": false,"thresholdMarkers": true},"gridPos": {"h": 3,"w": 2,"x": 2,"y": 3},"id": 75,"interval": null,"links": [],"mappingType": 1,"mappingTypes": [{"name": "value to text","value": 1},{"name": "range to text","value": 2}],"maxDataPoints": 100,"minSpan": 4,"nullPointMode": "null","nullText": null,"postfix": "","postfixFontSize": "70%","prefix": "","prefixFontSize": "50%","rangeMaps": [{"from": "null","text": "N/A","to": "null"}],"sparkline": {"fillColor": "rgba(31, 118, 189, 0.18)","full": false,"lineColor": "rgb(31, 120, 193)","show": false},"tableColumn": "","targets": [{"expr": "node_memory_MemTotal_bytes{instance=~\"$instance\",job=\"$job\"}","format": "time_series","instant": true,"intervalFactor": 1,"legendFormat": "{{instance}}","refId": "A","step": 20}],"thresholds": "2,3","title": "內存總量","transparent": true,"type": "singlestat","valueFontSize": "80%","valueMaps": [{"op": "=","text": "N/A","value": "null"}],"valueName": "current"},{"gridPos": {"h": 1,"w": 24,"x": 0,"y": 6},"id": 178,"title": "Memory && CPU","type": "row"},{"aliasColors": {"內存_Avaliable": "#6ED0E0","內存_Cached": "#EF843C","內存_Free": "#629E51","內存_Total": "#6d1f62","內存_Used": "#eab839","可用": "#9ac48a","總內存": "#bf1b00"},"bars": false,"dashLength": 10,"dashes": false,"datasource": "Prometheus","decimals": 2,"fill": 1,"gridPos": {"h": 7,"w": 6,"x": 0,"y": 7},"height": "300","id": 156,"legend": {"alignAsTable": false,"avg": false,"current": false,"max": false,"min": false,"rightSide": false,"show": true,"sort": "current","sortDesc": true,"total": false,"values": false},"lines": true,"linewidth": 1,"links": [],"nullPointMode": "null","percentage": false,"pointradius": 5,"points": false,"renderer": "flot","seriesOverrides": [],"spaceLength": 10,"stack": false,"steppedLine": false,"targets": [{"expr": "node_memory_MemTotal_bytes{instance=~\"$instance\",job=\"$job\"}","format": "time_series","hide": false,"instant": false,"intervalFactor": 2,"legendFormat": "總內存","refId": "A","step": 4},{"expr": "node_memory_MemTotal_bytes{instance=~\"$instance\",job=\"$job\"} - node_memory_MemAvailable_bytes{instance=~\"$instance\",job=\"$job\"}","format": "time_series","hide": false,"instant": false,"intervalFactor": 2,"legendFormat": "已用內存","refId": "B","step": 4}],"thresholds": [],"timeFrom": null,"timeRegions": [],"timeShift": null,"title": "內存信息","tooltip": {"shared": true,"sort": 1,"value_type": "individual"},"transparent": true,"type": "graph","xaxis": {"buckets": null,"mode": "time","name": null,"show": true,"values": []},"yaxes": [{"format": "bytes","label": null,"logBase": 1,"max": null,"min": "0","show": true},{"format": "short","label": null,"logBase": 1,"max": null,"min": null,"show": true}],"yaxis": {"align": false,"alignLevel": null}},{"aliasColors": {"15分鐘": "#6ED0E0","1分鐘": "#BF1B00","5分鐘": "#CCA300"},"bars": false,"dashLength": 10,"dashes": false,"datasource": "Prometheus","editable": true,"error": false,"fill": 1,"grid": {},"gridPos": {"h": 7,"w": 6,"x": 6,"y": 7},"height": "300","id": 13,"legend": {"alignAsTable": false,"avg": false,"current": false,"max": false,"min": false,"rightSide": false,"show": true,"total": false,"values": false},"lines": true,"linewidth": 2,"links": [],"minSpan": 4,"nullPointMode": "null as zero","percentage": false,"pointradius": 5,"points": false,"renderer": "flot","repeat": null,"seriesOverrides": [],"spaceLength": 10,"stack": false,"steppedLine": false,"targets": [{"expr": "node_load1{instance=~\"$instance\",job=\"$job\"}","format": "time_series","instant": false,"interval": "10s","intervalFactor": 2,"legendFormat": "load_1m","metric": "","refId": "A","step": 20,"target": ""},{"expr": "node_load5{instance=~\"$instance\",job=\"$job\"}","format": "time_series","instant": false,"interval": "10s","intervalFactor": 2,"legendFormat": "load_5m","refId": "B","step": 20},{"expr": "node_load15{instance=~\"$instance\",job=\"$job\"}","format": "time_series","instant": false,"interval": "10s","intervalFactor": 2,"legendFormat": "load_15m","refId": "C","step": 20}],"thresholds": [],"timeFrom": null,"timeRegions": [],"timeShift": null,"title": "系統平均負載","tooltip": {"msResolution": false,"shared": true,"sort": 0,"value_type": "cumulative"},"transparent": true,"type": "graph","xaxis": {"buckets": null,"mode": "time","name": null,"show": true,"values": []},"yaxes": [{"format": "short","logBase": 1,"max": null,"min": null,"show": true},{"format": "short","logBase": 1,"max": null,"min": null,"show": true}],"yaxis": {"align": false,"alignLevel": null}},{"aliasColors": {"Idle - Waiting for something to happen": "#052B51","guest": "#9AC48A","idle": "#052B51","iowait": "#EAB839","irq": "#BF1B00","nice": "#C15C17","sdb_每秒I/O操作%": "#d683ce","softirq": "#E24D42","steal": "#FCE2DE","system": "#508642","user": "#5195CE","磁盤花費在I/O操作占比": "#ba43a9"},"bars": false,"dashLength": 10,"dashes": false,"datasource": "Prometheus","decimals": 2,"description": "","fill": 1,"gridPos": {"h": 7,"w": 6,"x": 12,"y": 7},"id": 7,"legend": {"alignAsTable": false,"avg": false,"current": false,"hideEmpty": true,"hideZero": true,"max": false,"min": false,"rightSide": false,"show": true,"sideWidth": null,"sort": null,"sortDesc": null,"total": false,"values": false},"lines": true,"linewidth": 1,"links": [],"minSpan": 4,"nullPointMode": "null","percentage": false,"pointradius": 5,"points": false,"renderer": "flot","repeat": null,"seriesOverrides": [],"spaceLength": 10,"stack": false,"steppedLine": false,"targets": [{"expr": "(1 - avg by (environment,instance) (irate(node_cpu_seconds_total{instance=~\"$instance\",mode=\"idle\",job=\"$job\"}[1m])))","format": "time_series","hide": false,"instant": false,"interval": "","intervalFactor": 2,"legendFormat": "CPU_Total","refId": "A","step": 20},{"expr": "avg(irate(node_cpu_seconds_total{instance=~\"$instance\",mode=\"user\",job=\"$job\"}[1m])) by (instance)","format": "time_series","hide": false,"intervalFactor": 2,"legendFormat": "CPU_User","refId": "B","step": 240},{"expr": "avg(irate(node_cpu_seconds_total{instance=~\"$instance\",mode=\"iowait\",job=\"$job\"}[1m])) by (instance)","format": "time_series","hide": false,"intervalFactor": 2,"legendFormat": "CPU_Iowait","refId": "D","step": 240}],"thresholds": [],"timeFrom": null,"timeRegions": [],"timeShift": null,"title": "CPU使用率","tooltip": {"shared": true,"sort": 0,"value_type": "individual"},"transparent": true,"type": "graph","xaxis": {"buckets": null,"mode": "time","name": null,"show": true,"values": []},"yaxes": [{"decimals": null,"format": "percentunit","label": "","logBase": 1,"max": "1","min": null,"show": true},{"format": "short","label": null,"logBase": 1,"max": null,"min": null,"show": false}],"yaxis": {"align": false,"alignLevel": null}},{"aliasColors": {},"breakPoint": "25%","cacheTimeout": null,"combine": {"label": "Others","threshold": 0},"datasource": "Prometheus","decimals": null,"fontSize": "80%","format": "short","gridPos": {"h": 7,"w": 6,"x": 18,"y": 7},"id": 182,"interval": null,"legend": {"header": "","percentage": false,"show": true,"sideWidth": null,"values": false},"legendType": "On graph","links": [],"maxDataPoints": 3,"nullPointMode": "connected","pieType": "pie","strokeWidth": 1,"targets": [{"application": {"filter": ""},"expr": "sum by (instance,cpu) ( node_cpu_seconds_total{instance=~\"$instance\" , mode!=\"idle\"})","format": "time_series","functions": [],"group": {"filter": ""},"host": {"filter": ""},"instant": true,"intervalFactor": 1,"item": {"filter": ""},"legendFormat": "cpu-{{cpu}}","mode": 0,"options": {"showDisabledItems": false,"skipEmptyValues": false},"refId": "A","resultFormat": "time_series","table": {"skipEmptyValues": false},"triggers": {"acknowledged": 2,"count": true,"minSeverity": 3}}],"title": "本機多顆CPU使用占比","transparent": true,"type": "grafana-piechart-panel","valueName": "avg"},{"collapsed": false,"gridPos": {"h": 1,"w": 24,"x": 0,"y": 14},"id": 176,"panels": [],"repeat": null,"title": "Disk","type": "row"},{"aliasColors": {"vda_write": "#6ED0E0"},"bars": true,"dashLength": 10,"dashes": false,"datasource": "Prometheus","description": "Reads completed: 每個磁盤分區每秒讀完成次數\n\nWrites completed: 每個磁盤分區每秒寫完成次數\n\nIO now 每個磁盤分區每秒正在處理的輸入/輸出請求數","fill": 2,"gridPos": {"h": 8,"w": 6,"x": 0,"y": 15},"height": "300","id": 161,"legend": {"alignAsTable": true,"avg": false,"current": true,"hideEmpty": true,"hideZero": true,"max": true,"min": false,"show": true,"sort": "current","sortDesc": true,"total": false,"values": true},"lines": false,"linewidth": 1,"links": [],"nullPointMode": "null","percentage": false,"pointradius": 5,"points": false,"renderer": "flot","seriesOverrides": [{"alias": "/.*_讀取$/","transform": "negative-Y"}],"spaceLength": 10,"stack": false,"steppedLine": false,"targets": [{"expr": "irate(node_disk_reads_completed_total{instance=~\"$instance\",job=\"$job\"}[1m])","format": "time_series","hide": false,"interval": "","intervalFactor": 2,"legendFormat": "{{device}}_讀取","refId": "A","step": 10},{"expr": "irate(node_disk_writes_completed_total{instance=~\"$instance\",job=\"$job\"}[1m])","format": "time_series","hide": false,"intervalFactor": 2,"legendFormat": "{{device}}_寫入","refId": "B","step": 10}],"thresholds": [],"timeFrom": null,"timeRegions": [],"timeShift": null,"title": "磁盤讀寫速率(IOPS)","tooltip": {"shared": true,"sort": 0,"value_type": "individual"},"type": "graph","xaxis": {"buckets": null,"mode": "time","name": null,"show": true,"values": []},"yaxes": [{"decimals": null,"format": "iops","label": "讀取(-)/寫入(+)I/O ops/sec","logBase": 1,"max": null,"min": null,"show": true},{"format": "short","label": null,"logBase": 1,"max": null,"min": null,"show": true}],"yaxis": {"align": false,"alignLevel": null}},{"aliasColors": {"vda_write": "#6ED0E0"},"bars": true,"dashLength": 10,"dashes": false,"datasource": "Prometheus","description": "Read bytes 每個磁盤分區每秒讀取的比特數\nWritten bytes 每個磁盤分區每秒寫入的比特數","fill": 2,"gridPos": {"h": 8,"w": 6,"x": 6,"y": 15},"height": "300","id": 168,"legend": {"alignAsTable": true,"avg": false,"current": true,"hideEmpty": true,"hideZero": true,"max": true,"min": false,"show": true,"total": false,"values": true},"lines": false,"linewidth": 1,"links": [],"nullPointMode": "null","percentage": false,"pointradius": 5,"points": false,"renderer": "flot","seriesOverrides": [{"alias": "/.*_讀取$/","transform": "negative-Y"}],"spaceLength": 10,"stack": false,"steppedLine": false,"targets": [{"expr": "irate(node_disk_read_bytes_total{instance=~\"$instance\",job=\"$job\"}[1m])","format": "time_series","interval": "","intervalFactor": 2,"legendFormat": "{{device}}_讀取","refId": "A","step": 10},{"expr": "irate(node_disk_written_bytes_total{instance=~\"$instance\",job=\"$job\"}[1m])","format": "time_series","hide": false,"intervalFactor": 2,"legendFormat": "{{device}}_寫入","refId": "B","step": 10}],"thresholds": [],"timeFrom": null,"timeRegions": [],"timeShift": null,"title": "磁盤讀寫容量大小","tooltip": {"shared": true,"sort": 0,"value_type": "individual"},"type": "graph","xaxis": {"buckets": null,"mode": "time","name": null,"show": true,"values": []},"yaxes": [{"decimals": null,"format": "Bps","label": "讀取(-)/寫入(+)","logBase": 1,"max": null,"min": null,"show": true},{"format": "short","label": null,"logBase": 1,"max": null,"min": null,"show": false}],"yaxis": {"align": false,"alignLevel": null}},{"aliasColors": {"vda": "#6ED0E0"},"bars": false,"dashLength": 10,"dashes": false,"datasource": "Prometheus","description": "Read time ms 每個磁盤分區讀操作花費的秒數\n\nWrite time ms 每個磁盤分區寫操作花費的秒數\n\nIO time ms 每個磁盤分區輸入/輸出操作花費的秒數\n\nIO time weighted 每個磁盤分區輸入/輸出操作花費的加權秒數","fill": 3,"gridPos": {"h": 8,"w": 6,"x": 12,"y": 15},"height": "300","id": 160,"legend": {"alignAsTable": true,"avg": false,"current": true,"hideEmpty": true,"hideZero": true,"max": true,"min": false,"show": true,"total": false,"values": true},"lines": true,"linewidth": 1,"links": [],"nullPointMode": "null","percentage": false,"pointradius": 5,"points": false,"renderer": "flot","seriesOverrides": [{"alias": "/,*_讀取$/","transform": "negative-Y"}],"spaceLength": 10,"stack": false,"steppedLine": false,"targets": [{"expr": "irate(node_disk_io_time_seconds_total{instance=~\"$node\",job=\"$job\"}[1m])","format": "time_series","hide": true,"interval": "","intervalFactor": 2,"legendFormat": "{{device}}","refId": "A","step": 10},{"expr": "irate(node_disk_io_time_weighted_seconds_total{instance=~\"$node\",job=\"$job\"}[1m])","format": "time_series","hide": true,"intervalFactor": 1,"legendFormat": "{{device}}_加權","refId": "D"},{"expr": "irate(node_disk_read_time_seconds_total{instance=~\"$instance\",job=\"$job\"}[1m])","format": "time_series","hide": false,"interval": "","intervalFactor": 1,"legendFormat": "{{device}}_讀取","refId": "B"},{"expr": "irate(node_disk_write_time_seconds_total{instance=~\"$instance\",job=\"$job\"}[1m])","format": "time_series","hide": false,"intervalFactor": 1,"legendFormat": "{{device}}_寫入","refId": "C"}],"thresholds": [],"timeFrom": null,"timeRegions": [],"timeShift": null,"title": "磁盤IO讀寫時間","tooltip": {"shared": true,"sort": 0,"value_type": "individual"},"type": "graph","xaxis": {"buckets": null,"mode": "time","name": null,"show": true,"values": []},"yaxes": [{"format": "s","label": "讀取(-)/寫入(+)","logBase": 1,"max": null,"min": null,"show": true},{"format": "short","label": null,"logBase": 1,"max": null,"min": null,"show": false}],"yaxis": {"align": false,"alignLevel": null}},{"columns": [],"datasource": "Prometheus","fontSize": "120%","gridPos": {"h": 8,"w": 6,"x": 18,"y": 15},"id": 164,"links": [],"pageSize": null,"scroll": true,"showHeader": true,"sort": {"col": 4,"desc": false},"styles": [{"alias": "Time","dateFormat": "YYYY-MM-DD HH:mm:ss","pattern": "Time","type": "hidden"},{"alias": "分區","colorMode": null,"colors": ["rgba(50, 172, 45, 0.97)","rgba(237, 129, 40, 0.89)","rgba(245, 54, 54, 0.9)"],"dateFormat": "YYYY-MM-DD HH:mm:ss","decimals": 2,"mappingType": 1,"pattern": "mountpoint","thresholds": [""],"type": "string","unit": "bytes"},{"alias": "可用空間","colorMode": "value","colors": ["rgba(245, 54, 54, 0.9)","rgba(237, 129, 40, 0.89)","rgba(50, 172, 45, 0.97)"],"dateFormat": "YYYY-MM-DD HH:mm:ss","decimals": 2,"mappingType": 1,"pattern": "Value #A","thresholds": ["10000000000","20000000000"],"type": "number","unit": "bytes"},{"alias": "使用率","colorMode": "cell","colors": ["rgba(50, 172, 45, 0.97)","rgba(237, 129, 40, 0.89)","rgba(245, 54, 54, 0.9)"],"dateFormat": "YYYY-MM-DD HH:mm:ss","decimals": 2,"mappingType": 1,"pattern": "Value #B","thresholds": ["70","90"],"type": "number","unit": "percentunit"},{"alias": "磁盤日增長率","colorMode": "cell","colors": ["#0a50a1","#7eb26d","rgba(245, 54, 54, 0.9)"],"dateFormat": "YYYY-MM-DD HH:mm:ss","decimals": 1,"link": false,"mappingType": 1,"pattern": "Value #C","thresholds": ["0","10"],"type": "number","unit": "percentunit"},{"alias": "文件系統","colorMode": null,"colors": ["rgba(245, 54, 54, 0.9)","rgba(237, 129, 40, 0.89)","rgba(50, 172, 45, 0.97)"],"dateFormat": "YYYY-MM-DD HH:mm:ss","decimals": 2,"link": false,"mappingType": 1,"pattern": "fstype","thresholds": [],"type": "hidden","unit": "short"},{"alias": "IP","colorMode": null,"colors": ["rgba(245, 54, 54, 0.9)","rgba(237, 129, 40, 0.89)","rgba(50, 172, 45, 0.97)"],"dateFormat": "YYYY-MM-DD HH:mm:ss","decimals": 2,"link": false,"mappingType": 1,"pattern": "instance","thresholds": [],"type": "hidden","unit": "short"},{"alias": "","colorMode": null,"colors": ["rgba(245, 54, 54, 0.9)","rgba(237, 129, 40, 0.89)","rgba(50, 172, 45, 0.97)"],"decimals": 2,"pattern": "/.*/","preserveFormat": true,"sanitize": false,"thresholds": [],"type": "hidden","unit": "short"}],"targets": [{"expr": "node_filesystem_avail_bytes {instance=~'$instance',fstype=~\"ext4|xfs\"}","format": "table","hide": false,"instant": true,"interval": "10s","intervalFactor": 1,"legendFormat": "","refId": "A"},{"expr": "1-(node_filesystem_free_bytes{instance=~'$instance',fstype=~\"ext4|xfs\"} / node_filesystem_size_bytes{instance=~'$instance',fstype=~\"ext4|xfs\"})","format": "table","hide": false,"instant": true,"intervalFactor": 1,"legendFormat": "","refId": "B"},{"expr": "((node_filesystem_avail_bytes{instance=~'$instance',fstype=~\"ext4|xfs\"} offset 1d -  node_filesystem_avail_bytes{instance=~'$instance',fstype=~\"ext4|xfs\"}  )  / node_filesystem_size_bytes{instance=~'$instance',fstype=~\"ext4|xfs\"} * 100 ) ","format": "table","hide": false,"instant": true,"intervalFactor": 1,"legendFormat": "","refId": "C"}],"title": "各分區可用空間","transform": "table","transparent": true,"type": "table"},{"collapsed": false,"gridPos": {"h": 1,"w": 24,"x": 0,"y": 23},"id": 184,"panels": [],"title": "Network","type": "row"},{"aliasColors": {},"bars": false,"dashLength": 10,"dashes": false,"datasource": "Prometheus","fill": 1,"gridPos": {"h": 8,"w": 6,"x": 0,"y": 24},"height": "300","id": 157,"legend": {"alignAsTable": true,"avg": false,"current": true,"hideEmpty": true,"hideZero": true,"max": false,"min": false,"rightSide": false,"show": true,"sort": "current","sortDesc": true,"total": false,"values": true},"lines": true,"linewidth": 2,"links": [],"nullPointMode": "null","percentage": false,"pointradius": 5,"points": false,"renderer": "flot","seriesOverrides": [{"alias": "/.*_out上傳$/","transform": "negative-Y"}],"spaceLength": 10,"stack": false,"steppedLine": false,"targets": [{"expr": "irate(node_network_receive_bytes_total{instance=~'$instance',device!~'tap.*|veth.*|br.*|docker.*|virbr*|lo*',job=\"$job\"}[5m])*8","format": "time_series","intervalFactor": 2,"legendFormat": "{{device}}_in下載","refId": "A","step": 4},{"expr": "irate(node_network_transmit_bytes_total{instance=~'$instance',device!~'tap.*|veth.*|br.*|docker.*|virbr*|lo*',job=\"$job\"}[5m])*8","format": "time_series","intervalFactor": 2,"legendFormat": "{{device}}_out上傳","refId": "B","step": 4}],"thresholds": [],"timeFrom": null,"timeRegions": [],"timeShift": null,"title": "網絡流量","tooltip": {"shared": true,"sort": 0,"value_type": "individual"},"type": "graph","xaxis": {"buckets": null,"mode": "time","name": null,"show": true,"values": []},"yaxes": [{"format": "bps","label": "上傳(-)/下載(+)","logBase": 1,"max": null,"min": null,"show": true},{"format": "short","label": null,"logBase": 1,"max": null,"min": null,"show": false}],"yaxis": {"align": false,"alignLevel": null}},{"aliasColors": {},"bars": false,"dashLength": 10,"dashes": false,"datasource": "Prometheus","fill": 1,"gridPos": {"h": 8,"w": 6,"x": 6,"y": 24},"height": "300","id": 185,"legend": {"alignAsTable": true,"avg": false,"current": true,"hideEmpty": true,"hideZero": true,"max": false,"min": false,"rightSide": false,"show": true,"sort": "current","sortDesc": true,"total": false,"values": true},"lines": true,"linewidth": 2,"links": [],"nullPointMode": "null","percentage": false,"pointradius": 5,"points": false,"renderer": "flot","seriesOverrides": [{"alias": "/.*_out上傳$/","transform": "negative-Y"}],"spaceLength": 10,"stack": false,"steppedLine": false,"targets": [{"expr": "irate(node_network_receive_packets_total{instance=~'$instance',device!~'tap.*|veth.*|br.*|docker.*|virbr*|lo*',job=\"$job\"}[5m])","format": "time_series","intervalFactor": 2,"legendFormat": "{{device}}_接收包","refId": "A","step": 4},{"expr": "irate(node_network_transmit_packets_total{instance=~'$instance',device!~'tap.*|veth.*|br.*|docker.*|virbr*|lo*',job=\"$job\"}[5m])","format": "time_series","intervalFactor": 2,"legendFormat": "{{device}}_發送包","refId": "B","step": 4}],"thresholds": [],"timeFrom": null,"timeRegions": [],"timeShift": null,"title": "網絡包","tooltip": {"shared": true,"sort": 0,"value_type": "individual"},"transparent": true,"type": "graph","xaxis": {"buckets": null,"mode": "time","name": null,"show": true,"values": []},"yaxes": [{"format": "short","label": "上傳(-)/下載(+)","logBase": 1,"max": null,"min": null,"show": true},{"format": "short","label": null,"logBase": 1,"max": null,"min": null,"show": false}],"yaxis": {"align": false,"alignLevel": null}},{"aliasColors": {"TCP": "#6ED0E0"},"bars": false,"dashLength": 10,"dashes": false,"datasource": "Prometheus","description": "CurrEstab - 當前狀態為 ESTABLISHED 或 CLOSE-WAIT 的 TCP 連接數\n\nActiveOpens - 已從 CLOSED 狀態直接轉換到 SYN-SENT 狀態的 TCP 平均連接數(1分鐘內)\n\nPassiveOpens - 已從 LISTEN 狀態直接轉換到 SYN-RCVD 狀態的 TCP 平均連接數(1分鐘內)\n\nTCP_alloc - 已分配(已建立、已申請到sk_buff)的TCP套接字數量\n\nTCP_inuse - 正在使用(正在偵聽)的TCP套接字數量\n\nTCP_tw - 等待關閉的TCP連接數","fill": 0,"gridPos": {"h": 8,"w": 12,"x": 12,"y": 24},"height": "300","id": 158,"legend": {"alignAsTable": true,"avg": false,"current": true,"max": false,"min": false,"rightSide": true,"show": true,"total": false,"values": true},"lines": true,"linewidth": 1,"links": [],"nullPointMode": "null","percentage": false,"pointradius": 5,"points": false,"renderer": "flot","seriesOverrides": [],"spaceLength": 10,"stack": false,"steppedLine": false,"targets": [{"expr": "node_netstat_Tcp_CurrEstab{instance=~'$instance',job=\"$job\"}","format": "time_series","hide": false,"interval": "10s","intervalFactor": 1,"legendFormat": "ESTABLISHED","refId": "A","step": 20},{"expr": "node_sockstat_TCP_tw{instance=~'$instance',job=\"$job\"}","format": "time_series","intervalFactor": 1,"legendFormat": "TCP_tw","refId": "D"},{"expr": "irate(node_netstat_Tcp_ActiveOpens{instance=~'$instance',job=\"$job\"}[1m])","format": "time_series","hide": false,"intervalFactor": 1,"legendFormat": "ActiveOpens","refId": "B"},{"expr": "irate(node_netstat_Tcp_PassiveOpens{instance=~'$instance',job=\"$job\"}[1m])","format": "time_series","intervalFactor": 1,"legendFormat": "PassiveOpens","refId": "C"},{"expr": "node_sockstat_TCP_alloc{instance=~'$instance',job=\"$job\"}","format": "time_series","intervalFactor": 1,"legendFormat": "TCP_alloc","refId": "E"},{"expr": "node_sockstat_TCP_inuse{instance=~'$instance',job=\"$job\"}","format": "time_series","intervalFactor": 1,"legendFormat": "TCP_inuse","refId": "F"},{"expr": "node_tcp_connection_states{instance=~\"$instance\",job=\"$job\"}","format": "time_series","intervalFactor": 1,"legendFormat": "{{state}}","refId": "G"}],"thresholds": [],"timeFrom": null,"timeRegions": [],"timeShift": null,"title": "TCP 連接情況","tooltip": {"shared": true,"sort": 0,"value_type": "individual"},"transparent": false,"type": "graph","xaxis": {"buckets": null,"mode": "time","name": null,"show": true,"values": []},"yaxes": [{"format": "short","label": null,"logBase": 1,"max": null,"min": null,"show": true},{"format": "short","label": null,"logBase": 1,"max": null,"min": null,"show": true}],"yaxis": {"align": false,"alignLevel": null}}],"refresh": false,"schemaVersion": 16,"style": "dark","tags": ["Prometheus","node_exporter","StarsL.cn"],"templating": {"list": [{"auto": true,"auto_count": 10,"auto_min": "10s","current": {"selected": true,"text": "30s","value": "30s"},"hide": 0,"label": "interval","name": "interval","options": [{"selected": false,"text": "auto","value": "$__auto_interval_interval"},{"selected": false,"text": "5s","value": "5s"},{"selected": false,"text": "10s","value": "10s"},{"selected": true,"text": "30s","value": "30s"},{"selected": false,"text": "1m","value": "1m"},{"selected": false,"text": "10m","value": "10m"},{"selected": false,"text": "30m","value": "30m"},{"selected": false,"text": "1h","value": "1h"},{"selected": false,"text": "6h","value": "6h"},{"selected": false,"text": "12h","value": "12h"},{"selected": false,"text": "1d","value": "1d"}],"query": "5s,10s,30s,1m,10m,30m,1h,6h,12h,1d","refresh": 2,"skipUrlSync": false,"type": "interval"},{"allValue": null,"current": {"text": "node-exporter","value": "node-exporter"},"datasource": "Prometheus","definition": "label_values(node_uname_info, job)","hide": 0,"includeAll": false,"label": null,"multi": false,"name": "job","options": [{"selected": true,"text": "node-exporter","value": "node-exporter"}],"query": "label_values(node_uname_info, job)","refresh": 0,"regex": "","skipUrlSync": false,"sort": 0,"tagValuesQuery": "","tags": [],"tagsQuery": "","type": "query","useTags": false},{"allFormat": "glob","allValue": null,"current": {"tags": [],"text": "172.16.21.197:20001","value": ["172.16.21.197:20001"]},"datasource": "Prometheus","definition": "label_values(node_uname_info,instance)","hide": 0,"includeAll": false,"label": "instance","multi": true,"multiFormat": "regex values","name": "instance","options": [],"query": "label_values(node_uname_info,instance)","refresh": 2,"regex": "","skipUrlSync": false,"sort": 1,"tagValuesQuery": "","tags": [],"tagsQuery": "","type": "query","useTags": false},{"allValue": null,"current": {"text": "/","value": "/"},"datasource": "Prometheus","definition": "query_result(topk(1, sort_desc(max by (mountpoint) (node_filesystem_size_bytes{instance=~\"$instance\",fstype=~\"ext4|xfs\"}))))","hide": 2,"includeAll": false,"label": "","multi": false,"name": "maxmount","options": [],"query": "query_result(topk(1, sort_desc(max by (mountpoint) (node_filesystem_size_bytes{instance=~\"$instance\",fstype=~\"ext4|xfs\"}))))","refresh": 2,"regex": "/.*=\\\"(.*)\\\".*/","skipUrlSync": false,"sort": 0,"tagValuesQuery": "","tags": [],"tagsQuery": "","type": "query","useTags": false},{"datasource": "prometheus_111","filters": [],"hide": 0,"label": "","name": "Filters","skipUrlSync": false,"type": "adhoc"}]},"time": {"from": "now-24h","to": "now"},"timepicker": {"now": true,"refresh_intervals": ["5s","10s","30s","1m","5m","15m","30m","1h","2h","1d"],"time_options": ["5m","15m","1h","6h","12h","24h","2d","7d","30d"]},"timezone": "browser","title": "node-exporter","uid": "node-exporter","version": 49
}
3.2 prometheus界面使用
訪問http://10.23.3.2:9090/
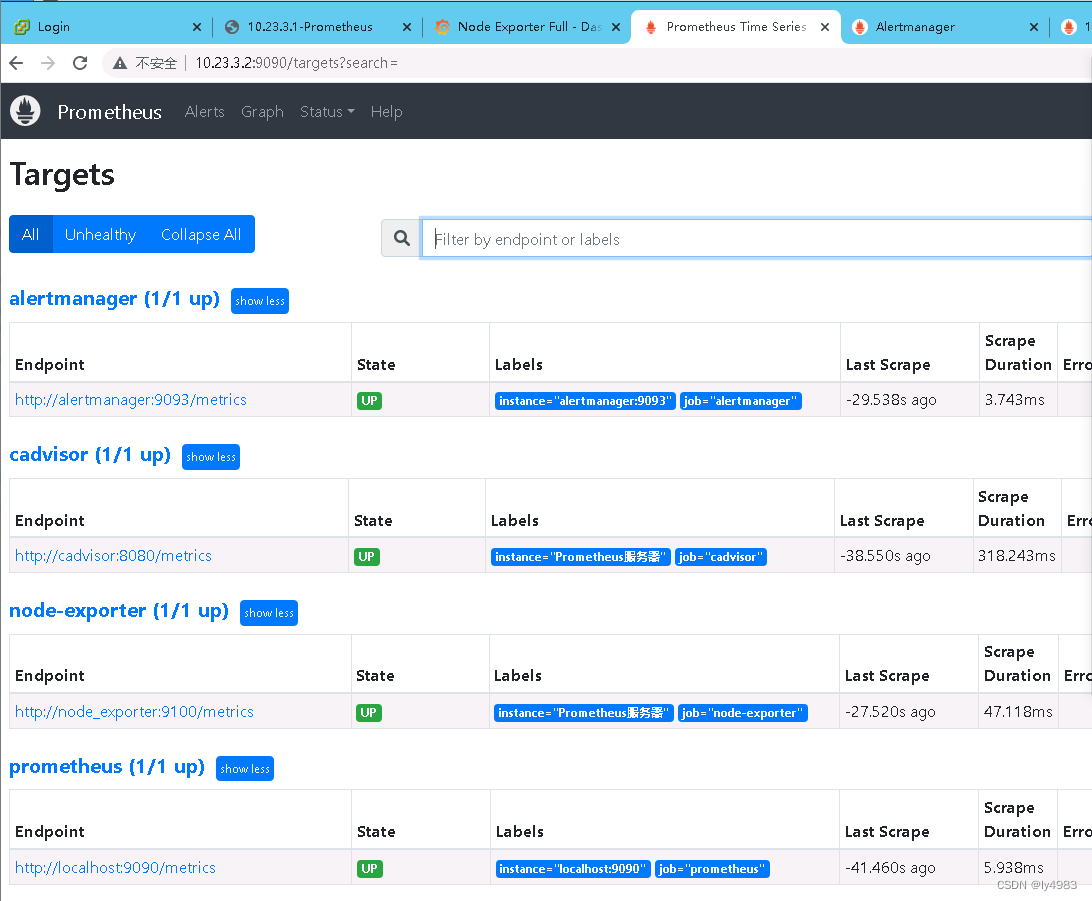
查看監控主機列表
點擊status—targets
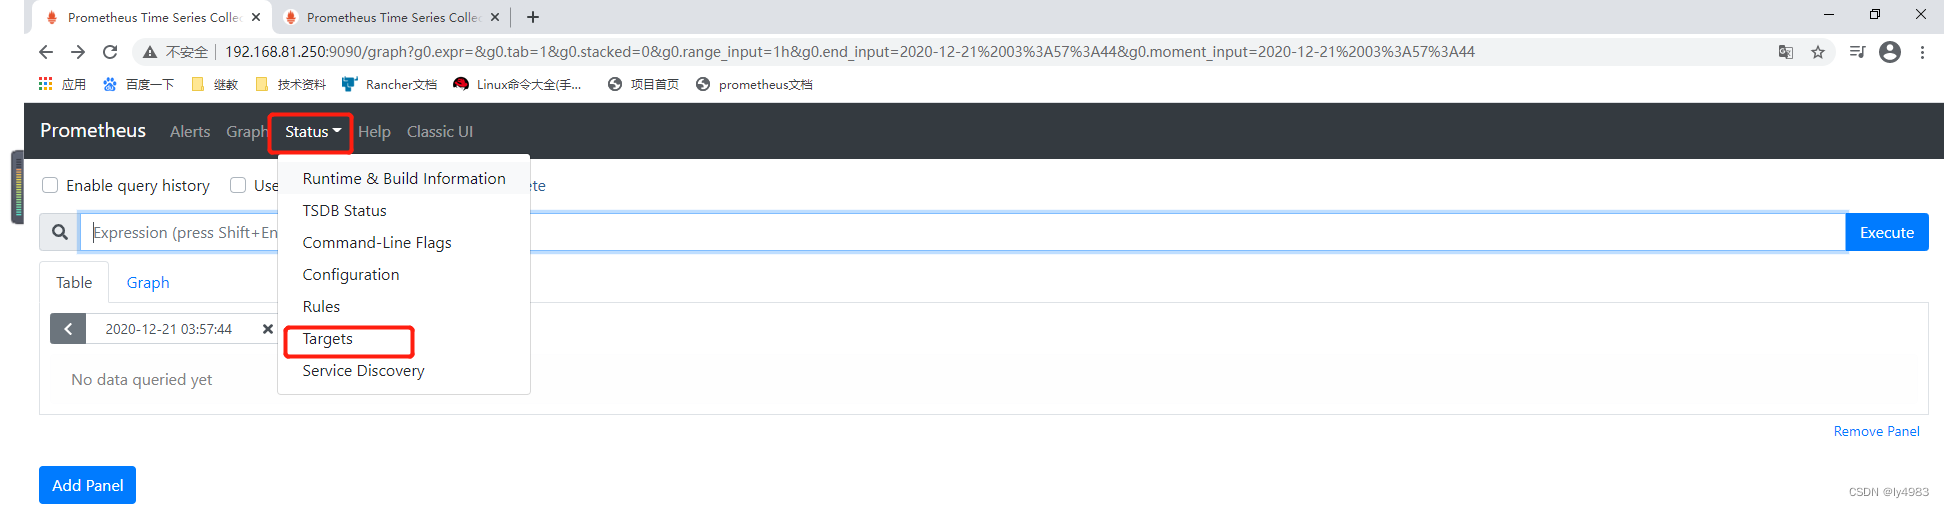
可以看剛安裝好的prometheus只有自己服務器的監控
查看監控指標
點擊圖中的endpoint下面的鏈接即可
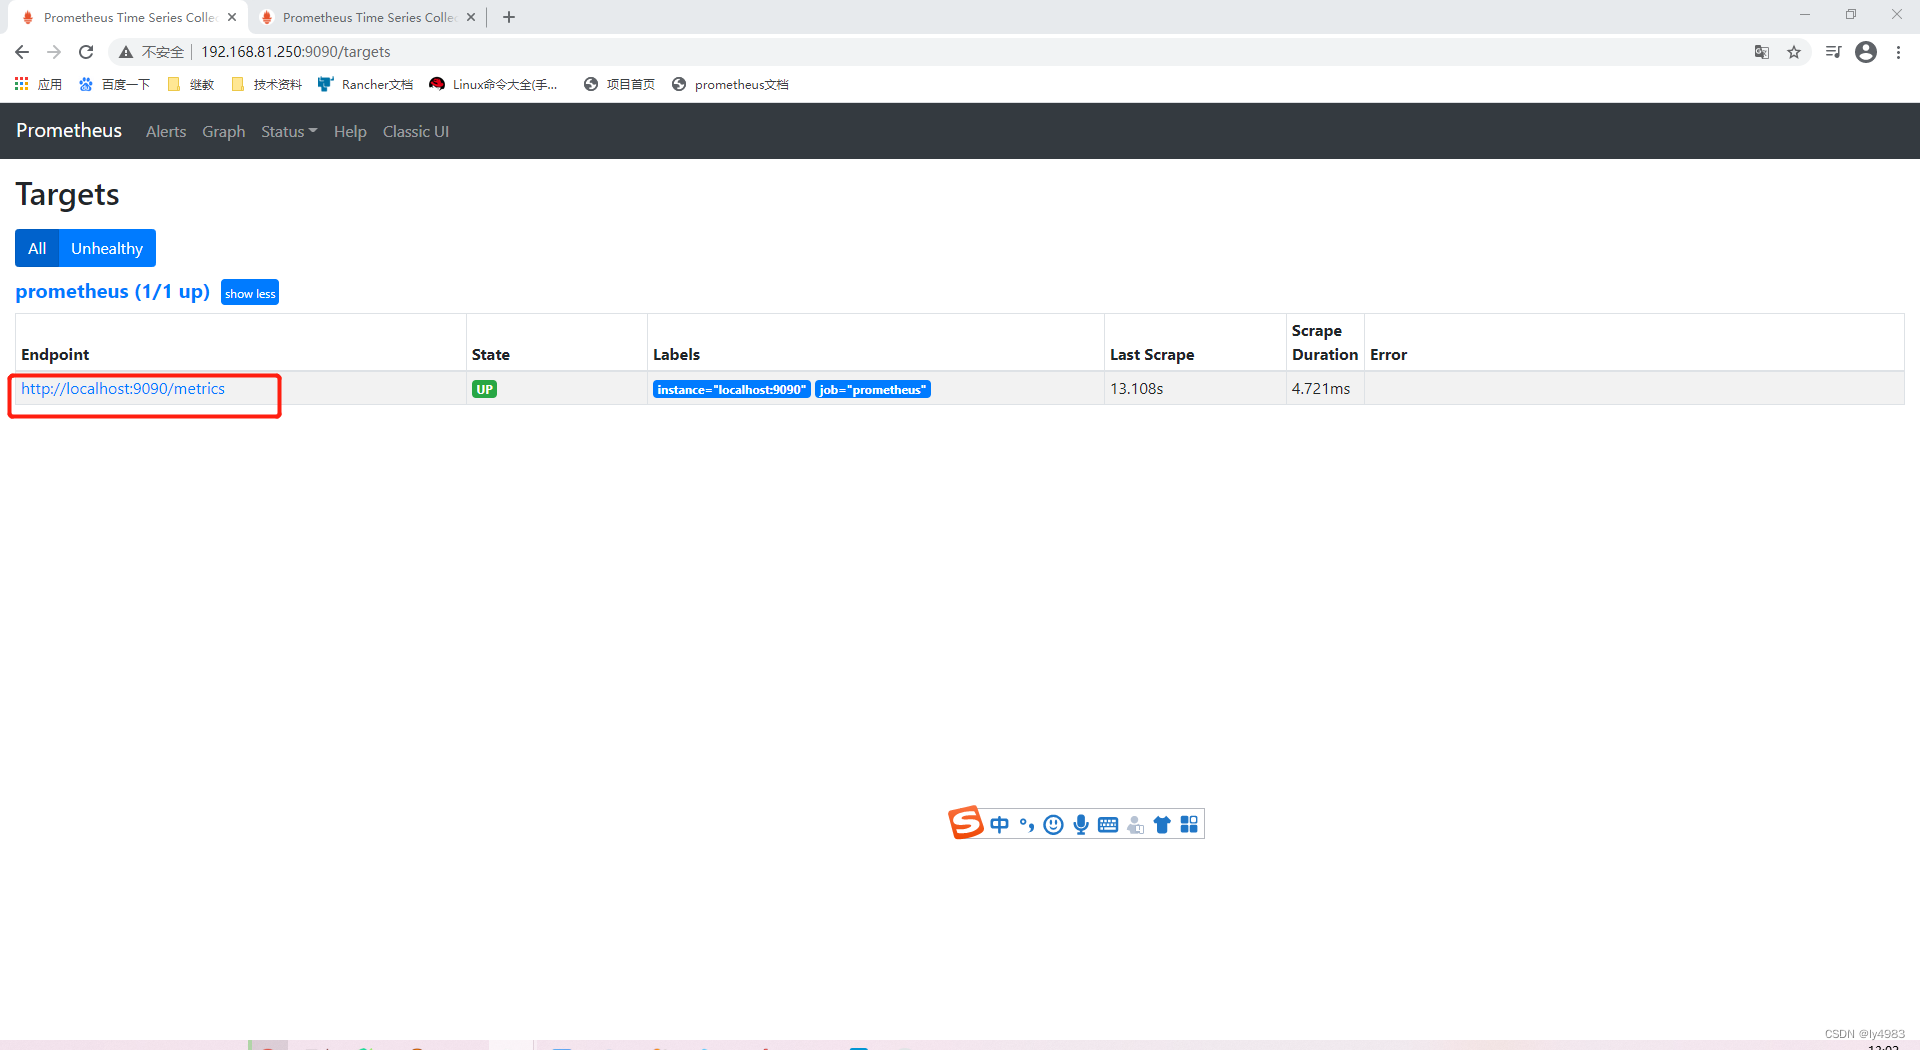
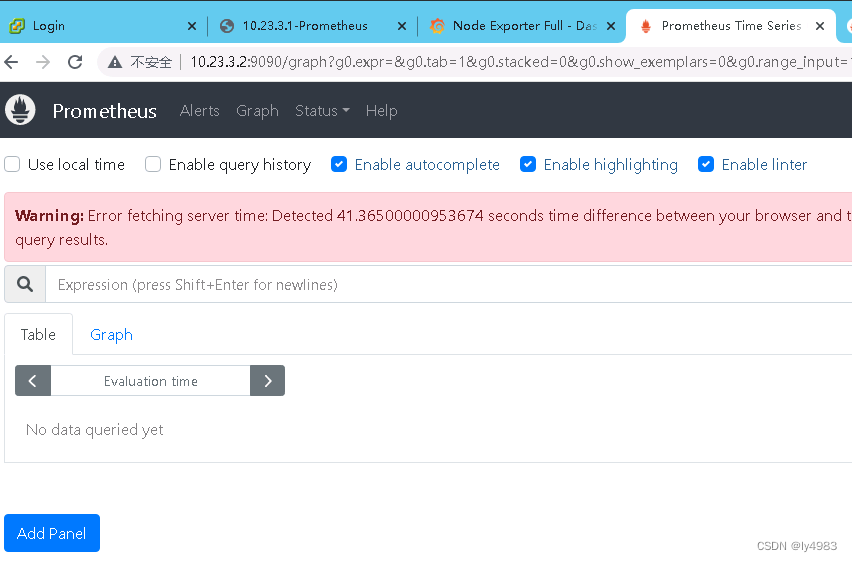
于圖中的鏈接是localhost,我們點開后會報錯的,
因此我們需要填寫正真的prometheus的ip地址才能看到監控指標頁面
http://10.23.3.2:9090/metrics

解決監控指標頁面為localhost問題
/home/prometheus/docker-prometheus/prometheus
1.修改主配置文件prometheus.yml
[root@prometheus-server prometheus]# vim prometheus.yml - job_name: 'prometheus'# metrics_path defaults to '/metrics'# scheme defaults to 'http'.static_configs:- targets: ['192.168.81.250:9090']				#將這里的ip由localhost改為prometheus的真實ip2.重啟prometheus
[root@node1 prometheus]#  docker ps
CONTAINER ID   IMAGE                              COMMAND                  CREATED         STATUS             PORTS                                                  NAMES
932d17a43046   grafana/grafana:9.4.3              "/run.sh"                6 hours ago     Up About an hour   0.0.0.0:3000->3000/tcp, :::3000->3000/tcp              grafana
69256ba5c47e   prom/prometheus:v2.37.6            "/bin/prometheus --c…"   6 hours ago     Up About an hour   0.0.0.0:9090->9090/tcp, :::9090->9090/tcp              prometheus
dbf5c7d39319   google/cadvisor:latest             "/usr/bin/cadvisor -…"   6 hours ago     Up About an hour   8080/tcp                                               cadvisor
e9b1088b5767   prom/alertmanager:v0.25.0          "/bin/alertmanager -…"   6 hours ago     Up About an hour   0.0.0.0:9093->9093/tcp, :::9093->9093/tcp              alertmanager
b41ff00ca41b   prom/node-exporter:v1.5.0          "/bin/node_exporter …"   6 hours ago     Up About an hour   0.0.0.0:9100->9100/tcp, :::9100->9100/tcp              node-exporter
a04f2f382035   zabbix/zabbix-proxy-mysql:latest   "/sbin/tini -- /usr/…"   10 months ago   Up About an hour   0.0.0.0:10051->10051/tcp, :::10051->10051/tcp          zabbix-proxy-mysql
8b7d10763fb5   k2jeans/mysql                      "docker-entrypoint.s…"   10 months ago   Up About an hour   0.0.0.0:3306->3306/tcp, :::3306->3306/tcp, 33060/tcp   mysql-server
[root@node1 prometheus]# docker restart 69256ba5c47e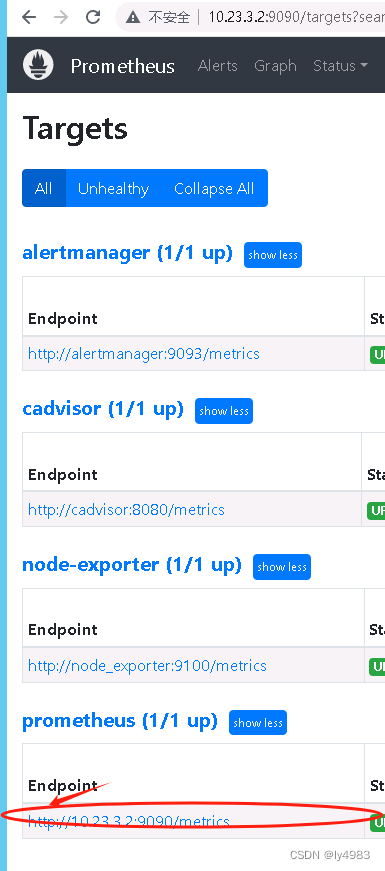
我們看到已經不是localhost或是其他的了,點開即可查看
3.3?安裝node_exporter組件監控Linux主機
在主機10.23.3.1(linux)
wget https://github.com/prometheus/node_exporter/releases/download/v1.0.1/node_exporter-1.0.1.linux-amd64.tar.gz
mkdir /data
tar -xvf node_exporter-1.0.1.linux-amd64.tar.gz -C /data
cd /data
mv node_exporter-1.0.1.linux-amd64 node_exporter
cd node_exporter/
nohup /data/node_exporter/node_exporter &
netstat -anp | grep 9100
安裝好node_exporter后訪問本機9100端口下的metrics目錄即可看到監控數據
http://10.23.3.1:9100/metrics
在prometheus-server上添加監控主機
我們在本機開啟node_exporter后需要在prometheus server上進行配置,最終實現在prometheus頁面看到監控主機的信息
1.配置prometheus
[root@prometheus-server ~]# cd /data/prometheus/
[root@prometheus-server prometheus]# vim prometheus.yml - job_name: "10.23.3.1"static_configs:- targets: ['10.23.3.1:9100']	2.重啟prometheus
[root@prometheus-server prometheus]# ps aux | grep prometheus | awk '{print $2}' | xargs kill -9
[root@prometheus-server prometheus]# ./prometheus --config.file="/data/prometheus/prometheus.yml" &
解釋:
job_name: "linux3.1"#起一個監控主機的名稱,我們這里以ip地址為名targets: ['10.23.3.1:9100'] #監控主機的地址重啟prometheus容器
[root@node1 prometheus]# docker ps
CONTAINER ID IMAGE COMMAND CREATED STATUS PORTS NAMES
932d17a43046 grafana/grafana:9.4.3 "/run.sh" 6 hours ago Up About an hour 0.0.0.0:3000->3000/tcp, :::3000->3000/tcp grafana
69256ba5c47e prom/prometheus:v2.37.6 "/bin/prometheus --c…" 6 hours ago Up About an hour 0.0.0.0:9090->9090/tcp, :::9090->9090/tcp prometheus
dbf5c7d39319 google/cadvisor:latest "/usr/bin/cadvisor -…" 6 hours ago Up About an hour 8080/tcp cadvisor
e9b1088b5767 prom/alertmanager:v0.25.0 "/bin/alertmanager -…" 6 hours ago Up About an hour 0.0.0.0:9093->9093/tcp, :::9093->9093/tcp alertmanager
b41ff00ca41b prom/node-exporter:v1.5.0 "/bin/node_exporter …" 6 hours ago Up About an hour 0.0.0.0:9100->9100/tcp, :::9100->9100/tcp node-exporter
a04f2f382035 zabbix/zabbix-proxy-mysql:latest "/sbin/tini -- /usr/…" 10 months ago Up About an hour 0.0.0.0:10051->10051/tcp, :::10051->10051/tcp zabbix-proxy-mysql
8b7d10763fb5 k2jeans/mysql "docker-entrypoint.s…" 10 months ago Up About an hour 0.0.0.0:3306->3306/tcp, :::3306->3306/tcp, 33060/tcp mysql-server
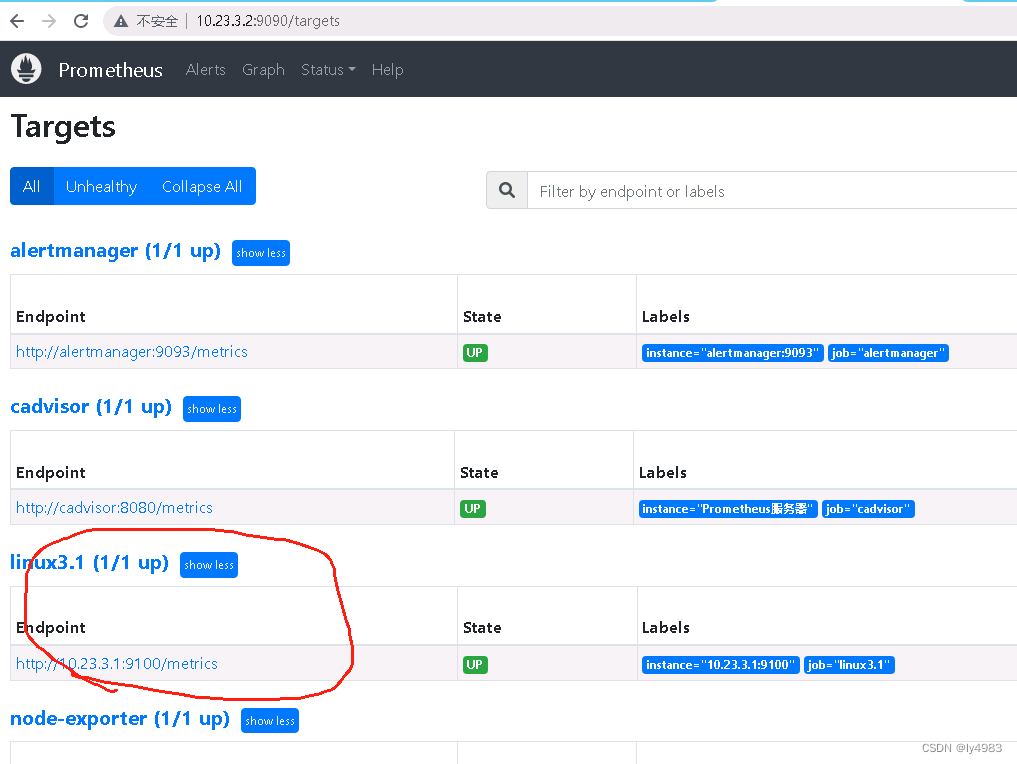
[root@node1 prometheus]# docker restart 69256ba5c47e查看prometheus頁面是否添加主機
點擊status—targets
成功添加
擴展:prometheus添加分組主機
在監控主機安裝node_exporter
我們有10.23.2.3、10.23.3.4兩臺主機,可以將這兩臺主機添加到一個組里面
分別在這兩臺上安裝node_exporter
兩臺都執行以下操作
1.安裝node_exporter
[root@grafana ~]# tar xf node_exporter-1.0.1.linux-amd64.tar.gz -C /data
[root@grafana ~]# cd /data
[root@grafana data]# mv node_exporter-1.0.1.linux-amd64/ node_exporter2.啟動node_exporter
[root@grafana data]# cd node_exporter
[root@grafana node_exporter]# nohup /data/node_exporter/node_exporter &3.查看端口
[root@grafana node_exporter]# netstat -lnpt | grep 9100
配置prometheus
[root@node1 prometheus]# pwd
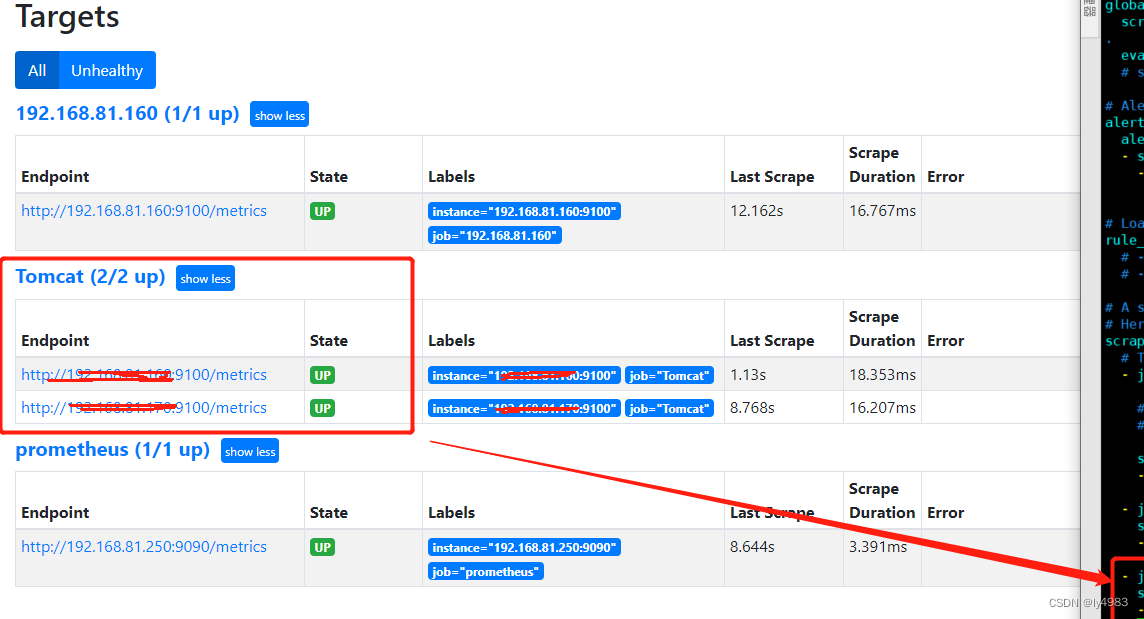
/home/prometheus/docker-prometheus/prometheusvim prometheus.yml?- job_name: "Tomcat"static_configs:- targets: ['10.23.3.3:9100']- targets: ['10.23.3.4:9100']注釋:當job_name下面有多個targets時,則當前job_name不再是一臺主機的名稱,而是下面所有targets的名稱,也就是分組名頁面添加主機分組成功
點擊status—targets


 IPtables 雙網卡 共享上網NAT 安裝配置DHCP)
)


——體系:數據采集——概述、關注焦點)


