02 Prometheus入門安裝教程

大家好,我是秋意零。今天分享一篇入門級Prometheus安裝教程。
環境準備
三臺Linux虛擬機(一臺也可以)
準備Prometheus、相關組件安裝包
Prometheus官網下載安裝包比較慢,如果沒有魔法。可關注公眾號 【秋意零】回復101 獲取
官網下載地址:https://prometheus.io/download/
上傳/解壓包
配置Hosts映射、上傳安裝包并進行解壓
[root@node01 ~]# cat /etc/hosts
127.0.0.1   localhost localhost.localdomain localhost4 localhost4.localdomain4
::1         localhost localhost.localdomain localhost6 localhost6.localdomain6
192.168.200.7 node01
192.168.200.9 node02
192.168.200.10 node03
[root@node01 ~]# tar -vzxf prometheus-2.45.5.linux-amd64.tar.gz  -C /usr/local/
[root@node01 ~]# tar -vzxf pushgateway-1.8.0.linux-amd64.tar.gz -C /usr/local/
[root@node01 ~]# tar -vzxf node_exporter-1.8.0.linux-amd64.tar.gz -C /usr/local/
配置Prometheus
1)進入Prometheus家目錄,配置prometheus.yml文件
[root@node01 prometheus-2.45.5.linux-amd64]# cat prometheus.yml
# my global config
global:scrape_interval: 15s # Set the scrape interval to every 15 seconds. Default is every 1 minute.evaluation_interval: 15s # Evaluate rules every 15 seconds. The default is every 1 minute.# scrape_timeout is set to the global default (10s).# Alertmanager configuration
alerting:alertmanagers:- static_configs:- targets:# - alertmanager:9093# Load rules once and periodically evaluate them according to the global 'evaluation_interval'.
rule_files:# - "first_rules.yml"# - "second_rules.yml"# A scrape configuration containing exactly one endpoint to scrape:
# Here it's Prometheus itself.
scrape_configs:# The job name is added as a label `job=<job_name>` to any timeseries scraped from this config.- job_name: "prometheus"# metrics_path defaults to '/metrics'# scheme defaults to 'http'.static_configs:- targets: ["localhost:9090"]# 添加下列配置- job_name: "pushgateway"static_configs:- targets: ["localhost:9091"]labels:instance: pushgateway- job_name: "node exporter"static_configs:- targets: ["node01:9100","node02:9100","node03:9100"]
2)scp復制node_exporter(一個節點可不做)
[root@node01 local]# scp -r node_exporter-1.8.0.linux-amd64/ node02:/usr/local/
[root@node01 local]# scp -r node_exporter-1.8.0.linux-amd64/ node03:/usr/local/
3)啟動node_exporter(三個節點都啟動)
[root@node01 local]# cd node_exporter-1.8.0.linux-amd64/
[root@node01 node_exporter-1.8.0.linux-amd64]# nohup ./node_exporter &
瀏覽器訪問
node_exporter服務地址:http://192.168.200.7:9100/
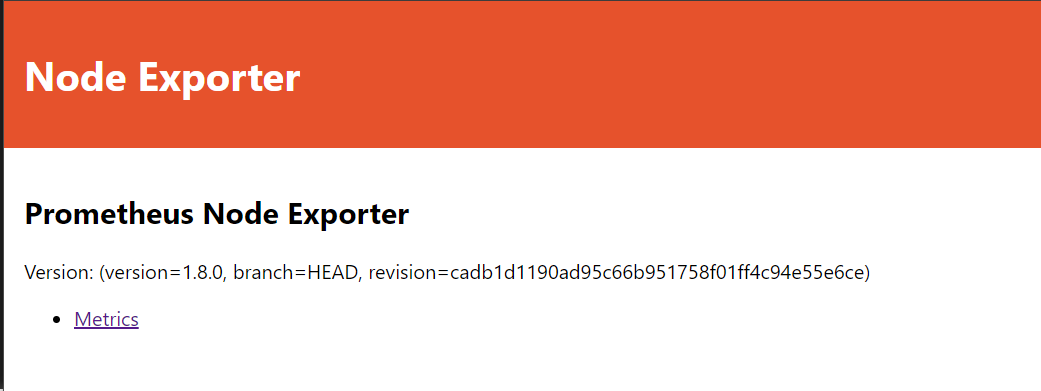
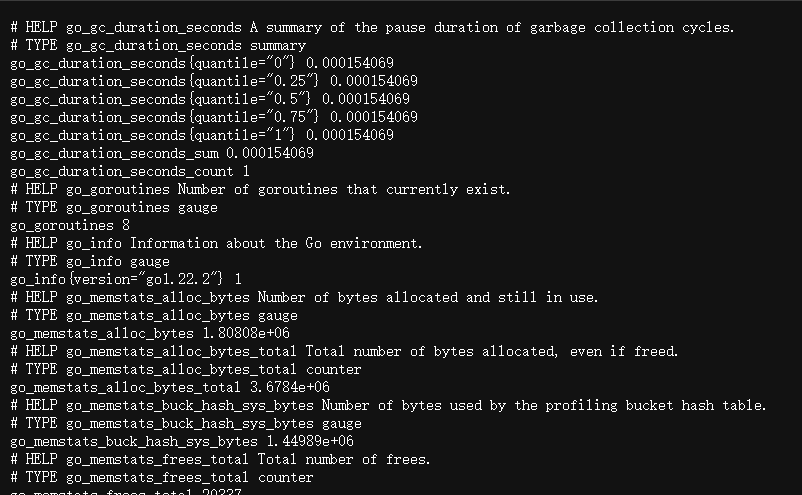
node_exporter服務監控指標地址:http://192.168.200.7:9100/metrics,可以看到當前 node exporter 獲取到的當前主機的所有監控數據
4)啟動Pushgateway、Prometheus
[root@node01 pushgateway-1.8.0.linux-amd64]# nohup ./pushgateway --web.listen-address :9091 > ./pushgateway.log 2>&1 &
[root@node01 prometheus-2.45.5.linux-amd64]# nohup ./prometheus --config.file=prometheus.yml > ./prometheus.log 2>&1 &
瀏覽器訪問
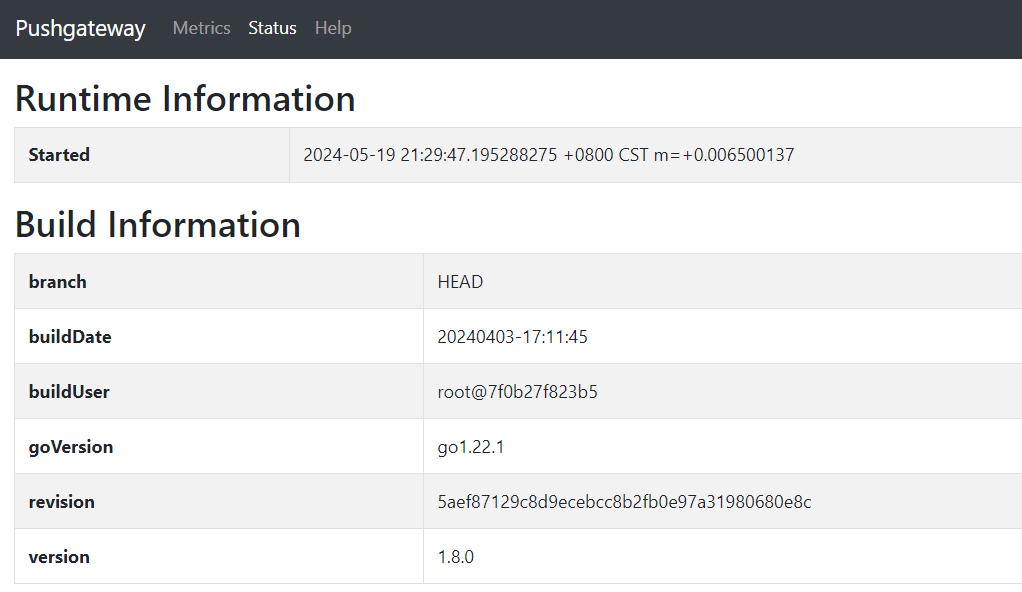
pushgateway服務地址:http://192.168.200.7:9091
prometheus服務地址:http://192.168.200.7:9090/
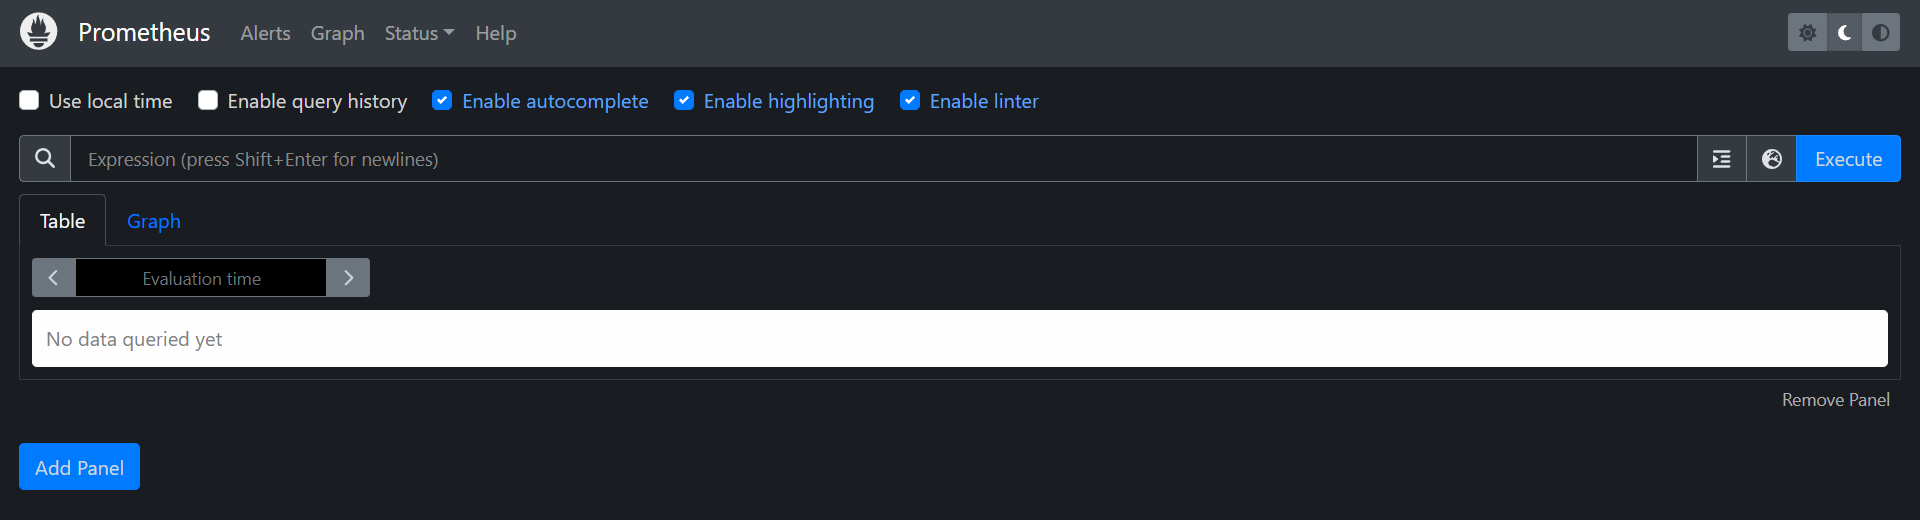
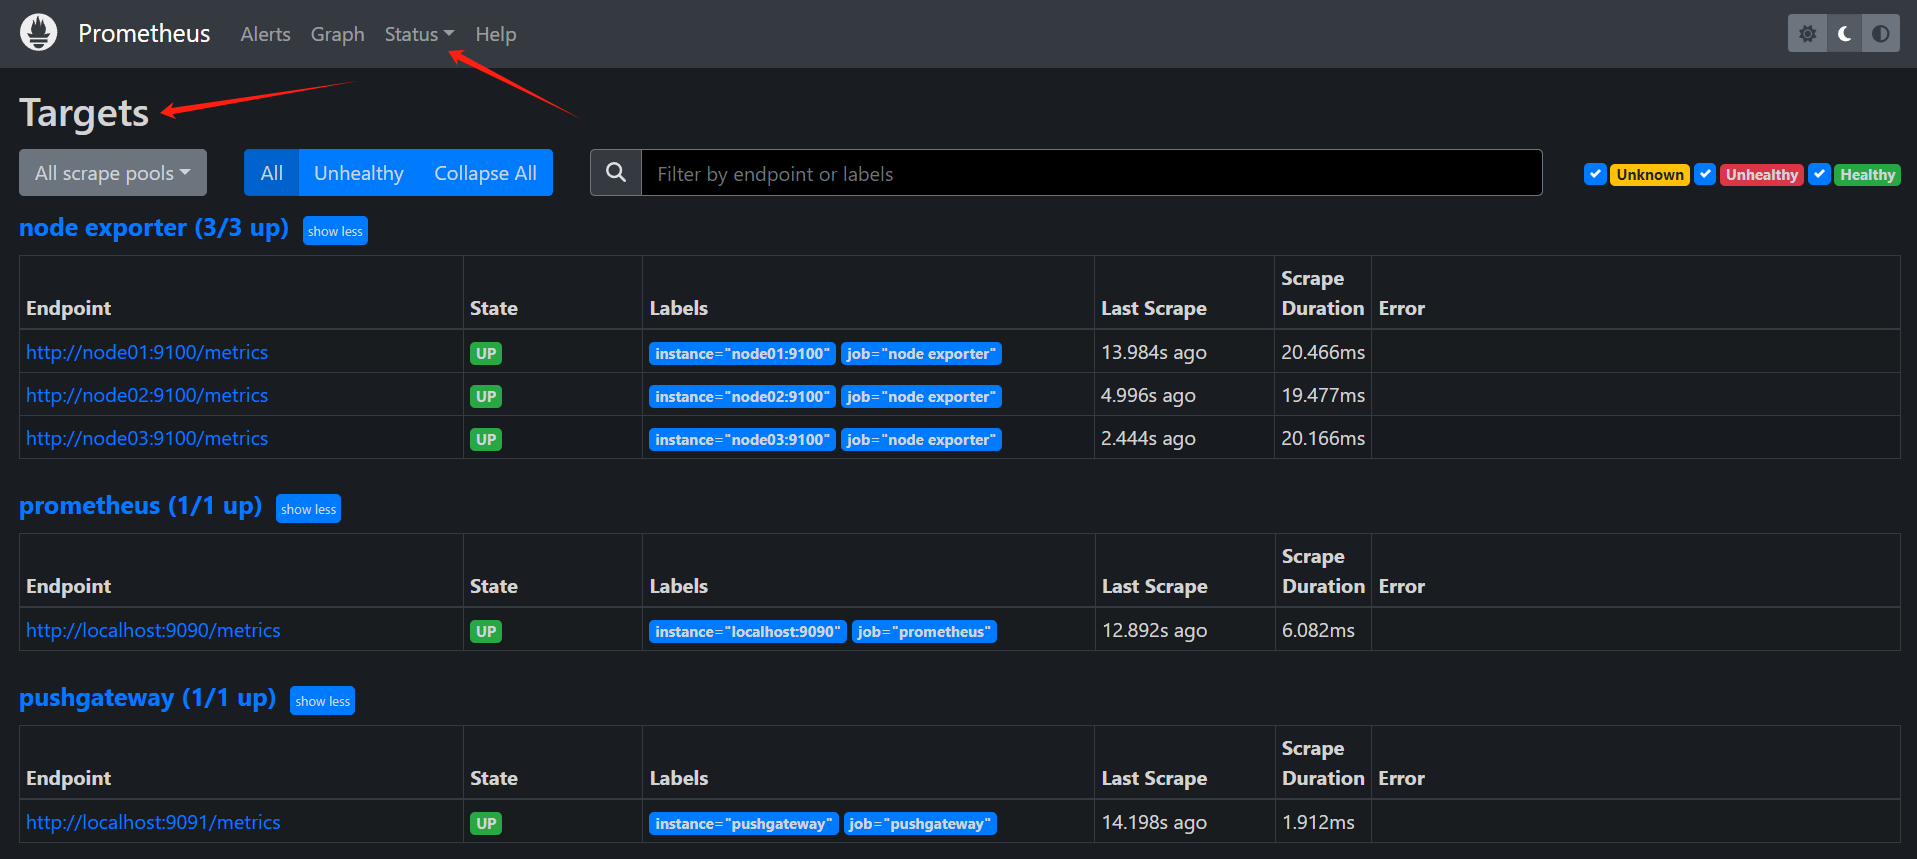
查看組件狀態是否正常
啟停腳本
由于,咱們Prometheus服務以及相關組件,通過二進制命令手動啟動的,不便于管理。所以我們可以編寫Shell啟停腳本管理。如下:
注意:服務的路徑需要根據自己的存放位置自行修改
[root@node01 ~]# cat /usr/local/bin/moniter
#!/bin/bash
case $1 in
"start"){echo "=== 啟動 Prometheus ==="nohup /usr/local/prometheus-2.45.5.linux-amd64/prometheus --config.file=/usr/local/prometheus-2.45.5.linux-amd64/prometheus.yml > /usr/local/prometheus-2.45.5.linux-amd64/prometheus.log 2>&1 &echo "=== 啟動 Node_exporter ==="nohup /usr/local/node_exporter-1.8.0.linux-amd64/node_exporter > /usr/local/node_exporter-1.8.0.linux-amd64/node_exporter.log 2>&1 &echo "=== 啟動 Pushgateway ==="nohup /usr/local/pushgateway-1.8.0.linux-amd64/pushgateway --web.listen-address :9091 > /usr/local/pushgateway-1.8.0.linux-amd64/pushgateway.log 2>&1 &};;
"stop"){echo "=== 停止 Pushgateway ==="pgrep -f pushgateway | xargs killecho "=== 停止 Node_exporter ==="pgrep -f node_exporter | xargs killecho "=== 停止 Prometheus ==="pgrep -f prometheus | xargs kill};;
esac
執行腳本
[root@node01 ~]# chmod +x /usr/local/bin/moniter[root@node01 ~]# moniter stop
=== 停止 Pushgateway ===
=== 停止 Node_exporter ===
=== 停止 Prometheus ===
[root@node01 ~]#
[root@node01 ~]#
[root@node01 ~]# moniter start
=== 啟動 Prometheus ===
=== 啟動 Node_exporter ===
=== 啟動 Pushgateway ===
更多運維干貨,關注下方公眾號


