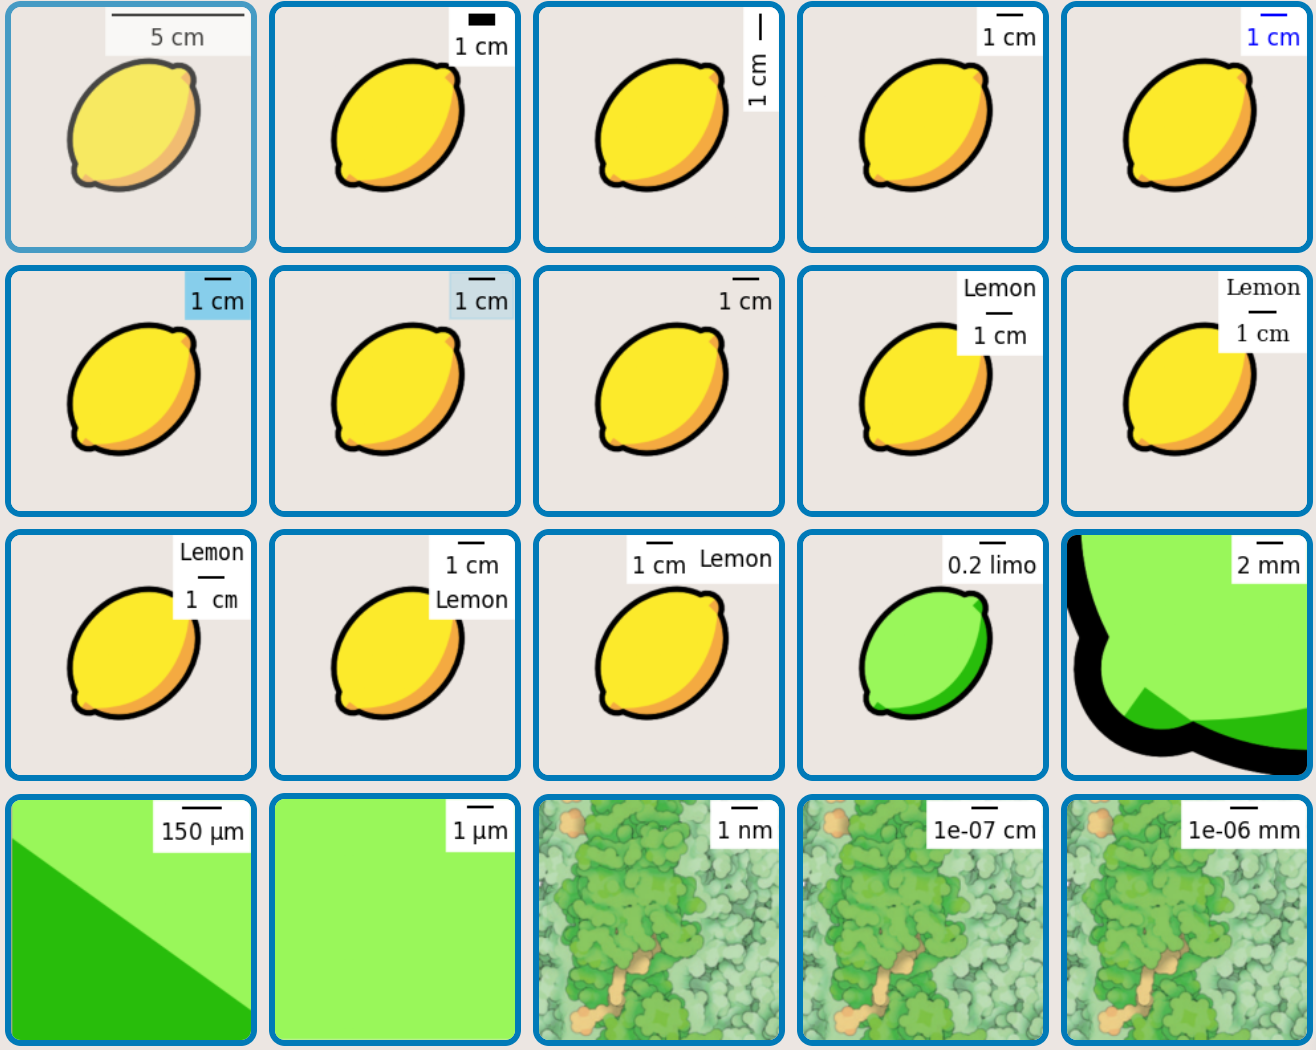
?Scale Bar(比例尺)用于直觀表示圖像與實際物理尺寸(如微米、毫米等)的對應關系。例如,在顯微鏡圖像中,比例尺可以標注“75μm”表示圖中某線段對應的實際長度。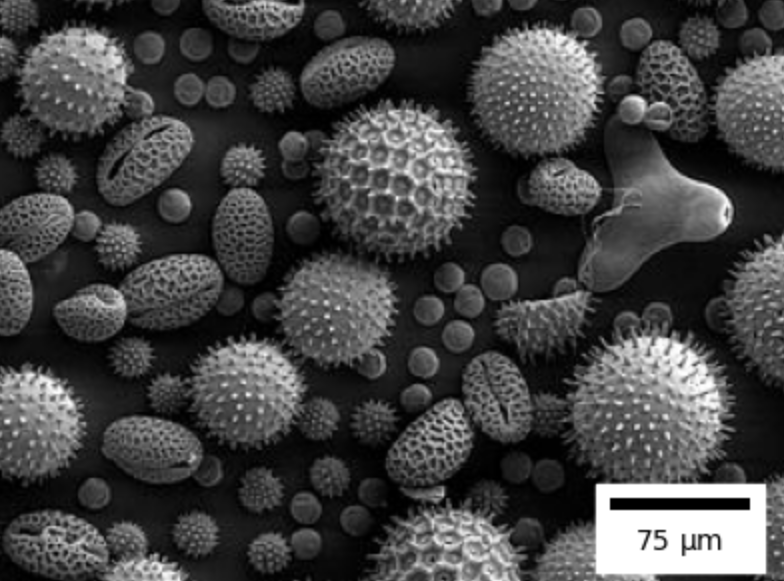
這里分享使用matplotlib中的imshow結合matplotlib-scalebar為imags plot添加?Scale Bar。
首先,使用matplotlib imshow搞定imags plot,
import numpy as np
import matplotlib.pyplot as plt
from matplotlib_scalebar.scalebar import ScaleBar
import matplotlib.image as mpimg%config InlineBackend.figure_format='retina'
%config InlineBackend.print_figure_kwargs = {'pad_inches':0}def imshow_bar(im, scalebar):fig, ax = plt.subplots(figsize=(2, 2), dpi=60)ax.axis("off")ax.imshow(im)ax.add_artist(scalebar)img = mpimg.imread("green.png")
然后,使用matplotlib_scalebar中的ScaleBar添加比例尺。
添加"cm"級比例尺,
scalebar = ScaleBar(0.3, "mm") #定義比例尺
imshow_bar(img, scalebar)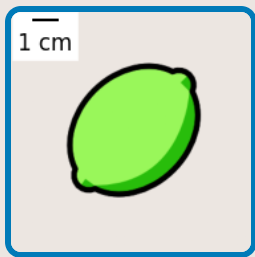
添加"mm"級比例尺,?
scalebar = ScaleBar(0.3 / 5, "mm")#定義比例尺
imshow_bar(imgx5, scalebar)
?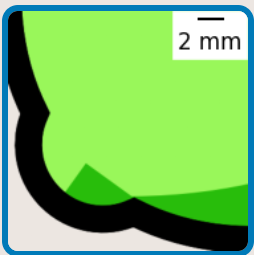
添加"nm"級比例尺,?
scalebar = ScaleBar(0.3 / 10000000, "mm")#定義比例尺
imshow_bar(imgx10000000, scalebar)
?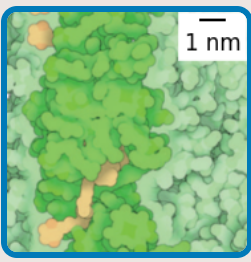
更多個性化比例尺,
這個智能體,自動讀論文并轉化為高質量、可運行的代碼庫自動將論文轉化為功能完整的代碼庫(高質量、可運行的)![]() https://mp.weixin.qq.com/s/sYF-7SAEOdKPBYGuGvl8NA
https://mp.weixin.qq.com/s/sYF-7SAEOdKPBYGuGvl8NA


)


:用戶會話管理/文件類型拓展/諸多優化更新)
)
)

![[逆向工程]C++實現DLL注入:原理、實現與防御全解析(二十五)](http://pic.xiahunao.cn/[逆向工程]C++實現DLL注入:原理、實現與防御全解析(二十五))

