k8s監控方案實踐(一):部署Prometheus與Node Exporter
文章目錄
- k8s監控方案實踐(一):部署Prometheus與Node Exporter
- 一、Prometheus簡介
- 二、Prometheus+Node Exporter實戰部署
- 1. 創建Namespace(prometheus-namespace.yaml)
- 2. 創建Node Exporter DaemonSet(node-exporter.yaml)
- 3. 創建ServiceAccount(prometheus-serviceaccount.yaml)
- 4. 創建ClusterRoleBinding(prometheus-clusterrolebinding.yaml)
- 5. 創建ConfigMap(prometheus-config.yaml)
- 5. 創建Service(prometheus-svc.yaml)
- 7. 創建Deployment(prometheus-deploy.yaml)
- 8. 部署所有資源
- 三、驗證部署
- 1. 驗證Pod狀態
- 2. 訪問Prometheus Web UI
- 總結
隨著容器化和微服務架構的普及,系統架構日益復雜,傳統監控工具難以勝任對多服務、多節點環境的全面可觀測性需求。Prometheus 作為 Cloud Native Computing Foundation(CNCF) 的核心項目之一,因其靈活的數據模型、強大的查詢語言(PromQL)以及對 Kubernetes 的天然支持,逐漸成為容器環境下主流的監控方案。
在本系列中,我們將圍繞 Prometheus 在 Kubernetes 中的部署與實踐展開介紹。本篇作為第一篇,將聚焦于 Prometheus 的基礎部署,并集成 Node Exporter 實現對集群節點資源(如 CPU、內存、磁盤、網絡等)的實時監控,為后續服務指標采集與告警體系搭建打下基礎。
一、Prometheus簡介
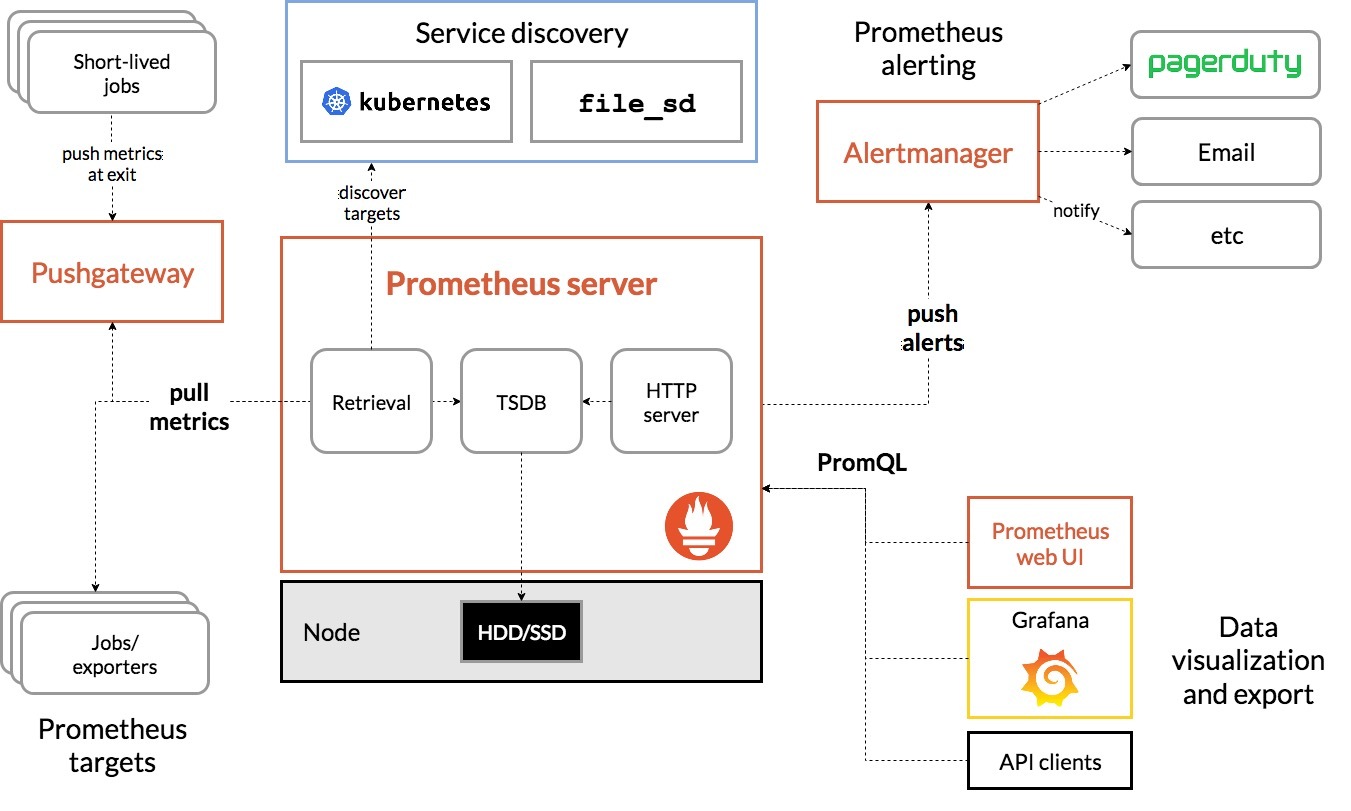
Prometheus 采用拉取模型(Pull-based)來定期采集被監控目標暴露的指標數據,所有數據以時間序列的形式存儲在本地時間序列數據庫中,支持高效壓縮和快速查詢。其核心組件包括:
- Prometheus Server:主服務組件,負責服務發現、數據抓取、存儲和 PromQL 查詢處理
- Exporter:用于暴露指標的采集器,常見如 Node Exporter(主機指標)、Kube-State-Metrics(K8s 狀態)、Blackbox Exporter(探測)等
- Alertmanager:負責接收和管理 Prometheus 的告警信息,并支持郵件、Slack、WebHook 等通知方式
- Pushgateway(可選):用于支持短生命周期任務的指標上報,如定時任務腳本
- Web UI 與 HTTP API:提供基礎的可視化查詢界面與外部系統接入能力
在 Kubernetes 環境下,Prometheus 可結合服務發現機制動態發現集群中的 Pod、Service、Node 等資源,從而自動完成監控目標的注冊與指標抓取,非常適合用于監控容器化和微服務系統。
二、Prometheus+Node Exporter實戰部署
1. 創建Namespace(prometheus-namespace.yaml)
創建名為prometheus的命名空間,用于隔離部署監控相關資源
apiVersion: v1
kind: Namespace
metadata:name: prometheus
2. 創建Node Exporter DaemonSet(node-exporter.yaml)
以守護進程形式在所有節點部署Node Exporter,用于采集節點 CPU、內存、磁盤、網絡等基礎指標
apiVersion: apps/v1
kind: DaemonSet
metadata:name: node-exporternamespace: prometheuslabels:name: node-exporter
spec:selector:matchLabels:name: node-exportertemplate:metadata:labels:name: node-exporterspec:hostPID: truehostIPC: truehostNetwork: true  #使用宿主機網絡,便于 Prometheus 拉取指標containers:- name: node-exporterimage: harbor.local/k8s/node-exporter:v1.7.0imagePullPolicy: IfNotPresentports:- containerPort: 9100securityContext:privileged: trueargs:- --path.procfs- /host/proc- --path.sysfs- /host/sys- --collector.filesystem.ignored-mount-points- '"^/(sys|proc|dev|host|etc)($|/)"'volumeMounts:- name: devmountPath: /host/dev- name: procmountPath: /host/proc- name: sysmountPath: /host/sys- name: rootfsmountPath: /rootfstolerations:- key: "node-role.kubernetes.io/control-plane"operator: "Exists"effect: "NoSchedule"volumes:- name: prochostPath:path: /proc- name: devhostPath:path: /dev- name: syshostPath:path: /sys- name: rootfshostPath:path: /root
3. 創建ServiceAccount(prometheus-serviceaccount.yaml)
為 Prometheus 創建專屬的ServiceAccount,用于后續綁定權限
apiVersion: v1
kind: ServiceAccount
metadata:name: prometheusnamespace: prometheus
4. 創建ClusterRoleBinding(prometheus-clusterrolebinding.yaml)
將集群管理員權限綁定到 Prometheus 的ServiceAccount,以便其能訪問 Kubernetes API 拉取監控目標
apiVersion: rbac.authorization.k8s.io/v1
kind: ClusterRoleBinding
metadata:name: prometheus-clusterrolebinding
subjects:- kind: ServiceAccountname: prometheusnamespace: prometheus
roleRef:kind: ClusterRolename: cluster-adminapiGroup: rbac.authorization.k8s.io
5. 創建ConfigMap(prometheus-config.yaml)
定義 Prometheus 的主配置文件prometheus.yml,配置抓取規則、服務發現方式、靜態目標與黑盒探測等
---
kind: ConfigMap
apiVersion: v1
metadata:labels:app: prometheusname: prometheus-confignamespace: prometheus
data:prometheus.yml: |global:scrape_interval: 15sscrape_timeout: 10sevaluation_interval: 1malerting:alertmanagers:- static_configs:- targets: ['alertmanager.prometheus.svc.cluster.local:9093']rule_files:- "rules/*.yml"scrape_configs:- job_name: 'kubernetes-node'kubernetes_sd_configs:- role: noderelabel_configs:- source_labels: [__address__]regex: '(.*):10250'replacement: '${1}:9100'target_label: __address__action: replace- action: labelmapregex: __meta_kubernetes_node_label_(.+)- job_name: 'kubernetes-node-cadvisor'kubernetes_sd_configs:- role:  nodescheme: httpstls_config:ca_file: /var/run/secrets/kubernetes.io/serviceaccount/ca.crtbearer_token_file: /var/run/secrets/kubernetes.io/serviceaccount/tokenrelabel_configs:- action: labelmapregex: __meta_kubernetes_node_label_(.+)- target_label: __address__replacement: kubernetes.default.svc:443- source_labels: [__meta_kubernetes_node_name]regex: (.+)target_label: __metrics_path__replacement: /api/v1/nodes/${1}/proxy/metrics/cadvisor- job_name: 'kubernetes-apiserver'kubernetes_sd_configs:- role: endpointsscheme: httpstls_config:ca_file: /var/run/secrets/kubernetes.io/serviceaccount/ca.crtbearer_token_file: /var/run/secrets/kubernetes.io/serviceaccount/tokenrelabel_configs:- source_labels: [__meta_kubernetes_namespace, __meta_kubernetes_service_name, __meta_kubernetes_endpoint_port_name]action: keepregex: default;kubernetes;https- job_name: 'kubernetes-service-endpoints'kubernetes_sd_configs:- role: endpointsrelabel_configs:- source_labels: [__meta_kubernetes_service_annotation_prometheus_io_scrape]action: keepregex: true- source_labels: [__meta_kubernetes_service_annotation_prometheus_io_scheme]action: replacetarget_label: __scheme__regex: (https?)- source_labels: [__meta_kubernetes_service_annotation_prometheus_io_path]action: replacetarget_label: __metrics_path__regex: (.+)- source_labels: [__address__, __meta_kubernetes_service_annotation_prometheus_io_port]action: replacetarget_label: __address__regex: ([^:]+)(?::\d+)?;(\d+)replacement: $1:$2- action: labelmapregex: __meta_kubernetes_service_label_(.+)- source_labels: [__meta_kubernetes_namespace]action: replacetarget_label: kubernetes_namespace- source_labels: [__meta_kubernetes_service_name]action: replacetarget_label: kubernetes_name- job_name: kubernetes-etcdkubernetes_sd_configs:- role: endpointsrelabel_configs:- action: keepregex: kube-system;etcdsource_labels:- __meta_kubernetes_namespace- __meta_kubernetes_service_name      - job_name: 'k8s-cluster'scrape_interval: 15sstatic_configs:- targets: ['192.168.100.101:9100']labels:instance: 'master-100.101'- targets: ['192.168.100.102:9100']labels:instance: 'node1-100.102'- targets: ['192.168.100.103:9100']labels:instance: 'node2-100.103'- job_name: 'alertmanager'scrape_interval: 15sstatic_configs:- targets: ['alertmanager.prometheus.svc.cluster.local:9093']- job_name: "blackbox_http"metrics_path: /probeparams:module: [http_2xx]static_configs:- targets:- https://www.baidu.comrelabel_configs:- source_labels: [__address__]target_label: __param_target- source_labels: [__param_target]target_label: instance- target_label: __address__replacement: 192.168.100.104:9115- job_name: "blackbox_tcp"metrics_path: /probeparams:module: [tcp_connect]static_configs:- targets: - 192.168.100.101:3306relabel_configs:- source_labels: [__address__]target_label: __param_target- source_labels: [__param_target]target_label: instance- target_label: __address__replacement: 192.168.100.104:9115
5. 創建Service(prometheus-svc.yaml)
暴露 Prometheus Web UI 服務端口(9090),通過NodePort方式允許外部訪問
apiVersion: v1
kind: Service
metadata:name: prometheusnamespace: prometheuslabels:app: prometheus
spec:type: NodePortports:- port: 9090targetPort: 9090nodePort: 30001protocol: TCPselector:app: prometheuscomponent: server
7. 創建Deployment(prometheus-deploy.yaml)
部署Prometheus Server,指定使用的配置文件和掛載方式,綁定上一步的ServiceAccount,支持高可用部署(當前為單實例)
---
apiVersion: apps/v1
kind: Deployment
metadata:name: prometheus-servernamespace: prometheuslabels:app: prometheus
spec:replicas: 1  #單實例部署,可根據需要擴展為高可用selector:matchLabels:app: prometheuscomponent: server#matchExpressions:#- {key: app, operator: In, values: [prometheus]}#- {key: component, operator: In, values: [server]}template:metadata:labels:app: prometheuscomponent: serverannotations:prometheus.io/scrape: 'false'spec:nodeName: node2    #固定部署在node2節點上(也可不指定)serviceAccountName: prometheuscontainers:- name: prometheusimage: harbor.local/k8s/prometheus:v2.37.6imagePullPolicy: IfNotPresentcommand:- prometheus- --config.file=/etc/prometheus/prometheus.yml- --storage.tsdb.path=/prometheus  #設置本地數據存儲路徑- --storage.tsdb.retention=720h- --web.enable-lifecycle    #支持熱更新配置- --web.enable-admin-api - --storage.tsdb.retention.time=30dports:- containerPort: 9090protocol: TCPvolumeMounts:- mountPath: /etc/prometheus/name: prometheus-config- mountPath: /prometheus/name: prometheus-storage-volume- mountPath: /etc/prometheus/rulesname: prometheus-rules-volumevolumes:- name: prometheus-configconfigMap:name: prometheus-config- name: prometheus-storage-volumehostPath:#需要去node2節點創建這兩個目錄并使用chmod -R 777授權path: /kubernetes/prometheus/data/  type: Directory- name: prometheus-rules-volumehostPath:path: /kubernetes/prometheus/rules  type: Directory
8. 部署所有資源
kubectl apply -f prometheus-namespace.yaml
kubectl apply -f node-exporter.yaml
kubectl apply -f prometheus-serviceaccount.yaml
kubectl apply -f prometheus-clusterrolebinding.yaml
kubectl apply -f prometheus-config.yaml
kubectl apply -f prometheus-svc.yaml
kubectl apply -f prometheus-deploy.yaml
三、驗證部署
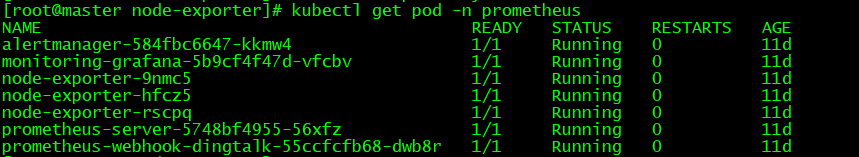
1. 驗證Pod狀態
kubectl get pod -n prometheus
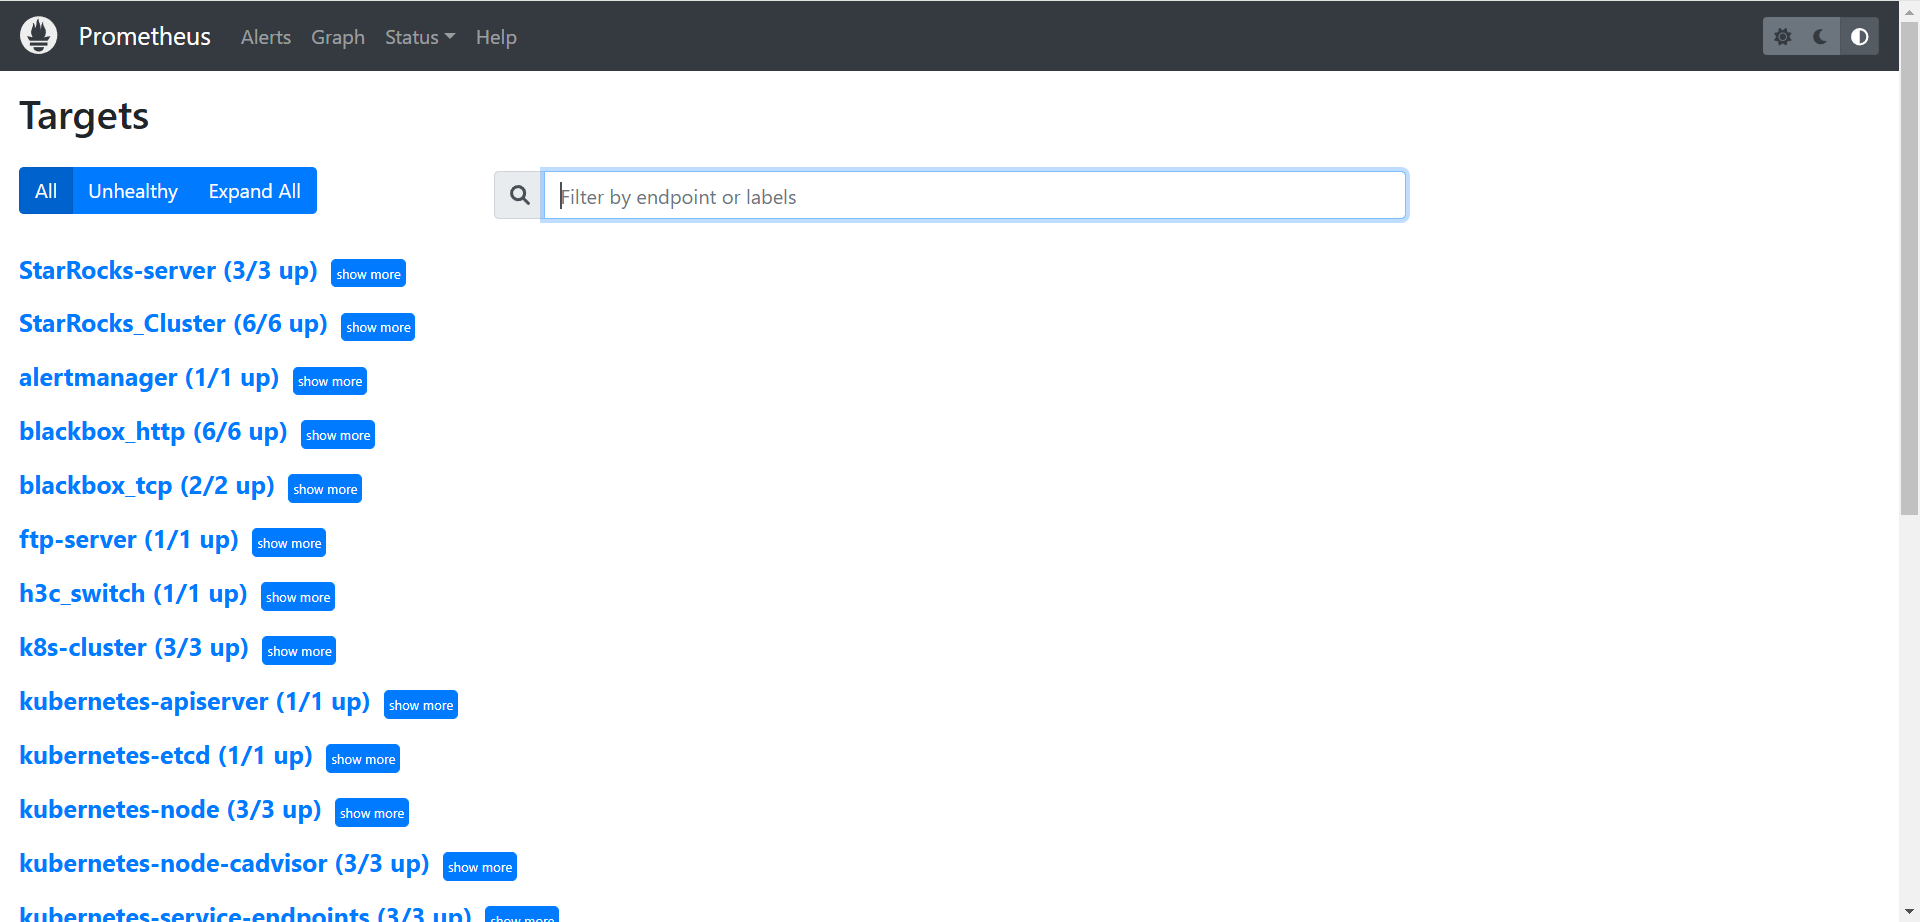
2. 訪問Prometheus Web UI
通過瀏覽器訪問 http://ip:30001,進入 Prometheus Web UI
總結
🚀 本文介紹了如何在 Kubernetes 集群中部署 Prometheus,并結合 Node Exporter 實現對節點資源的基礎監控。通過配置 ServiceAccount、RBAC 權限、Prometheus 配置文件以及 DaemonSet 部署 Node Exporter,完成了從數據采集到可視化的基本監控體系搭建。
? 在下一篇文章中,我們將繼續完善監控體系,重點介紹如何在 Prometheus 中集成 Alertmanager,實現基于指標的自動化告警機制,包括告警規則配置、通知渠道設置(如郵件、Webhook 等)以及與 Prometheus 的聯動流程,為運維體系提供實時的預警能力。

)


、rsort()、asort()、arsort()、ksort()、krsort() 的適用場景與性能對比)


)


系列 PyTorch版)


)

