數據集:公開的World Happiness Report | Kaggle中的happiness dataset2017.
目標:基于GDP值預測幸福指數。(單特征預測)
代碼:
文件一:prepare_for_traning.py
"""用于科學計算的一個庫,提供了多維數組對象以及操作函數"""
from utils.features import prepare_for_training
"""數據預處理的一個私庫"""class LinearRegression:def __init__(self,data,labels,polynomial_degree = 0,sinusoid_degree = 0,normalize_data = True):"""進行預處理操作:param data::param labels::param polynomial_degree::param sinusoid_degree::param normalize_data:"""(data_processed,features_mean,features_deviation) = prepare_for_training(data,polynomial_degree = 0,sinusoid_degree = 0,normalize_data = True)self.data = data_processedself.labels = labelsself.features_mean = features_meanself.features_deviation = features_deviationself.polynomial_degree = polynomial_degreeself.sinusoid_degree = sinusoid_degreeself.normalize_data = normalize_datanum_features = self.data.shape[1]self.theta = np.zeros((num_features,1))""""數據,學習率,訓練次數"""def train(self,alpha,num_iterations = 500):"""訓練模塊:梯度下降"""cost_history = self.gradient_descent(alpha,num_iterations)return self.theta,cost_historydef gradient_descent(self,alpha,num_iterations):"""迭代模塊"""cost_history = []for _ in range(num_iterations):self.gradient_step(alpha)cost_history.append(self.cost_function(self.data,self.labels))return cost_historydef gradient_step(self,alpha):"""梯度下降參數更新算法,矩陣計算,使用小批量梯度下降算法:param self::param alpha::return:"""num_examples = self.data.shape[0]prediction = LinearRegression.hypothesis(self.data,self.theta)delta = prediction - self.labelstheta = self.thetatheta = theta - alpha*(1/num_examples)*(np.dot(delta.T,self.data)).Tself.theta = thetadef cost_function(self,data,labels):"""損失計算模塊:param self::param data::param labels::return:"""num_examples = data.shape[0]delta = LinearRegression.hypothesis(self.data,self.theta) - labelscost = (1/2)*np.dot(delta.T,delta)/num_examples"""print(cost.shape)"""return cost[0][0]"""裝飾器"""@staticmethoddef hypothesis(data,theta):prediction = np.dot(data,theta)return predictiondef get_cost(self,data,labels):data_processed = prepare_for_training(data,self.polynomial_degree,self.sinusoid_degree,self.normalize_data)[0]return self.cost_function(data_processed,labels)def predict(self,data):data_processed = prepare_for_training(data,self.polynomial_degree,self.sinusoid_degree,self.normalize_data)[0]predictions = LinearRegression.hypothesis(data_processed,self.theta)return predictions
文件2:Linear_regression.py?
import numpy as np
"""用于科學計算的一個庫,提供了多維數組對象以及操作函數"""
import pandas as pd
"""一個用于數據導入、導出、清洗和分析的庫,本文中導入csv格式數據等等"""
import matplotlib.pyplot as plt
"""pyplot提供了繪圖接口"""
import matplotlib
"""一個強大的繪圖庫"""# 設置matplotlib正常顯示中文和負號
matplotlib.rcParams['font.family'] = 'SimHei' # 指定默認字體為黑體
matplotlib.rcParams['axes.unicode_minus'] = False # 正確顯示負號from prepare_for_training import LinearRegressiondata = pd.read_csv("D:/machine_learning/archive/2017.csv")
train_data = data.sample(frac = 0.8)
test_data = data.drop(train_data.index)input_param_name = 'Economy..GDP.per.Capita.'
output_param_name = 'Happiness.Score'x_train = train_data[[input_param_name]].values
y_train = train_data[[output_param_name]].valuesx_test = test_data[[input_param_name]].values
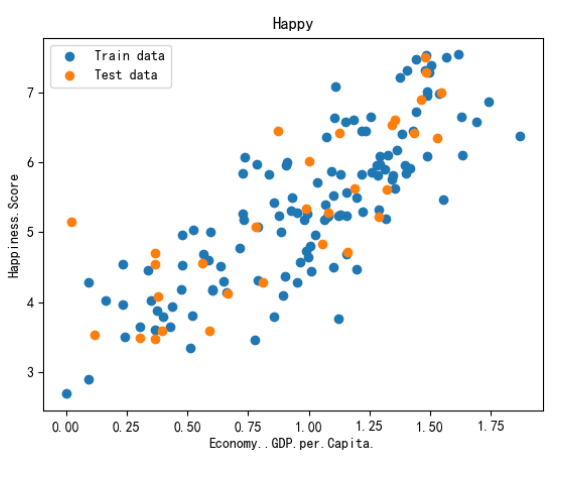
y_test = test_data[[output_param_name]].valuesplt.scatter(x_train,y_train,label ='Train data')
plt.scatter(x_test,y_test,label ='Test data')
plt.xlabel(input_param_name)
plt.ylabel(output_param_name)
plt.title('Happy')
plt.legend()
plt.show()"""訓練次數,學習率"""
num_iterations = 500
learning_rate = 0.01linear_regression = LinearRegression(x_train,y_train)
(theta,cost_history) = linear_regression.train(learning_rate,num_iterations)
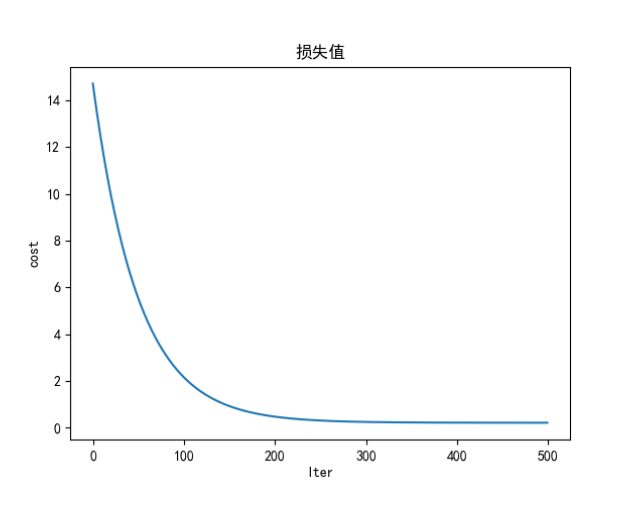
print('開始時的損失',cost_history[0])
print('訓練后的損失',cost_history[-1])plt.plot(range(num_iterations),cost_history)
plt.xlabel('Iter')
plt.ylabel('cost')
plt.title('損失值')
plt.show()predictions_num = 100
x_predictions = np.linspace(x_train.min(),x_train.max(),predictions_num).reshape(predictions_num,1)
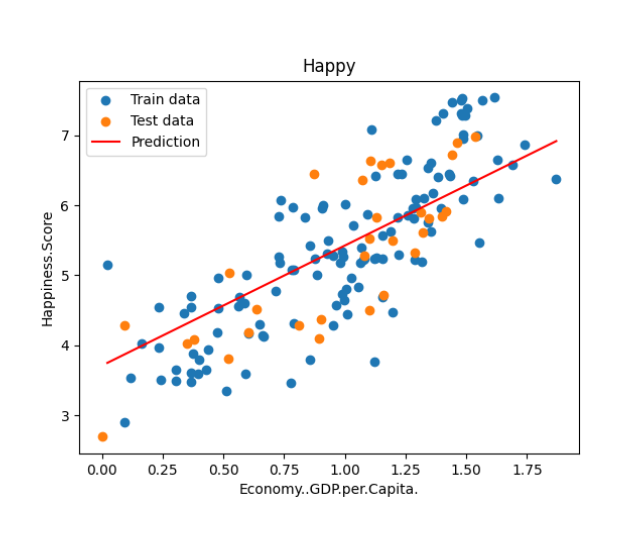
y_predictions = linear_regression.predict(x_predictions)plt.scatter(x_train,y_train,label ='Train data')
plt.scatter(x_test,y_test,label ='Test data')
plt.plot(x_predictions,y_predictions,'r',label = 'Prediction')
plt.xlabel(input_param_name)
plt.ylabel(output_param_name)
plt.title('Happy')
plt.legend()
plt.show()效果圖:

)


)
)


顯示到Qt Creator列表的方法)


)

