Opencv計算機視覺編程攻略-第四節 圖直方圖統計像素
- 1.計算圖像直方圖
- 2.基于查找表修改圖像
- 3.直方圖均衡化
- 4.直方圖反向投影進行內容查找
- 5.用均值平移法查找目標
- 6.比較直方圖搜索相似圖像
- 7.用積分圖統計圖像
1.計算圖像直方圖
圖像統計直方圖的概念
圖像統計直方圖是一種用于描述圖像中像素分布情況的工具。具體來說,灰度直方圖是一個關于灰度級別的函數,它記錄了圖像中每種灰度級別對應的像素數量。這種分布反映了圖像亮度的整體特性。
對于彩色圖像(如RGB),可以通過將每個顏色通道分別映射到特定索引來構建其直方圖,并利用核密度估計的方法來累積權重,從而得到更精確的顏色分布信息。
統計直方圖主要基于opencv 的calcHist函數實現,其具體配置如下
calcHist(&image, 1, // histogram of 1 image onlychannels, // the channel usedMat(), // no mask is usedhist, // the resulting histogram1, // it is a 1D histogramhistSize, // number of binsranges // pixel value range);
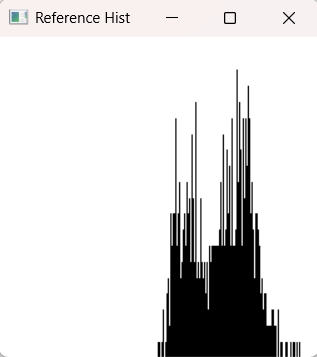
學習文中給出的手繪統計直方圖,基于統計的頻數,繪制線高 line
// Create an image representing a histogramstatic Mat getImageOfHistogram(const Mat &hist, int zoom) {// Get min and max bin valuesdouble maxVal = 0;double minVal = 0;minMaxLoc(hist, &minVal, &maxVal, 0, 0);// get histogram sizeint histSize = hist.rows;// Square image on which to display histogramMat histImg(histSize*zoom, histSize*zoom, CV_8U, Scalar(255));// set highest point at 90% of nbins (i.e. image height)int hpt = static_cast<int>(0.9*histSize);// Draw vertical line for each binfor (int h = 0; h < histSize; h++) {float binVal = hist.at<float>(h);if (binVal>0) {int intensity = static_cast<int>(binVal*hpt / maxVal);line(histImg, Point(h*zoom, histSize*zoom),Point(h*zoom, (histSize - intensity)*zoom), Scalar(0), zoom);}}return histImg;}
2.基于查找表修改圖像
所謂的查找表,相當于是一個數組,每個數組對應i值的原像素值映射為目標像素值
人工構建查找表
cv::Mat lut(1,256,CV_8U); // 1x256 matrix
// Or:
// int dim(256);
// cv::Mat lut(1,  // 1 dimension
// 	&dim,          // 256 entries
//	CV_8U);        // uchar
for (int i=0; i<256; i++) {// 0 becomes 255, 1 becomes 254, etc.lut.at<uchar>(i)= 255-i;
}
通過opencv的LUT函數一鍵映射查找表,進行取反操作
Mat result;// apply lookup tableLUT(image,lookup,result);


3.直方圖均衡化
上文了解了統計直方圖和查找表,基于直方圖統計結果構建均衡化的查找表,從而全局修改圖像整體顏色
equalizeHist(image,result); // 直接使用opencv函數實現均衡化


統計直方圖的原理一般是值選擇一定像素值范圍,將該范圍的像素映射的一個更大范圍的像素值范圍中,從而使得整體圖像顯得更均勻,手動實現代碼如下:
Mat stretch(const Mat &image, float percentile) {// number of pixels in percentilefloat number= image.total()*percentile;// Compute histogram firstMat hist = getHistogram(image);// find left extremity of the histogramint imin = 0;for (float count=0.0; imin < 256; imin++) {// number of pixel at imin and below must be > numberif ((count+=hist.at<float>(imin)) >= number)break;}// find right extremity of the histogramint imax = 255;for (float count=0.0; imax >= 0; imax--) {// number of pixel at imax and below must be > numberif ((count += hist.at<float>(imax)) >= number)break;}// Create lookup tableint dims[1] = { 256 };Mat lookup(1, dims, CV_8U);for (int i = 0; i<256; i++) {if (i < imin) lookup.at<uchar>(i) = 0;else if (i > imax) lookup.at<uchar>(i) = 255;else lookup.at<uchar>(i) = cvRound(255.0*(i - imin) / (imax - imin));}// Apply lookup tableMat result;result = applyLookUp(image, lookup);return result;}

4.直方圖反向投影進行內容查找
區域內圖像的統計直方圖某種程度表示了整體顏色分布特征,因而可以使用區域的統計直方圖作為特征進行相似內容查找,以區域內白云的顏色為例進行統計


calcBackProject(&image,1, // we only use one image at a timechannels, // vector specifying what histogram dimensions belong to what image channelsshistogram, // the histogram we are usingresult, // the resulting back projection imageranges, // the range of values, for each dimension255.0 // the scaling factor is chosen such that a histogram value of 1 maps to 255);


在灰度圖內進行統計分析,難以分割出較好的效果,使用rgb往往可以獲得不錯的效果,彩色圖使用同一個函數

5.用均值平移法查找目標

以這個猩猩的臉部特征生成統計特征圖
// 顏色轉為hsv 如上一節所說,hsv分辨皮膚更清晰cv::cvtColor(image, hsv, cv::COLOR_BGR2HSV);// Get back-projection of hue histogramint ch[1]={0};finder.setThreshold(-1.0f); // no thresholdingcv::Mat result= finder.find(hsv,0.0f,180.0f,ch);// 使用反向統計直方圖獲得圖像上和目標區域的相似性概率圖// search objet with mean shift 使用均值漂移算法在概率圖中查找,最后在一張有偏移的圖像上準確找到目標cv::TermCriteria criteria(cv::TermCriteria::MAX_ITER | cv::TermCriteria::EPS,10, // iterate max 10 times1); // or until the change in centroid position is less than 1px

6.比較直方圖搜索相似圖像
在傳統數字圖像處理領域,使用統計直方圖進行圖像相似度對比,是常用的方法,簡單高效
double compare(const cv::Mat& image) {inputH= hist.getHistogram(image);// histogram comparison using intersectionreturn cv::compareHist(refH,inputH, cv::HISTCMP_INTERSECT);}

waves vs dog: 26535
waves vs marais: 12149
waves vs bear: 18353
waves vs beach: 33032 相似度最高的圖像
waves vs polar: 20768
waves vs moose: 15225
waves vs lake: 15486
waves vs fundy: 14309

7.用積分圖統計圖像
積分圖統計圖像,本質就是數組的前綴和算法,通過一次性求解前綴,后續每個位置的要素數量就可以直接查詢得到,避免每次的查找,這個在區域內進行搜索直方圖特征中有較好的應用,實際操作中,將顏色維度從256壓縮到更小空間從而實現加速:
double maxSimilarity=0.0;int xbest, ybest;// loop over a horizontal strip around girl location in initial imagefor (int y=110; y<120; y++) {for (int x=0; x<secondImage.cols-width; x++) {// compute histogram of 16 bins using integral imagehistogram= intHistogram(x,y,width,height);// compute distance with reference histogramdouble distance= cv::compareHist(refHistogram,histogram, cv::HISTCMP_INTERSECT);// find position of most similar histogramif (distance>maxSimilarity) {xbest= x;ybest= y;maxSimilarity= distance;}std::cout << "Distance(" << x << "," << y << ")=" << distance << std::endl;}}

如果看到這里,麻煩點一個贊再走,謝謝!相關代碼同樣上傳代碼庫鏈接: 點擊下載


:加密實現)


設計模式)
![[Vue]事件修飾符](http://pic.xiahunao.cn/[Vue]事件修飾符)


