在vscode中Debug ros c++程序
1 在Debug模式下編譯
如果用命令行catkin_make,在輸入catkin_make時加上一個參數:
catkin_make -DCMAKE_BUILD_TYPE=Debug
或者直接修改CMakelist.txt,添加以下代碼:
SET(CMAKE_BUILD_TYPE "Debug")
SET(CMAKE_CXX_FLAGS_DEBUG "$ENV{CXXFLAGS} -O0 -Wall -g -ggdb")
SET(CMAKE_CXX_FLAGS_RELEASE "$ENV{CXXFLAGS} -O3 -Wall")
2 編寫launch文件
?rosrun package node?改為roslaunch package xxx.launch
3 vscode?debug配置
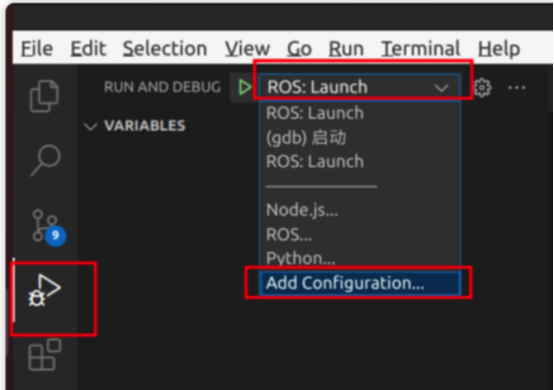
"version": "0.2.0","configurations": [{"name": "ROS: Launch","type": "ros","request": "launch","target": "/home/aaa/mycompany/15weeding/infer/yolov8/yolov8_ws_4/src/instance_seg/launch/instance_seg.launch"},4 Debug
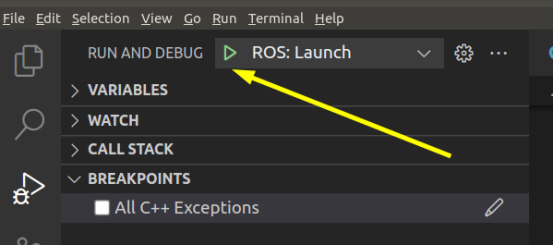
打斷點
啟動roscore,點擊綠色三角
調試方法
一種是調試coredump文件,另一種是在線調試。
大多使用在線調試,而在線調試又分為 roslaunch 調試和 rosrun node調試
使用gdb命令行在線調試
1安裝xterm
sudo apt install xterm
2 在Debug模式下編譯
如果用命令行catkin_make,在輸入catkin_make時加上一個參數:
catkin_make -DCMAKE_BUILD_TYPE=Debug
或者直接修改CMakelist.txt,添加以下代碼:
SET(CMAKE_BUILD_TYPE "Debug")
SET(CMAKE_CXX_FLAGS_DEBUG "$ENV{CXXFLAGS} -O0 -Wall -g -ggdb")
SET(CMAKE_CXX_FLAGS_RELEASE "$ENV{CXXFLAGS} -O3 -Wall")
launch文件添加GDB調試指令
在node標簽中添加參數
launch-prefix="xterm -e gdb -ex run --args"
<launch>
????<node pkg="learning_topic" type="person_subscriber" name="talker" output="screen" ?launch-prefix="xterm -e gdb -ex run --args"/>
????<node pkg="learning_topic" type="person_publisher" name="listener" output="screen" />
</launch>
The launch-prefix attribute of the tag that, among other things, makes it easy to debug a ROS node process. Here are some example launch-prefixes you might find useful:
launch-prefix=“xterm -e gdb --args” : run your node in a gdb in a separate xterm window, manually type run to start it
launch-prefix=“gdb -ex run --args” : run your node in gdb in the same xterm as your launch without having to type run to start it
launch-prefix=“stterm -g 200x60 -e gdb -ex run --args” : run your node in gdb in a new stterm window without having to type run to start it
launch-prefix=“valgrind” : run your node in valgrind
這個valgrind工具可以用于檢測內存泄露,并執行性能分析
launch-prefix=“xterm -e” : run your node in a separate xterm window
launch-prefix=“nice” : nice your process to lower its CPU usage
launch-prefix=“screen -d -m gdb --args” : useful if the node is being run on another machine; you can then ssh to that machine and do screen -D -R to see the gdb session
launch-prefix=“xterm -e python -m pdb” : run your python node a separate xterm window in pdb for debugging; manually type run to start it
rosrun node 的方式進行調試
rosrun --prefix 'gdb -ex run --args' ?[package_name] ?[node_name]
gdb core dump 調試
????????在Linux下可通過core文件來獲取當程序異常退出(如異常信號SIGSEGV, SIGABRT等)時的堆棧信息。core dump叫做核心轉儲,當程序運行過程中發生異常的那一刻的一個內存快照,操作系統在程序發生異常而異常在進程內部又沒有被捕獲的情況下,會把進程此刻內存、寄存器狀態、運行堆棧等信息轉儲保存在一個core文件里,叫core dump。core文件是程序非法執行后core dump后產生的文件,該文件是二進制文件,可以使用gdb、elfdump、objdump打開分析里面的具體內容。
產生core dump的可能原因:
(1)??內存訪問越界;
(2) 多線程程序使用了線程不安全的函數;
(3) 多線程讀寫的數據未加鎖保護;
?(4) 非法指針;
?(5) 堆棧溢出。
在Debug模式下編譯
如果用命令行catkin_make,在輸入catkin_make時加上一個參數:
catkin_make -DCMAKE_BUILD_TYPE=Debug
或者直接修改CMakelist.txt,添加以下代碼:
SET(CMAKE_BUILD_TYPE "Debug")
SET(CMAKE_CXX_FLAGS_DEBUG "$ENV{CXXFLAGS} -O0 -Wall -g -ggdb")
SET(CMAKE_CXX_FLAGS_RELEASE "$ENV{CXXFLAGS} -O3 -Wall")
1、查看core dump是否打開,如果返回0代表沒有打開,返回 unlimited 表示已經打開
ulimit -c
2、打開core dump
ulimit -c?unlimited
執行這行命令之后,只針對當前終端有效。
如果想對所有終端都有效則在 .bashrc 末尾添加這行代碼:
ulimit -c?unlimited
3、生成可執行文件,要加-g選項,以獲取到具體的行號信息,否則沒有
g++ -g -o main main.c
4、執行程序后生成core文件,core文件默認放在可執行文件相同目錄下,且文件名固定為core
./main
5、使用gdb調試core
gdb main core
6、查看程序堆棧信息
bt
)
)


)


_進階的開端)


)

)

