💫《博主主頁》:
? ? ? ? ? ?🔎?CSDN主頁
? ? ? ? ? ?🔎?IF Club社區主頁
🔥《擅長領域》:擅長阿里云AnalyticDB for MySQL(分布式數據倉庫)、Oracle、MySQL、Linux、prometheus監控;并對SQLserver、NoSQL(MongoDB)有了解
💖如果覺得文章對你有所幫助,歡迎點贊收藏加關注💖

? ? 今天這篇文章繼續給大家分享一下通過?Prometheus?來抓取 windows?系統的監控數據,并利用?Grafana?可視化平臺進行展示。同時,還將配置一些常見的 windows?系統告警項 ,進行實時監控和及時預警,幫助大家第一時間發現Linux潛在問題。
? ? ? ? ??
特別說明💥:
📌 開源儀表盤引用
- 本文采用的windows監控儀表盤直接使用了Grafana官網開源項目(Dashboard ID:?20763),非常感謝原作者的無私分享。關于Grafana的所有配置步驟均基于該開源儀表盤并驗證通過,各位可一鍵導入快速搭建專業級的可視化監控。
? ? ? ? ? ? ? ? ??
? 原創告警規則實現
關于告警部分為博主獨立開發完成,針對windows系統實現了如下告警:
??目錄使用過高警報
??CPU使用率過高告警
??服務器內存使用過高警報
??服務器下載帶寬使用過高警報
??服務器上傳帶寬使用過高警報
? ? ? ? ? ? ? ? ? ? ? ? ? ??
? ? ? ? ? ? ? ? ? ? ? ??
prometheus+Grafana全系列文章(實時更新 🔥 ):
【prometheus+Grafana篇】Prometheus與Grafana:深入了解監控架構與數據可視化分析平臺-CSDN博客
【prometheus+Grafana篇】從零開始:Linux 7.6 上二進制安裝 Prometheus、Grafana 和 Node Exporter_grafana二進制部署-CSDN博客
【prometheus+Grafana篇】Prometheus告警規則參數全解析 + Alertmanager實現多平臺告警(含電子郵件/企業微信群/飛書群/釘釘群接受方式)_告警消息對接企業微信、飛書、釘釘 步驟-CSDN博客
【prometheus+Grafana篇】基于Prometheus+Grafana實現Linux操作系統的監控與可視化-CSDN博客
【prometheus+Grafana篇】基于Prometheus+Grafana實現windows操作系統的監控與可視化-CSDN博客
? ? ? ? ? ? ? ? ?
目錄
一、安裝windows_exporter(windows_exporter:用于收集操作系統和硬件信息的metrics。windows_exporter插件是GitHub開源組織提供的,通過GitHub官網下載windows_exporter)
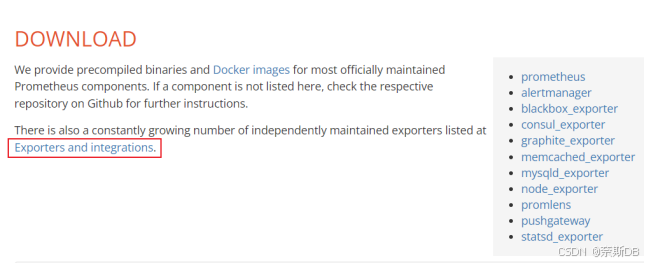
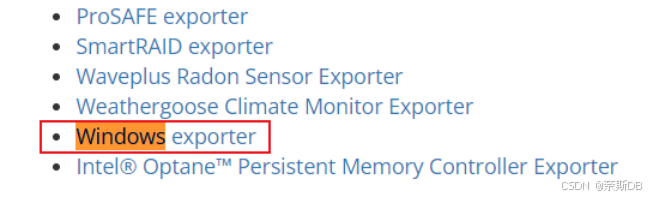
1)下載windows_exporter安裝包,選擇download,然后點擊“Exporters and integrations”,選擇windows exporter
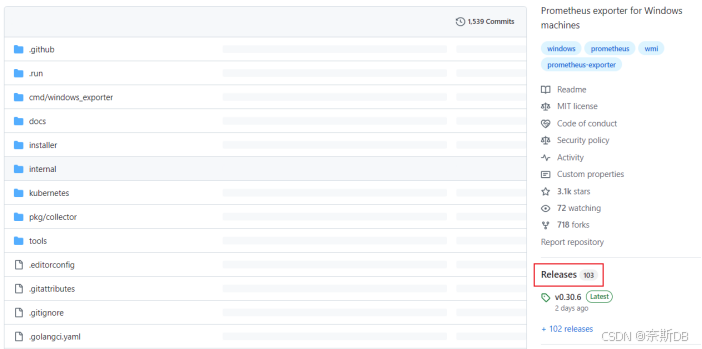
2)跳轉到了gitHub,點擊windows_exporter的版本集,選擇最新的windows_exporter下載
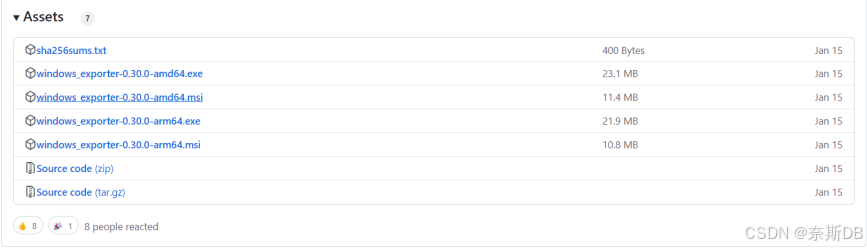
3)選擇v0.30.0版本下載
4)直接運行.msi文件windows_exporter包
5)查看Windows啟動服務項
6)登錄windows_exporter界面管理,默認端口為9182
二、將當前主機加入到prometheus監控,并通過Grafana展示
1)將windows_exporter的信息加入到prometheus監控的配置文件prometheus.yml中
2)配置告警規則文件
3)檢查配置文件
4)prometheus.yml文件添加了信息,所以重啟prometheus進程或者重新加載配置文件(二選一)
5)在prometheus查看是否可以看到監控信息
6)登錄Grafana界面管理,將當前主機的監控信息做展示
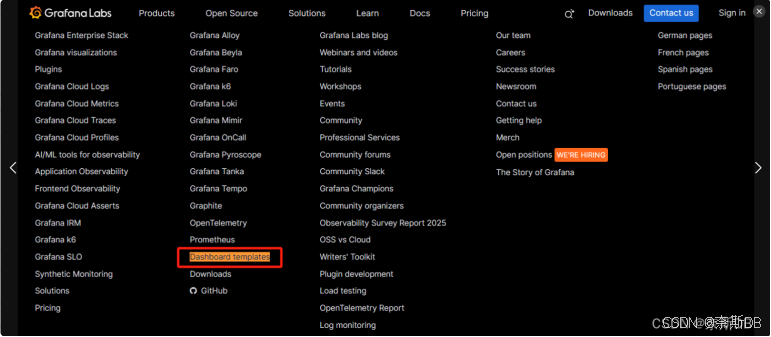
一、下載一個儀表盤:Grafana官網“http://www.grafana.com”—Dashboard templates,然后選擇一個下載量高的自己喜歡的windows_exporter(windows主機監控)
二、將儀表盤添加到Grafana上:Dashboards—New—Import—點擊“Upload dashboard JSON file”
三、儀表盤展示:Dashboards—查看到已經定義好的儀表盤,并且數據源是prometheus監控,點擊進去
? ? ? ? ? ? ? ? ? ? ? ?
監控windows信息如下:
| 主機名 | IP地址 | 配置 | 系統 | 描述 |
| Windows | 110.120.100.50 | 4C 8G | Windows server 2012 | 安裝windows_exporter對這臺服務器進行監控 |
windows_exporter:默認端口9182。用于收集操作系統和硬件信息的metrics
? ? ? ??
一、安裝windows_exporter(windows_exporter:用于收集操作系統和硬件信息的metrics。windows_exporter插件是GitHub開源組織提供的,通過GitHub官網下載windows_exporter)
1)下載windows_exporter安裝包,選擇download,然后點擊“Exporters and integrations”,選擇windows exporter
? ? ? ? ? ?
2)跳轉到了gitHub,點擊windows_exporter的版本集,選擇最新的windows_exporter下載
PS:也可以直接在gitHub官網下載
一、通過gitHub(官網地址:https://github.com/)下載windows_exporter安裝包,在gitHub搜索“windows_exporter”。
? ? ?
二、點擊windows_exporter的版本集,選擇最新的windows_exporter下載
? ? ? ? ?
3)選擇v0.30.0版本下載
架構:
amd64:也稱為 x86-64 或 x64,這是一種64位的處理器架構,由 AMD 公司推出。它是基于 x86 架構的64位擴展,現在廣泛用于桌面和服務器系統。
arm64:這是 ARMv8-A 的64位處理器架構,主要應用于 ARM 架構的64位處理器,包括用于服務器、移動設備和嵌入式系統的處理器。
? ? ? ?? ??
文件格式:
.exe:可執行文件。
.msi:Microsoft Installer Package。
? ? ? ? ??
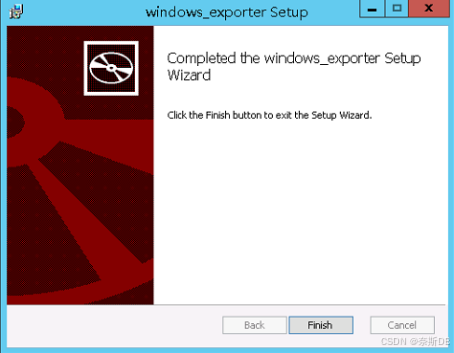
4)直接運行.msi文件windows_exporter包
windows_exporter-0.30.0-amd64.msi
? ?
? ? ? ??
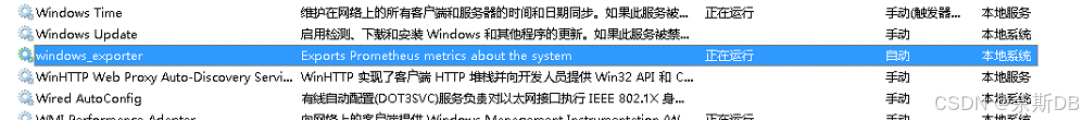
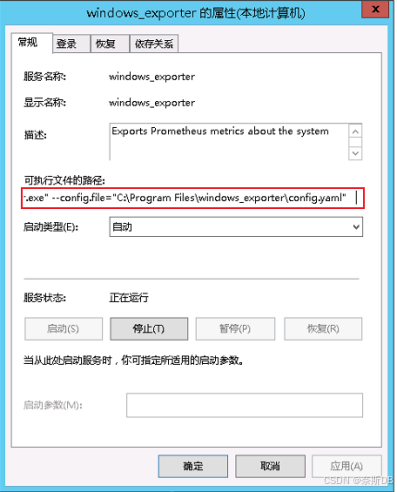
5)查看Windows啟動服務項
? ? 安裝好windows_exporter包后會自動在服務列表中添加一個windows_exporter,那么就可以通過在服務列表里面對windows_exporter進行啟動或者關閉
? ? ? ? ? ? ? ? ? ?
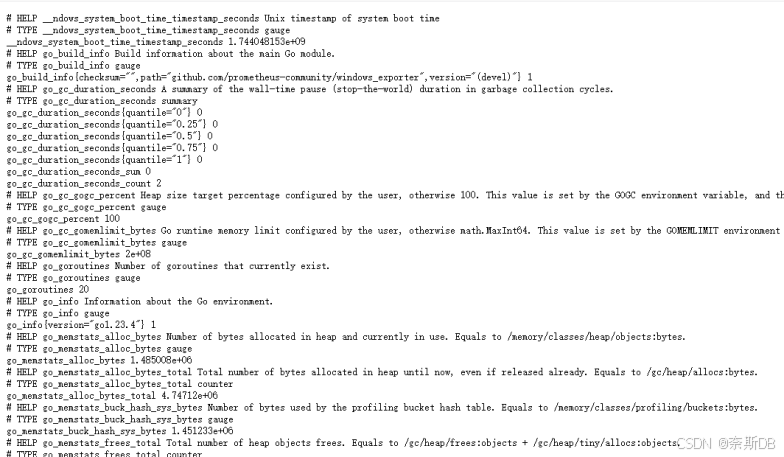
6)登錄windows_exporter界面管理,默認端口為9182
http://110.120.100.50:9182/metrics

? ? ? ? ? ? ??
二、將當前主機加入到prometheus監控,并通過Grafana展示
注意:如下操作是在安裝了prometheus和Grafana的主機上進行操作,安裝直通車👉【prometheus+Grafana篇】從零開始:Linux 7.6 上二進制安裝 Prometheus、Grafana 和 Node Exporter_grafana二進制部署-CSDN博客👈
? ? ? ? ? ? ?
1)將windows_exporter的信息加入到prometheus監控的配置文件prometheus.yml中
[root@prometheus ~]# vi /opt/prometheus/prometheus.yml
在scrape_configs下面新增如下內容:# windows_exporter配置            ###job_name 用來唯一標識一個監控任務。在同一個 prometheus.yml 文件中,不同的 scrape_config可以有不同的job_name,以便 Prometheus 能夠區分和管理不同的監控目標和配置,用來將不同的監控目標分組。單位為監控Windows設置一個獨立的job_name- job_name: "windows_exporter"scrape_interval: 15s            ###指定這個job_name每隔多久從每個目標(如 Exporter、應用端點)拉取一次指標數據。優先級:會覆蓋全局的 global:scrape_interval(如果存在)。file_sd_configs:- files:- /opt/prometheus/conf.d/windows_targets.json     #### Windows需要監控的機器都單獨寫在了windows_targets.json文件中,是為了避免prometheus.yml內容過多,看起來更簡潔[root@prometheus ~]# vi /data/prometheus/conf.d/windows_targets.json     ###寫成linux或者MySQL通用的targets、labels的話,Prometheus可以獲取到數據,但grafna獲取不到數據。如下是deepseek推薦的寫法,因為使用的20763 json模版沒有告訴怎么定義格式
[{"targets": [ "110.120.100.50:9182" ],"labels": { "instance": "110.120.100.50:9182","hostname": "Windows服務器(IP:110.120.100.50)","ip": "110.120.100.50"}}
]
? ? ? ? ? ? ? ?
2)配置告警規則文件
? ? 除了如下告警規則之外,還需要單獨配置一個Targets目標不可達(up)的相關規則,因為up 是一個布爾值指標,表示 Prometheus 是否能夠成功地 scrape(抓取)到指定的目標(targets)數據,用于判斷目標node-exporter相關進程是否在目標主機存活。關于up的規則文件參考:【prometheus+Grafana篇】從零開始:Linux 7.6 上二進制安裝 Prometheus、Grafana 和 Node Exporter_grafana二進制部署-CSDN博客
[root@prometheus ~]# cd /opt/prometheus/rules/    ###在prometheus.yml文件中定義了告警規則文件rule_files參數
[root@prometheus rules]# vi windows_alerts.ymlgroups:- name: windows_alertsrules:# 磁盤相關告警- alert: HighDiskUsageexpr: 100 - (windows_logical_disk_free_bytes / windows_logical_disk_size_bytes) * 100 > 90for: 3slabels:severity: criticalannotations:summary: "目錄使用過高警報"description: "當前實例 {{ $labels.hostname }} 的 {{ $labels.volume }} 盤使用率已達到 {{ $value | printf \"%.2f\" }}%,超過90%。請檢查磁盤目錄使用情況!"# CPU相關告警- alert: HighCPUUsageexpr: 100 - (avg by (hostname) (irate(windows_cpu_time_total{mode="idle"}[3m])) * 100) > 90for: 3mlabels:severity: criticalannotations:summary: "CPU使用率過高告警"description: "實例 {{ $labels.hostname }} 的CPU使用率(基于3分鐘內最后兩個數據點計算的瞬時增長率)已持續3分鐘超過90%,當前值為 {{ $value | printf \"%.2f\" }}%。請檢查服務器CPU使用情況!"# 內存相關告警- alert: HighMemoryUsageexpr: 100 - ((windows_os_physical_memory_free_bytes / windows_cs_physical_memory_bytes) * 100) > 90for: 3slabels:severity: criticalannotations:summary: "服務器內存使用過高警報"description: "當前實例 {{ $labels.hostname }} 的服務器內存使用率已達到 {{ $value | printf \"%.2f\" }}%,超過90%。請檢查服務器內存使用情況!"- alert: HighNetworkReceiveUsageexpr: rate(windows_net_bytes_received_total[10m]) * 8 / 1000000 > 500   # 500 Mbpsfor: 10mlabels:severity: criticalannotations:summary: "服務器下載帶寬使用過高警報"description: "當前實例 {{ $labels.hostname }} 的 {{ $labels.nic }} 網卡(基于10分鐘內所有數據點計算的平均增長率)每秒平均下載帶寬已持續10分鐘超過500 Mbps(62.5 MB/s),當前每秒平均下載帶寬為 {{ $value | printf \"%.2f\" }} Mbps。請檢查網絡流量和帶寬使用情況!"- alert: HighNetworkTransmitUsageexpr: rate(windows_net_bytes_sent_total[10m]) * 8 / 1000000 > 500   # 500 Mbpsfor: 10mlabels:severity: criticalannotations:summary: "服務器上傳帶寬使用過高警報"description: "當前實例 {{ $labels.hostname }} 的 {{ $labels.nic }} 網卡(基于10分鐘內所有數據點計算的平均增長率)每秒平均上傳帶寬已持續10分鐘超過500 Mbps(62.5 MB/s),當前每秒平均上傳帶寬 {{ $value | printf \"%.2f\" }} Mbps。請檢查網絡流量和帶寬使用情況!"
? ? ? ??
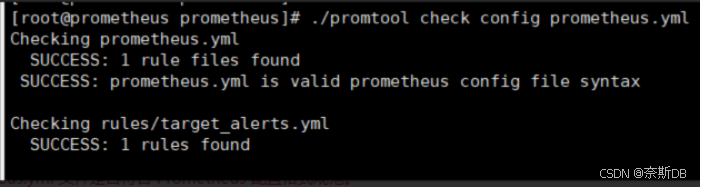
3)檢查配置文件
[root@prometheus ~]# cd /opt/prometheus/
[root@prometheus ~]# ./promtool check config prometheus.yml      ###用于檢查 Prometheus 配置文件(prometheus.yml)的語法和格式是否正確。
執行這條命令會執行以下操作:
- 驗證配置文件的語法:檢查 prometheus.yml 文件是否符合 Prometheus 配置格式規范。
- 檢測潛在的錯誤或警告:如果配置文件中存在拼寫錯誤、格式問題、無效的配置項等問題,它會提供相關的錯誤信息或警告。比如告警規則寫的不對,就會有提示
- 輸出有用的診斷信息:如果配置文件存在問題,promtool 會輸出詳細的錯誤信息。
? ? ? ??
4)prometheus.yml文件添加了信息,所以重啟prometheus進程或者重新加載配置文件(二選一)
#重載:前提是在prometheus.service啟動服務項中加了--web.enable-lifecycle參數:--web.enable-lifecycle:###啟用Prometheus的生命周期接口,允許通過HTTP請求來動態重新加載配置等操作。這對于在運行時更新配置或執行其他管理操作非常有用,當修改了prometheus的配置后,可以通過curl命令來重新加載配置文件,而不需要重啟prometheus(推薦方式)
[root@prometheus ~]# curl -X POST http://localhost:9090/-/reload? ? ? ? ??
#重啟
[root@prometheus ~]# systemctl restart prometheus.service? ? ? ??? ? ??
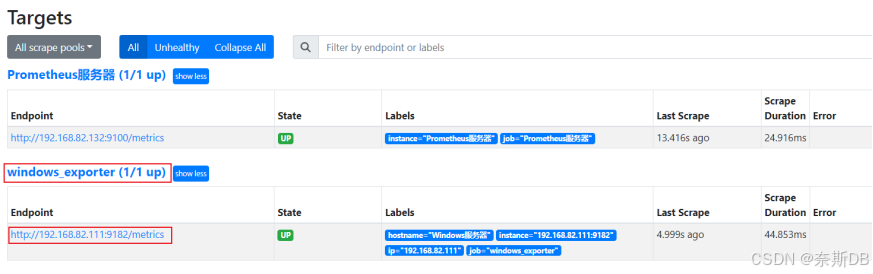
5)在prometheus查看是否可以看到監控信息
網址:http://110.120.100.21:9090
菜單欄:Status—Targets
? ? ? ? ? ??
6)登錄Grafana界面管理,將當前主機的監控信息做展示
地址:http://110.120.100.21:3000
默認用戶:admin
默認密碼:admin
? ? ? ? ? ?
一、下載一個儀表盤:Grafana官網“http://www.grafana.com”—Dashboard templates,然后選擇一個下載量高的自己喜歡的windows_exporter(windows主機監控)
注意:不需要再增加數據源了。因為在第一次搭建prometheus+Grafana的時候就已經加好了,在添加數據源時,有個配置項是Connection,這里添加的是prometheus的地址,指的是prometheus監控服務器的地址,而不是windows_exporter的地址
? ? ??
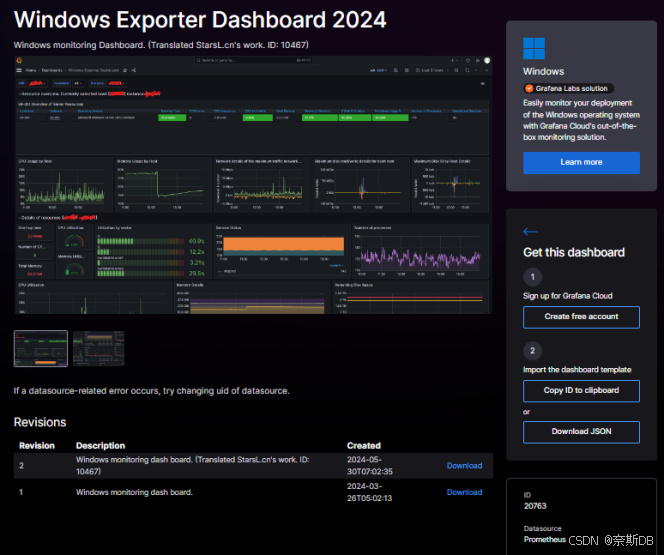
以20763為例(Windows Exporter Dashboard 2024),新增了多個指標,比較全面
? ? ? ? ? ? ? ?
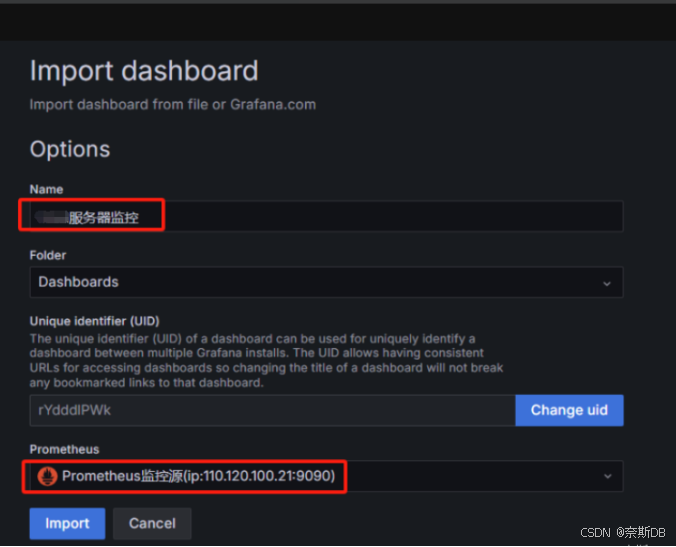
二、將儀表盤添加到Grafana上:Dashboards—New—Import—點擊“Upload dashboard JSON file”
Name:定義名稱,最好定義為主機ip加用途
Prometheus:選擇prometheus源,Prometheus監控源(ip:110.120.100.21:9090)
....
然后import
? ? ? ??
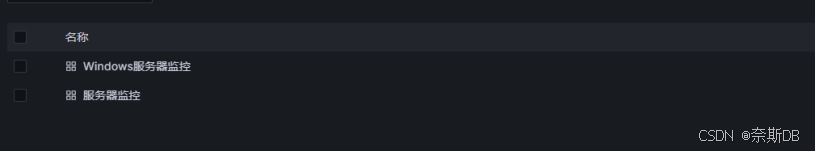
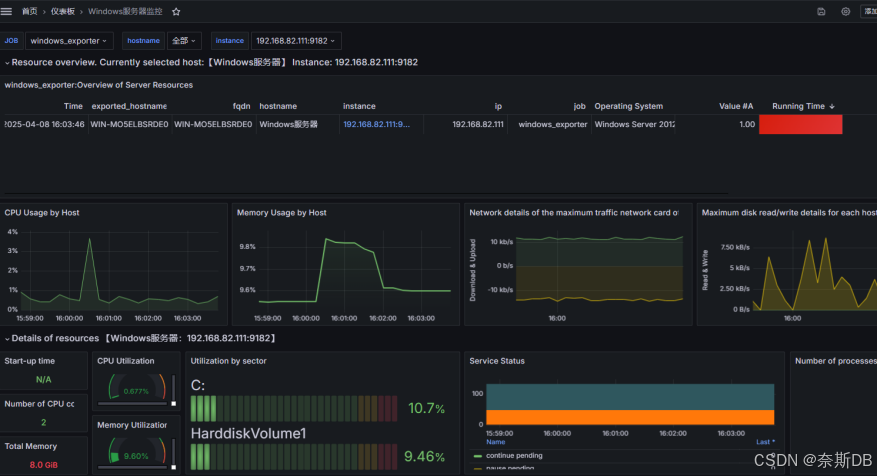
三、儀表盤展示:Dashboards—查看到已經定義好的儀表盤,并且數據源是prometheus監控,點擊進去
儀表盤Name:linux服務器監控
數據源Name:prometheus監控,Prometheus監控源(ip:110.120.100.21:9090)
Datasource:選擇在添加數據源時,已經定義好的“Prometheus監控源(ip:110.120.100.21:9090)”
Job:這里其實就是當時已經在配置prometheus.yml時,定義的job_name,也就是說Grafana會自動識別到
Host:這里其實就是當時已經在配置prometheus.yml時,定義的instance,也就是說Grafana會自動識別到
? ? 關于基于Prometheus+Grafana的windows系統監控與可視化的內容到這里就結束了,完結,撒花


:live555創建RTSP服務器源碼剖析,創建h264文件rtsp服務器源碼深度剖析)


——從應用到設計)
![洛谷 P1955 [NOI2015] 程序自動分析](http://pic.xiahunao.cn/洛谷 P1955 [NOI2015] 程序自動分析)
![[Java] 輸入輸出方法+猜數字游戲](http://pic.xiahunao.cn/[Java] 輸入輸出方法+猜數字游戲)
)


