一、技術介紹
Prometheus、Grafana及K8S服務發現詳解
Prometheus簡介
Prometheus是一個開源的監控系統和時間序列數據庫,最初由SoundCloud開發,現已成為CNCF(云原生計算基金會)的畢業項目?。它專注于實時監控和告警,特別適合云原生和分布式系統的監控?。
Prometheus的核心功能
數據采集?:通過Pull模型定期從目標服務拉取指標數據,支持HTTP端點、Pushgateway(用于短期任務)等多種采集方式?
數據存儲?:使用高效的時間序列數據庫(TSDB)存儲指標數據,支持數據壓縮和持久化?
查詢語言?:提供強大的PromQL查詢語言,用于分析和聚合時間序列數據?
告警功能?:支持基于PromQL的告警規則配置,告警信息可發送到Alertmanager進行分組、去重和路由?
多維度數據模型?:數據以鍵值對形式存儲,支持多維度標簽(Labels),便于靈活查詢和聚合?
Prometheus的架構特點
采用HTTP協議周期性抓取被監控組件的狀態,任何提供HTTP接口的組件都可以接入?
不依賴分布式存儲,單個服務器節點可直接工作?
支持服務發現或靜態配置發現目標?
適用于以機器為中心的監控以及高度動態面向服務架構的監控?
Grafana簡介
Grafana是一個開源的分析和可視化平臺,允許用戶從各種后端源(包括Prometheus)可視化數據?。它提供了動態且交互式的儀表板,用于展示監控數據?。
Grafana的核心特性
可自定義儀表板?:創建視覺豐富、互動性強的儀表板?
數據源靈活性?:支持廣泛的數據來源,包括Prometheus、Elasticsearch和InfluxDB等?
警報和通知?:根據可視化指標定義和觸發警報?
查詢構建器?:簡化對支持的后端查詢的創建過程?
通用性?:不僅適用于展示Prometheus數據,也適用于其他數據可視化需求?
Prometheus與Grafana在K8S中的協同
在Kubernetes(K8S)環境中,Prometheus和Grafana是兩個非常流行的開源工具組合?:
Prometheus負責收集K8S集群和容器化應用的指標數據?
Grafana負責展示這些數據,通過儀表盤直觀呈現系統運行狀況?
這種組合為開發者和運維人員提供了強大而靈活的監控解決方案?
基于K8S的服務發現作用
在Kubernetes環境中,基于服務發現的功能對Prometheus監控至關重要:
自動發現監控目標?:Prometheus可以自動發現K8S集群中的Pod、Service等資源作為監控目標?
動態適應環境變化?:當K8S集群中的服務擴縮容或更新時,服務發現機制能自動更新監控目標列表?
簡化配置管理?:無需手動維護監控目標列表,減少配置工作量?
支持多集群監控?:通過服務發現機制,Prometheus可以監控多個K8S集群?
Prometheus通過定期從靜態配置的監控目標或基于服務發現自動配置的目標中拉取數據,新拉取到的數據會先存儲在內存緩存區,當數據量超過配置閾值時,就會持久化到存儲設備中?。
二、實戰部署node-exporter
[root@node1 ~]# ctr -n k8s.io images import node-exporter.tar.gz
unpacking docker.io/prom/node-exporter:v0.16.0 (sha256:efc8140e40b5c940d67056cb56d720ed66965eabe03865ab1595705f4f847009)...done
[root@master ~]# kubectl create ns monitor-sa
namespace/monitor-sa created
[root@master ~]# kubectl get ns
NAME????????????? STATUS?? AGE
default?????????? Active?? 27m
kube-node-lease?? Active?? 27m
kube-public?????? Active?? 27m
kube-system?????? Active?? 27m
monitor-sa??????? Active?? 4s
[root@master prometheus]# cat node-export.yaml
apiVersion: apps/v1
kind: DaemonSet
metadata:
? name: node-exporter
? namespace: monitor-sa
? labels:
??? name: node-exporter
spec:
? selector:
??? matchLabels:
???? name: node-exporter
? template:
??? metadata:
????? labels:
??????? name: node-exporter
??? spec:
????? hostPID: true
????? hostIPC: true
????? hostNetwork: true
????? containers:
????? - name: node-exporter
??????? image: prom/node-exporter:v0.16.0
??????? imagePullPolicy: IfNotPresent
??????? ports:
??????? - containerPort: 9100
??????? resources:
????????? requests:
??????????? cpu: 0.15
??????? securityContext:
????????? privileged: true
??????? args:
??????? - --path.procfs
??????? - /host/proc
??????? - --path.sysfs
??????? - /host/sys
??????? - --collector.filesystem.ignored-mount-points
??????? - '"^/(sys|proc|dev|host|etc)($|/)"'
??????? volumeMounts:
??????? - name: dev
????????? mountPath: /host/dev
??????? - name: proc
????????? mountPath: /host/proc
??????? - name: sys
????????? mountPath: /host/sys
??????? - name: rootfs
????????? mountPath: /rootfs
????? tolerations:
????? - key: "node-role.kubernetes.io/control-plane"
??????? operator: "Exists"
??????? effect: "NoSchedule"
????? volumes:
??????? - name: proc
????????? hostPath:
??????????? path: /proc
??????? - name: dev
????????? hostPath:
??????????? path: /dev
??????? - name: sys
????????? hostPath:
??????????? path: /sys
??????? - name: rootfs
????????? hostPath:
??????????? path: /
[root@master prometheus]# kubectl get pods -n monitor-sa
NAME????????????????? READY?? STATUS??? RESTARTS?? AGE
node-exporter-gwvcf?? 1/1???? Running?? 0????????? 3m9s
node-exporter-wzck7?? 1/1???? Running?? 0????????? 4m24s
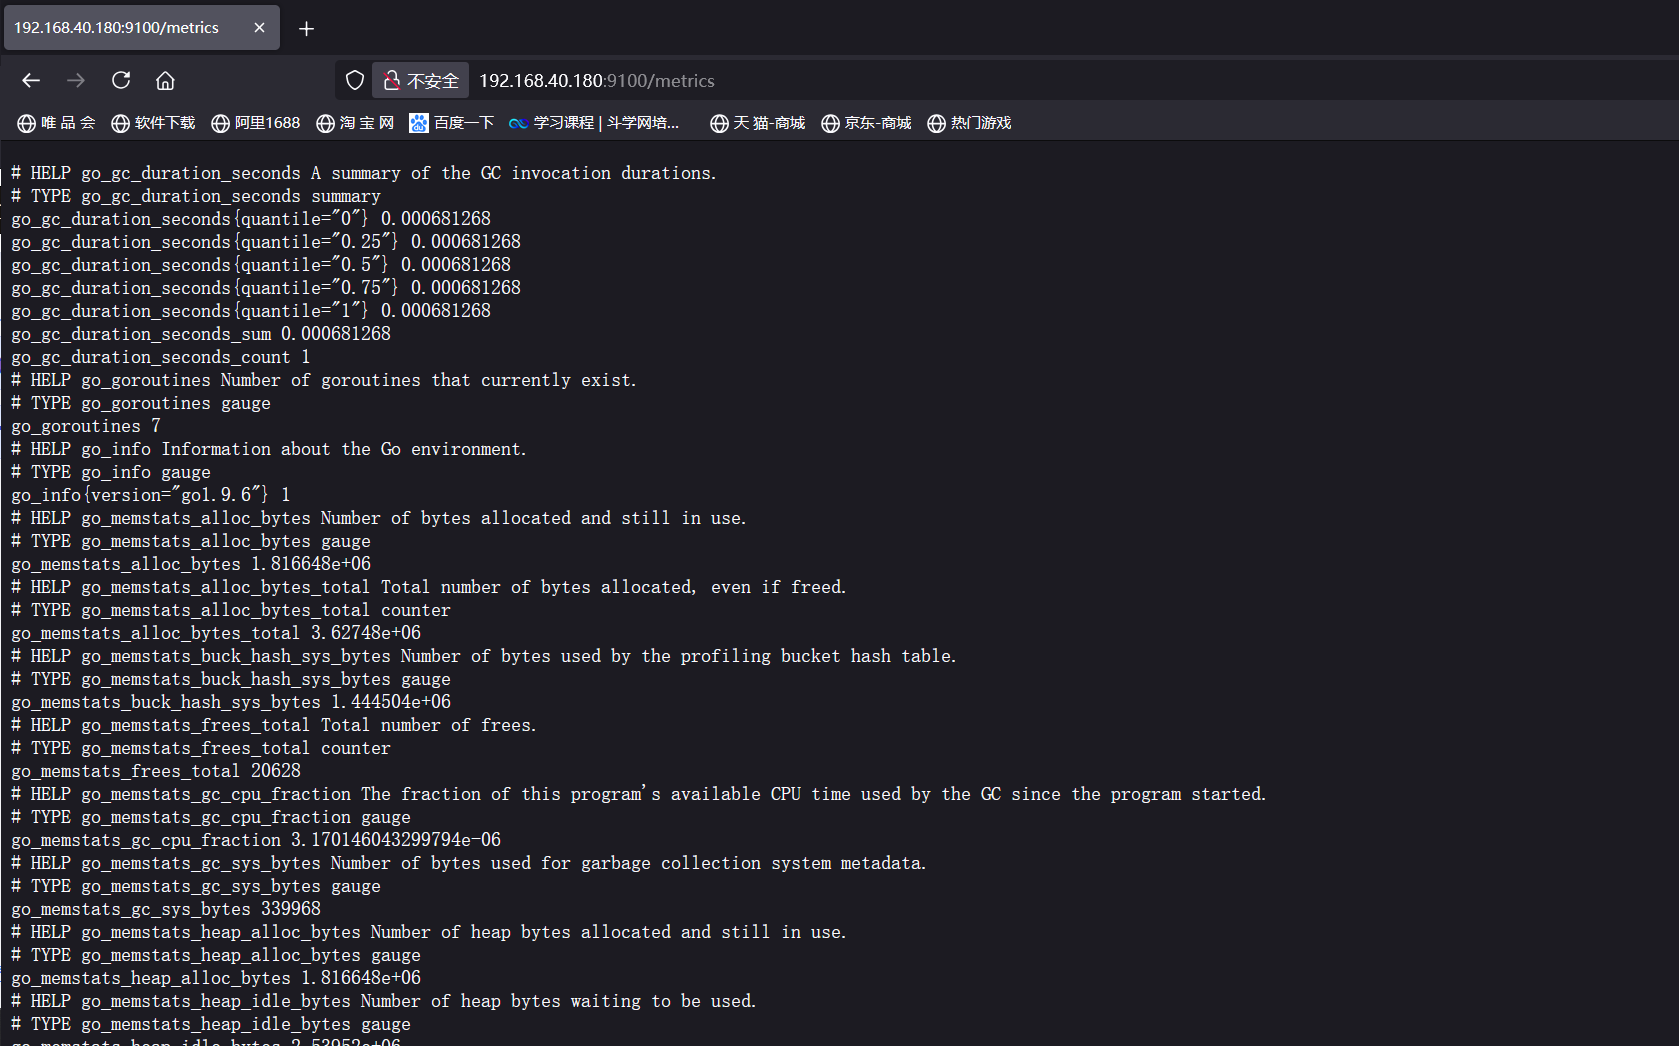
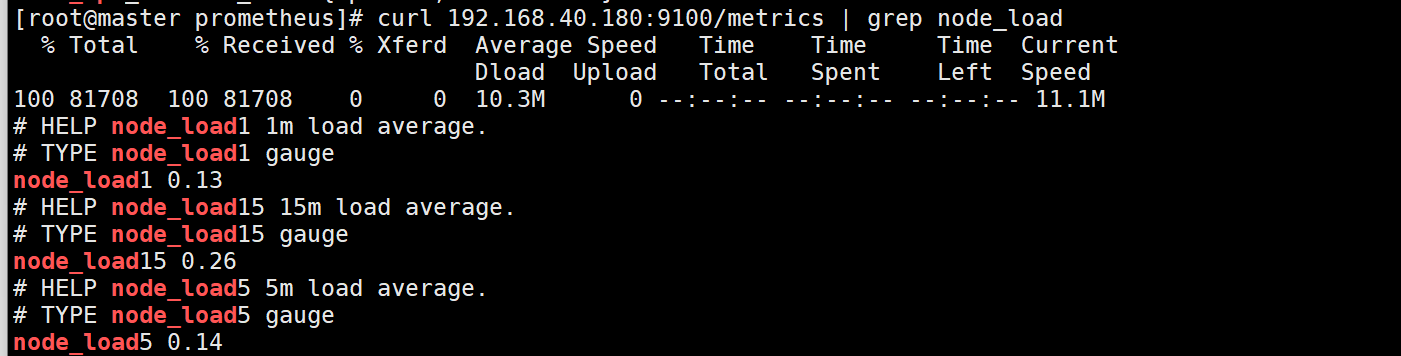
[root@master prometheus]# curl 192.168.40.180:9100/metrics | grep node_load
? % Total??? % Received % Xferd? Average Speed?? Time??? Time???? Time? Current
???????????????????????????????? Dload? Upload?? Total?? Spent??? Left? Speed
100 81708? 100 81708??? 0???? 0? 10.3M????? 0 --:--:-- --:--:-- --:--:-- 11.1M
# HELP node_load1 1m load average.
# TYPE node_load1 gauge
node_load1 0.13
# HELP node_load15 15m load average.
# TYPE node_load15 gauge
node_load15 0.26
# HELP node_load5 5m load average.
# TYPE node_load5 gauge
node_load5 0.14
Kubernetes 中部署 Node Exporter 的詳細解釋
操作流程概述
這段代碼展示了在 Kubernetes 集群中部署 Prometheus Node Exporter 的完整過程,主要包括以下幾個步驟:
導入 Node Exporter 鏡像到容器運行時
創建監控專用的命名空間
部署 Node Exporter 的 DaemonSet
驗證 Pod 運行狀態
詳細解釋
1. 導入 Node Exporter 鏡像
bash
Copy Code
ctr -n k8s.io images import node-exporter.tar.gz
unpacking docker.io/prom/node-exporter:v0.16.0...done
ctr 是 containerd 容器運行時的命令行工具
-n k8s.io 指定了命名空間為 k8s.io(Kubernetes 使用的命名空間)
從 node-exporter.tar.gz 文件中導入鏡像
解壓并加載了 prom/node-exporter:v0.16.0 鏡像
2. 創建監控命名空間
bash
Copy Code
kubectl create ns monitor-sa
kubectl get ns
創建了一個名為 monitor-sa 的命名空間
列出所有命名空間確認創建成功
命名空間用于隔離監控相關的資源
3. Node Exporter DaemonSet 配置
yaml
Copy Code
apiVersion: apps/v1
kind: DaemonSet
metadata:
? name: node-exporter
? namespace: monitor-sa
? labels:
??? name: node-exporter
定義了一個 DaemonSet 資源(確保每個節點運行一個 Pod 副本)
部署在 monitor-sa 命名空間
設置了 name: node-exporter 標簽
yaml
Copy Code
spec:
? selector:
??? matchLabels:
????? name: node-exporter
? template:
??? metadata:
????? labels:
??????? name: node-exporter
使用標簽選擇器匹配 Pod
Pod 模板中也設置了相同的標簽
yaml
Copy Code
spec:
? hostPID: true
? hostIPC: true
? hostNetwork: true
hostPID: true - 使用主機 PID 命名空間,可以查看主機進程
hostIPC: true - 使用主機 IPC 命名空間
hostNetwork: true - 使用主機網絡棧,直接暴露主機網絡信息
yaml
Copy Code
containers:
- name: node-exporter
? image: prom/node-exporter:v0.16.0
? imagePullPolicy: IfNotPresent
? ports:
? - containerPort: 9100
使用 prom/node-exporter:v0.16.0 鏡像
IfNotPresent 拉取策略表示本地有鏡像就不從倉庫拉取
暴露 9100 端口(Node Exporter 默認端口)
yaml
Copy Code
resources:
? requests:
??? cpu: 0.15
securityContext:
? privileged: true
請求 0.15 個 CPU 核心
以特權模式運行(需要訪問主機系統信息)
yaml
Copy Code
args:
- --path.procfs
- /host/proc
- --path.sysfs
- /host/sys
- --collector.filesystem.ignored-mount-points
- '"^/(sys|proc|dev|host|etc)($|/)"'
指定 procfs 和 sysfs 的掛載路徑
忽略特定掛載點的文件系統統計信息
yaml
Copy Code
volumeMounts:
- name: dev
? mountPath: /host/dev
- name: proc
? mountPath: /host/proc
- name: sys
? mountPath: /host/sys
- name: rootfs
? mountPath: /rootfs
掛載主機的 /dev、/proc、/sys 和 / 到容器內
使 Node Exporter 能訪問主機系統信息
yaml
Copy Code
tolerations:
- key: "node-role.kubernetes.io/control-plane"
? operator: "Exists"
? effect: "NoSchedule"
容忍控制平面節點的污點
確保 Node Exporter 也能在 master/control-plane 節點上運行
yaml
Copy Code
volumes:
- name: proc
? hostPath:
??? path: /proc
- name: dev
? hostPath:
??? path: /dev
- name: sys
? hostPath:
??? path: /sys
- name: rootfs
? hostPath:
??? path: /
定義主機路徑卷,映射主機系統目錄到容器
4. 驗證 Pod 運行狀態
bash
Copy Code
kubectl get pods -n monitor-sa
NAME??????????????????? READY?? STATUS??? RESTARTS?? AGE
node-exporter-gwvcf???? 1/1???? Running?? 0????????? 3m9s
node-exporter-wzck7???? 1/1???? Running?? 0????????? 4m24s
列出 monitor-sa 命名空間中的 Pod
顯示兩個 Node Exporter Pod 正常運行(假設集群有兩個節點)
每個節點一個 Pod(DaemonSet 的特性)
總結
這段配置實現了:
在每個 Kubernetes 節點(包括控制平面節點)上部署一個 Node Exporter
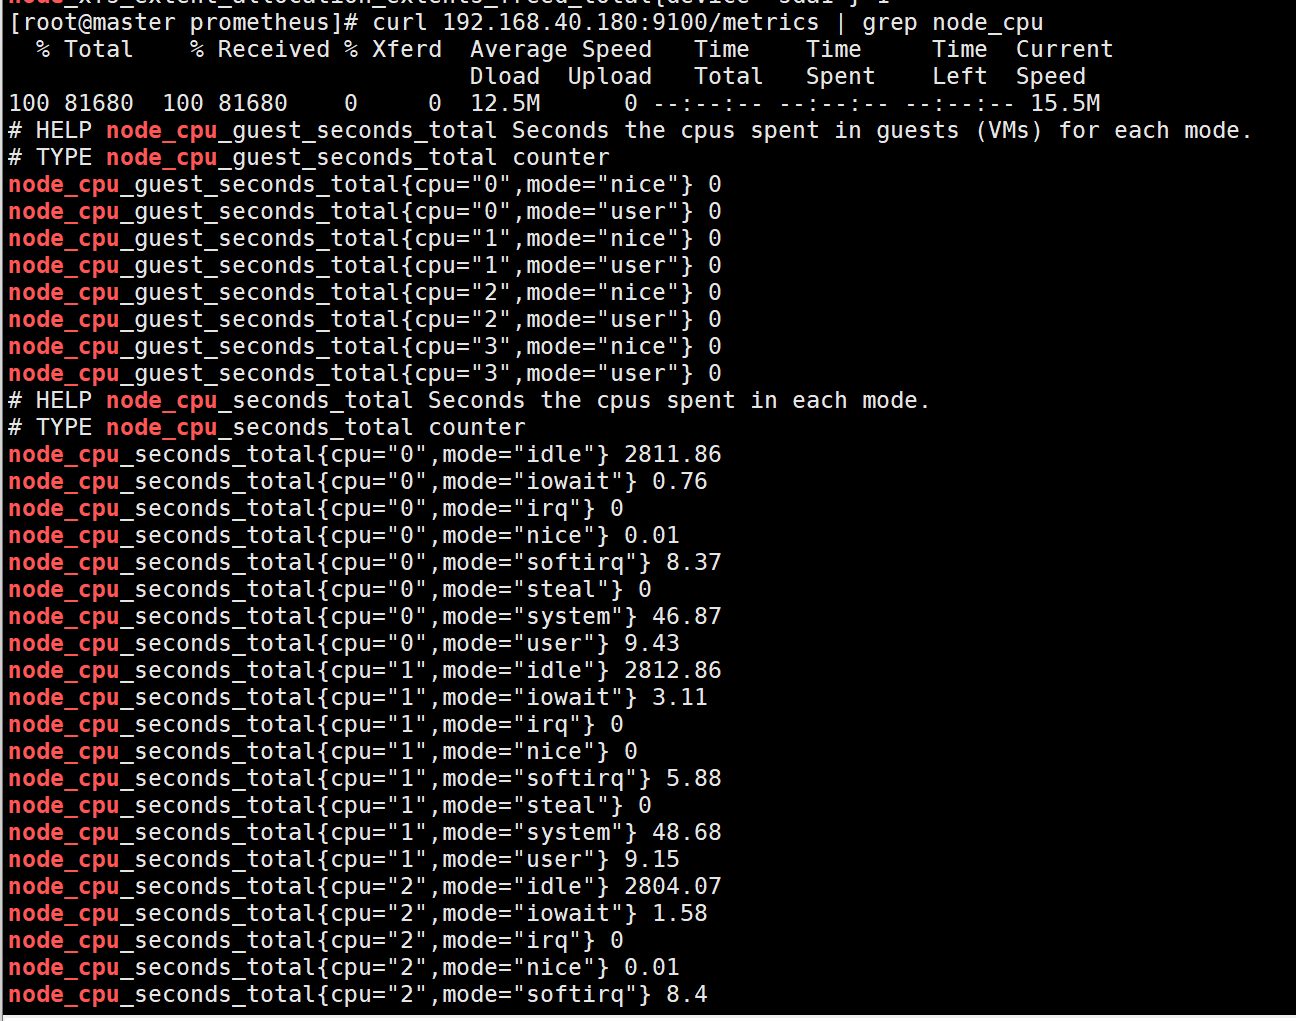
Node Exporter 可以收集主機級別的監控指標(CPU、內存、磁盤、網絡等)
通過 9100 端口暴露指標,供 Prometheus 抓取
使用適當的權限和掛載訪問主機系統信息
這種部署方式是 Kubernetes 監控的常見模式,為集群提供了基礎的主機級監控能力
三、實戰部署Prometheus
?
[root@master prometheus]# kubectl create sa monitor -n monitor-sa
[root@master prometheus]# kubectl create clusterrolebinding monitor-binding --clusterrole=cluster-admin --serviceaccount=monitor-sa:monitor -n monitor-sa
[root@master prometheus]# kubectl create clusterrolebinding monitor-binding-2 --clusterrole=cluster-admin --user=system:serviceaccount:monitor:monitor-sa? -n monitor-sa
[root@node1 ~]# mkdir -p /data
[root@node1 ~]# chmod -R 777 /data/
[root@node1 ~]# ls -ld /data/
drwxrwxrwx 2 root root 6 Mar 13 03:44 /data/
[root@master prometheus]# kubectl apply -f prometheus-cfg.yaml
configmap/prometheus-config created
[root@master prometheus]# cat prometheus-cfg.yaml
---
kind: ConfigMap
apiVersion: v1
metadata:
? labels:
??? app: prometheus
? name: prometheus-config
? namespace: monitor-sa
data:
? prometheus.yml: |
??? global:
????? scrape_interval: 15s
????? scrape_timeout: 10s
????? evaluation_interval: 1m
??? scrape_configs:
??? - job_name: 'kubernetes-node'
????? kubernetes_sd_configs:
????? - role: node
????? relabel_configs:
????? - source_labels: [__address__]
??????? regex: '(.*):10250'
??????? replacement: '${1}:9100'
??????? target_label: __address__
??????? action: replace
????? - action: labelmap
??????? regex: __meta_kubernetes_node_label_(.+)
??? - job_name: 'kubernetes-node-cadvisor'
????? kubernetes_sd_configs:
????? - role:? node
????? scheme: https
????? tls_config:
??????? ca_file: /var/run/secrets/kubernetes.io/serviceaccount/ca.crt
????? bearer_token_file: /var/run/secrets/kubernetes.io/serviceaccount/token
????? relabel_configs:
????? - action: labelmap
??????? regex: __meta_kubernetes_node_label_(.+)
????? - target_label: __address__
??????? replacement: kubernetes.default.svc:443
????? - source_labels: [__meta_kubernetes_node_name]
??????? regex: (.+)
??????? target_label: __metrics_path__
??????? replacement: /api/v1/nodes/${1}/proxy/metrics/cadvisor
??? - job_name: 'kubernetes-apiserver'
????? kubernetes_sd_configs:
????? - role: endpoints
????? scheme: https
????? tls_config:
??????? ca_file: /var/run/secrets/kubernetes.io/serviceaccount/ca.crt
????? bearer_token_file: /var/run/secrets/kubernetes.io/serviceaccount/token
????? relabel_configs:
????? - source_labels: [__meta_kubernetes_namespace, __meta_kubernetes_service_name, __meta_kubernetes_endpoint_port_name]
??????? action: keep
??????? regex: default;kubernetes;https
??? - job_name: 'kubernetes-service-endpoints'
????? kubernetes_sd_configs:
????? - role: endpoints
????? relabel_configs:
????? - source_labels: [__meta_kubernetes_service_annotation_prometheus_io_scrape]
??????? action: keep
??????? regex: true
????? - source_labels: [__meta_kubernetes_service_annotation_prometheus_io_scheme]
??????? action: replace
??????? target_label: __scheme__
??????? regex: (https?)
????? - source_labels: [__meta_kubernetes_service_annotation_prometheus_io_path]
??????? action: replace
??????? target_label: __metrics_path__
??????? regex: (.+)
????? - source_labels: [__address__, __meta_kubernetes_service_annotation_prometheus_io_port]
??????? action: replace
??????? target_label: __address__
??????? regex: ([^:]+)(?::\d+)?;(\d+)
??????? replacement: $1:$2
????? - action: labelmap
??????? regex: __meta_kubernetes_service_label_(.+)
????? - source_labels: [__meta_kubernetes_namespace]
??????? action: replace
??????? target_label: kubernetes_namespace
????? - source_labels: [__meta_kubernetes_service_name]
??????? action: replace
??????? target_label: kubernetes_name
[root@master prometheus]# cat prometheus-deploy.yaml
---
apiVersion: apps/v1
kind: Deployment
metadata:
? name: prometheus-server
? namespace: monitor-sa
? labels:
??? app: prometheus
spec:
? replicas: 1
? selector:
??? matchLabels:
????? app: prometheus
????? component: server
??? #matchExpressions:
??? #- {key: app, operator: In, values: [prometheus]}
??? #- {key: component, operator: In, values: [server]}
? template:
??? metadata:
????? labels:
??????? app: prometheus
??????? component: server
????? annotations:
??????? prometheus.io/scrape: 'false'
??? spec:
????? nodeName: node1
????? serviceAccountName: monitor
????? containers:
????? - name: prometheus
??????? image: prom/prometheus:v2.33.5
??????? imagePullPolicy: IfNotPresent
??????? command:
????????? - prometheus
????????? - --config.file=/etc/prometheus/prometheus.yml
????????? - --storage.tsdb.path=/prometheus
????????? - --storage.tsdb.retention=720h
????????? - --web.enable-lifecycle
??????? ports:
??????? - containerPort: 9090
????????? protocol: TCP
??????? volumeMounts:
??????? - mountPath: /etc/prometheus
????????? name: prometheus-config
??????? - mountPath: /prometheus/
????????? name: prometheus-storage-volume
????? volumes:
??????? - name: prometheus-config
????????? configMap:
??????????? name: prometheus-config
??????? - name: prometheus-storage-volume
????????? hostPath:
?????????? path: /data
?????????? type: Directory
[root@master prometheus]# cat prometheus-svc.yaml
apiVersion: v1
kind: Service
metadata:
? name: prometheus
? namespace: monitor-sa
? labels:
??? app: prometheus
spec:
? type: NodePort
? ports:
??? - port: 9090
????? targetPort: 9090
????? protocol: TCP
? selector:
??? app: prometheus
??? component: server
[root@master prometheus]# kubectl get svc -n monitor-sa
NAME???????? TYPE?????? CLUSTER-IP?????? EXTERNAL-IP?? PORT(S)????????? AGE
prometheus?? NodePort?? 10.106.100.212?? <none>??????? 9090:31197/TCP?? 2m28s
Kubernetes 中部署 Prometheus 監控系統的詳細解釋
1. 創建服務賬號和權限綁定
bash
Copy Code
# 創建服務賬號
kubectl create sa monitor -n monitor-sa
# 綁定集群管理員角色到服務賬號
kubectl create clusterrolebinding monitor-binding --clusterrole=cluster-admin --serviceaccount=monitor-sa:monitor -n monitor-sa
# 第二個權限綁定(可能有誤,serviceaccount和namespace不匹配)
kubectl create clusterrolebinding monitor-binding-2 --clusterrole=cluster-admin --user=system:serviceaccount:monitor:monitor-sa -n monitor-sa
這部分代碼創建了一個服務賬號(ServiceAccount)并賦予其集群管理員權限:
monitor 服務賬號將被Prometheus使用來訪問Kubernetes API
授予了cluster-admin角色,使Prometheus能夠訪問所有資源(生產環境應考慮更細粒度的權限)
2. 準備存儲目錄
bash
Copy Code
mkdir -p /data
chmod -R 777 /data/
在節點上創建了/data目錄并設置權限,這將作為Prometheus的持久化存儲位置。
3. Prometheus配置(ConfigMap)
prometheus-cfg.yaml定義了一個ConfigMap,包含Prometheus的主配置文件:
yaml
Copy Code
global:
? scrape_interval: 15s? # 抓取間隔
? scrape_timeout: 10s?? # 抓取超時
? evaluation_interval: 1m? # 規則評估間隔
scrape_configs:
? # 監控Kubernetes節點
? - job_name: 'kubernetes-node'
??? kubernetes_sd_configs: [{role: node}]
??? relabel_configs:
????? - source_labels: [__address__]
??????? regex: '(.*):10250'
??????? replacement: '${1}:9100'? # 將kubelet端口(10250)替換為node-exporter端口(9100)
??????? target_label: __address__
??????? action: replace
????? - action: labelmap
??????? regex: __meta_kubernetes_node_label_(.+)? # 保留節點標簽
? # 監控容器指標(cAdvisor)
? - job_name: 'kubernetes-node-cadvisor'
??? kubernetes_sd_configs: [{role: node}]
??? scheme: https? # 使用HTTPS
??? tls_config:
????? ca_file: /var/run/secrets/kubernetes.io/serviceaccount/ca.crt
????? bearer_token_file: /var/run/secrets/kubernetes.io/serviceaccount/token
??? relabel_configs: [...]
??? # 重寫指標路徑為cAdvisor端點
? # 監控API Server
? - job_name: 'kubernetes-apiserver'
??? kubernetes_sd_configs: [{role: endpoints}]
??? scheme: https
??? tls_config: {...}
??? relabel_configs:
????? - source_labels: [__meta_kubernetes_namespace, __meta_kubernetes_service_name, __meta_kubernetes_endpoint_port_name]
??????? action: keep
??????? regex: default;kubernetes;https? # 只保留API Server的endpoint
? # 監控服務端點
? - job_name: 'kubernetes-service-endpoints'
??? kubernetes_sd_configs: [{role: endpoints}]
??? relabel_configs:
????? - source_labels: [__meta_kubernetes_service_annotation_prometheus_io_scrape]
??????? action: keep
??????? regex: true? # 只抓取注解了prometheus.io/scrape=true的服務
????? # 其他重標簽配置...
4. Prometheus部署(Deployment)
prometheus-deploy.yaml定義了Prometheus的部署:
yaml
Copy Code
apiVersion: apps/v1
kind: Deployment
metadata:
? name: prometheus-server
? namespace: monitor-sa
spec:
? replicas: 1
? selector:
??? matchLabels:
????? app: prometheus
????? component: server
? template:
??? metadata:
????? labels:
??????? app: prometheus
??????? component: server
????? annotations:
??????? prometheus.io/scrape: 'false'? # 避免監控自己
??? spec:
????? nodeName: node1? # 指定部署節點
????? serviceAccountName: monitor? # 使用之前創建的服務賬號
????? containers:
????? - name: prometheus
??????? image: prom/prometheus:v2.33.5
??????? command:
????????? - prometheus
????????? - --config.file=/etc/prometheus/prometheus.yml? # 配置文件路徑
????????? - --storage.tsdb.path=/prometheus? # 數據存儲路徑
????????? - --storage.tsdb.retention=720h? # 數據保留30天
????????? - --web.enable-lifecycle? # 啟用配置熱加載
??????? ports:
??????? - containerPort: 9090? # Prometheus Web端口
??????? volumeMounts:
??????? - mountPath: /etc/prometheus
????????? name: prometheus-config? # 掛載配置
??????? - mountPath: /prometheus/
????????? name: prometheus-storage-volume? # 掛載數據卷
????? volumes:
????? - name: prometheus-config
??????? configMap:
????????? name: prometheus-config? # 使用之前創建的ConfigMap
????? - name: prometheus-storage-volume
??????? hostPath:
????????? path: /data? # 使用節點上的/data目錄
????????? type: Directory
5. Prometheus服務(Service)
prometheus-svc.yaml(未完整顯示)通常用于創建Service,暴露Prometheus的Web界面。
總結
這套配置實現了:
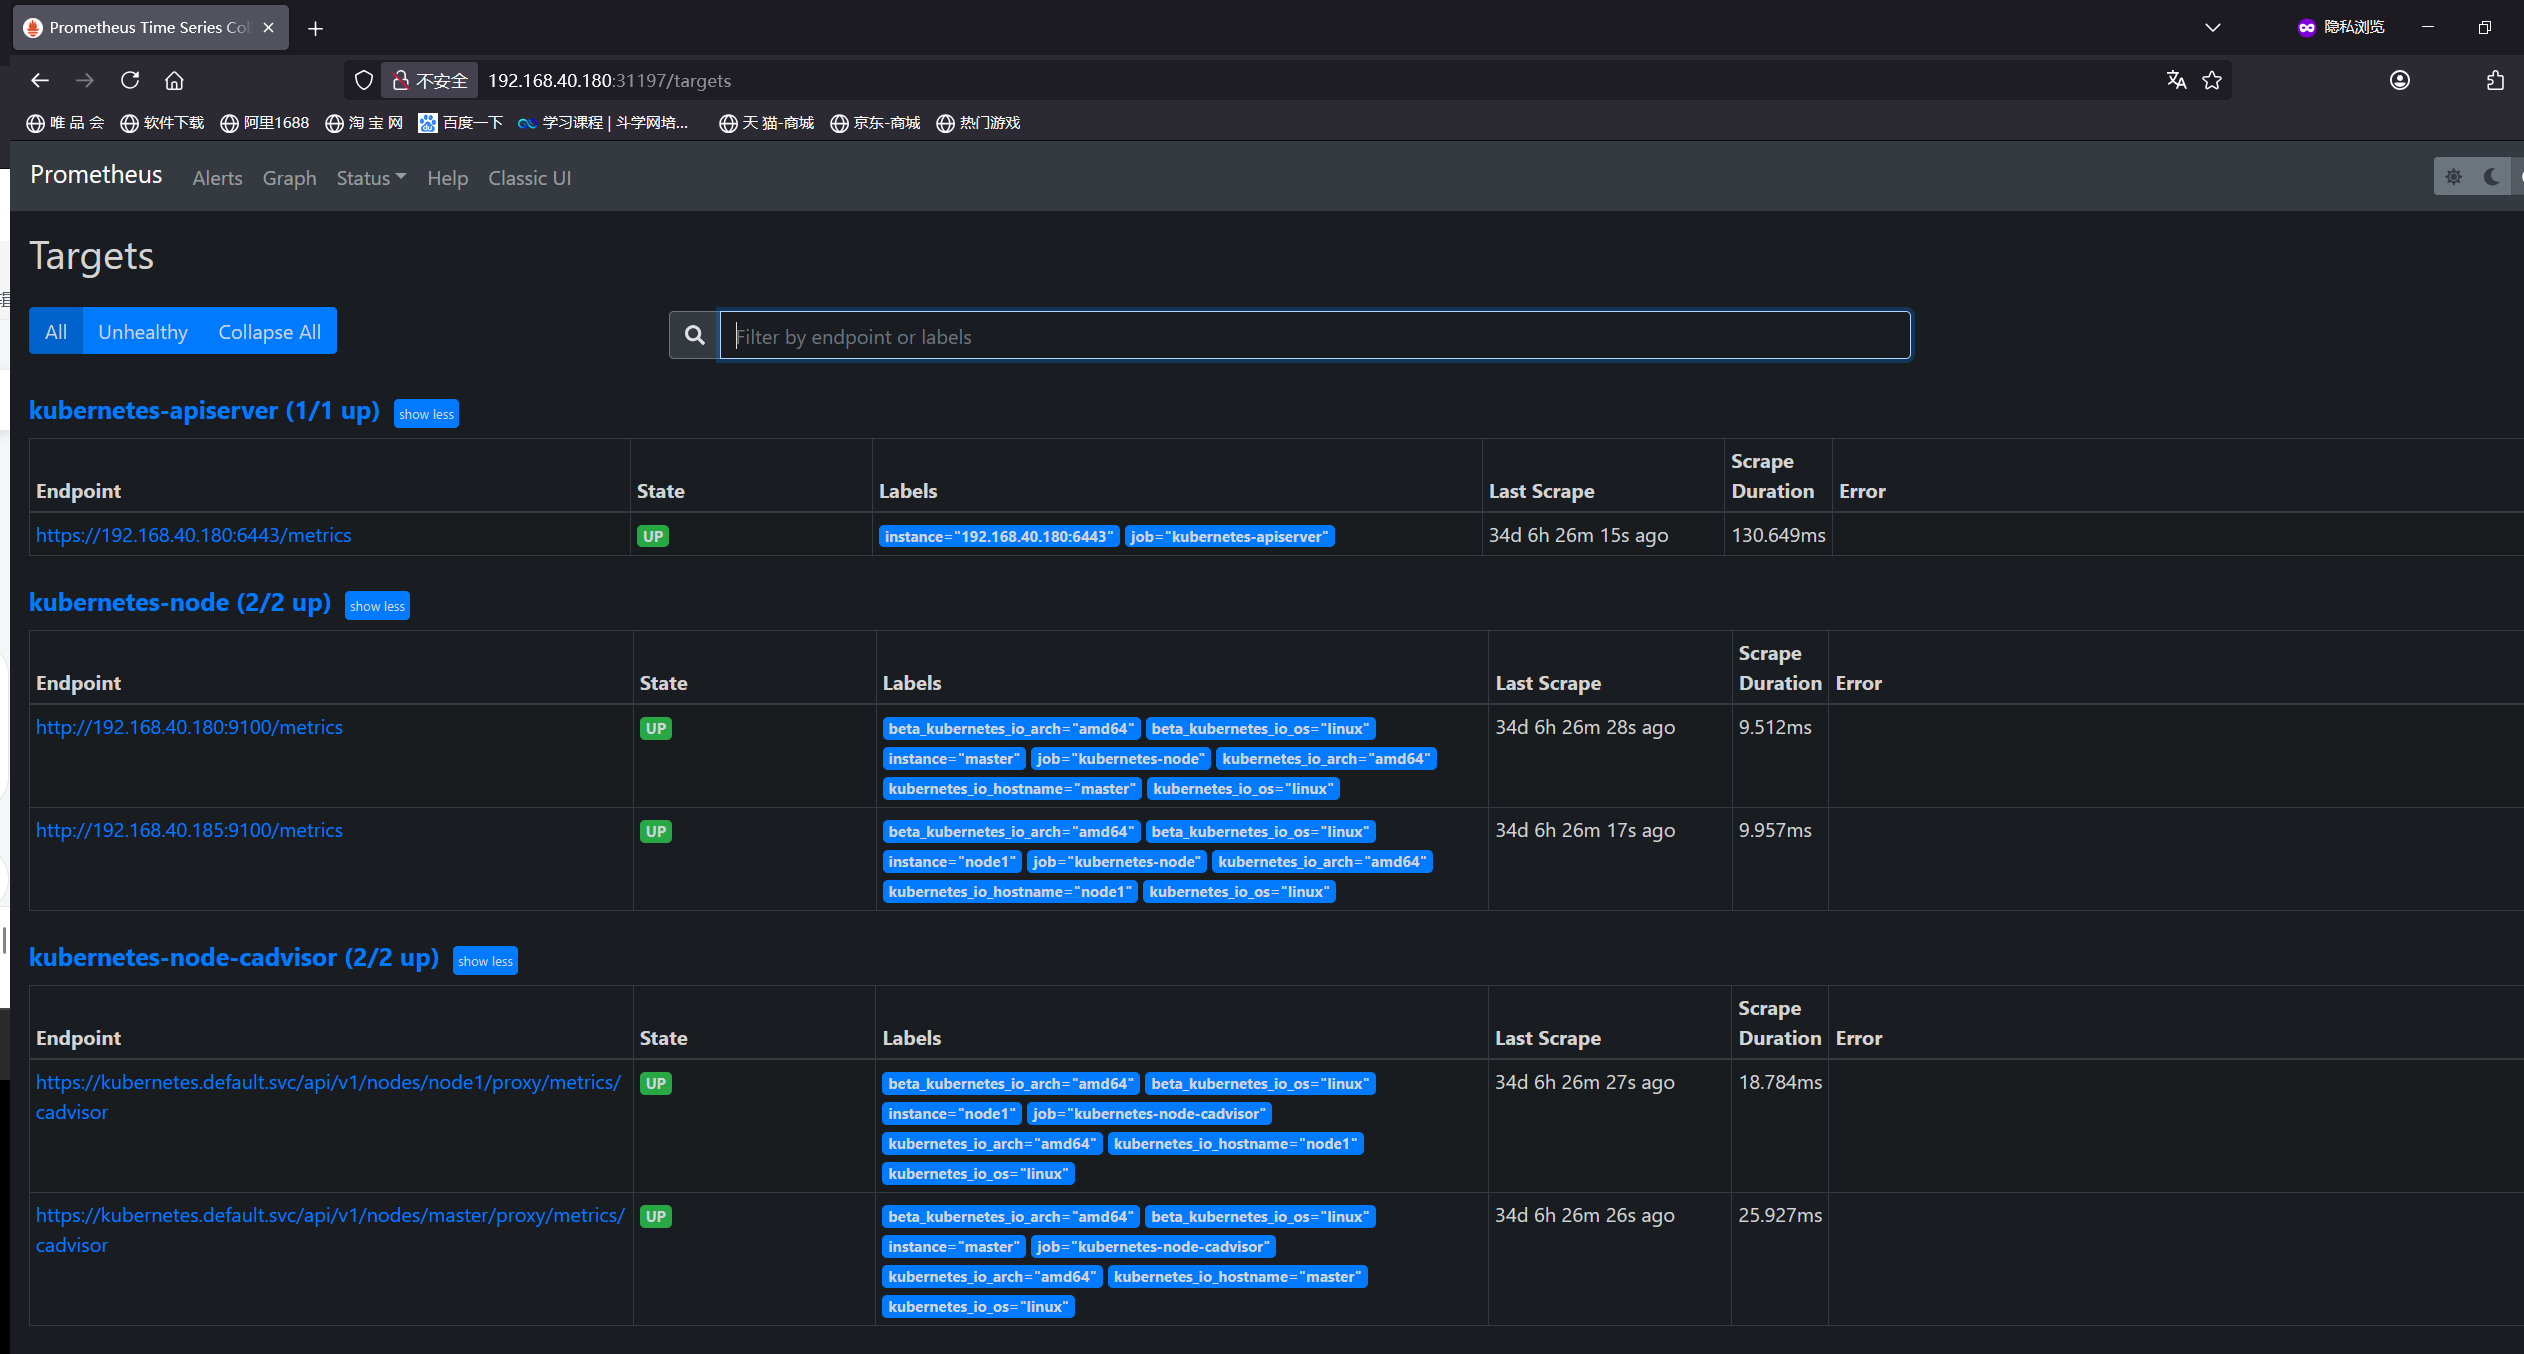
使用Kubernetes原生服務發現自動監控集群組件
監控節點指標、容器指標(cAdvisor)和API Server
通過注解(prometheus.io/scrape)選擇性監控服務
使用主機路徑實現數據持久化
通過ConfigMap管理配置,支持熱更新
這種部署方式為Kubernetes集群提供了全面的監控能力,是云原生監控的典型實現
四、部署grafana
[root@master prometheus]# kubectl apply -f grafana.yaml
deployment.apps/monitoring-grafana configured
service/monitoring-grafana unchanged
[root@master prometheus]# cat grafana.yaml
apiVersion: apps/v1
kind: Deployment
metadata:
? name: monitoring-grafana
? namespace: kube-system
spec:
? replicas: 1
? selector:
??? matchLabels:
????? task: monitoring
????? k8s-app: grafana
? template:
??? metadata:
????? labels:
??????? task: monitoring
??????? k8s-app: grafana
??? spec:
????? nodeName:
????? containers:
????? - name: grafana
??????? image: grafana/grafana:8.4.5
??????? imagePullPolicy: IfNotPresent
??????? ports:
??????? - containerPort: 3000
????????? protocol: TCP
??????? volumeMounts:
??????? - mountPath: /etc/ssl/certs
????????? name: ca-certificates
????????? readOnly: true
??????? - mountPath: /var
????????? name: grafana-storage
??????? - mountPath: /var/lib/grafana/
????????? name: lib
??????? env:
??????? - name: INFLUXDB_HOST
????????? value: monitoring-influxdb
??????? - name: GF_SERVER_HTTP_PORT
????????? value: "3000"
????????? # The following env variables are required to make Grafana accessible via
????????? # the kubernetes api-server proxy. On production clusters, we recommend
????????? # removing these env variables, setup auth for grafana, and expose the grafana
????????? # service using a LoadBalancer or a public IP.
??????? - name: GF_AUTH_BASIC_ENABLED
????????? value: "false"
??????? - name: GF_AUTH_ANONYMOUS_ENABLED
????????? value: "true"
??????? - name: GF_AUTH_ANONYMOUS_ORG_ROLE
????????? value: Admin
??????? - name: GF_SERVER_ROOT_URL
????????? # If you're only using the API Server proxy, set this value instead:
????????? # value: /api/v1/namespaces/kube-system/services/monitoring-grafana/proxy
????????? value: /
????? volumes:
????? - name: ca-certificates
??????? hostPath:
????????? path: /etc/ssl/certs
????? - name: grafana-storage
??????? hostPath:
????????? path: /var/lib/grafana-storage
????????? type: DirectoryOrCreate
????? - name: lib
??????? hostPath:
???????? path: /var/lib/grafana/
???????? type: DirectoryOrCreate
---
apiVersion: v1
kind: Service
metadata:
? labels:
??? # For use as a Cluster add-on (https://github.com/kubernetes/kubernetes/tree/master/cluster/addons)
??? # If you are NOT using this as an addon, you should comment out this line.
??? kubernetes.io/cluster-service: 'true'
??? kubernetes.io/name: monitoring-grafana
? name: monitoring-grafana
? namespace: kube-system
spec:
? # In a production setup, we recommend accessing Grafana through an external Loadbalancer
? # or through a public IP.
? # type: LoadBalancer
? # You could also use NodePort to expose the service at a randomly-generated port
? # type: NodePort
? ports:
? - port: 80
??? targetPort: 3000
? selector:
??? k8s-app: grafana
? type: NodePort
grafana.yaml 文件解析
這個 grafana.yaml 文件是一個 Kubernetes 資源定義文件,用于在 Kubernetes 集群中部署 Grafana 監控儀表盤。文件包含兩個部分:一個 Deployment 和一個 Service。
Deployment 部分
apiVersion?: apps/v1 表示使用的 Kubernetes API 版本。
kind?: Deployment 表示這是一個部署資源。
metadata?:
name?: 部署的名稱,這里是 monitoring-grafana。
namespace?: 部署所在的命名空間,這里是 kube-system。
spec?:
replicas?: 副本數量為 1,表示只會部署一個 Grafana 實例。
selector?: 用于選擇哪些 Pod 屬于這個部署。
template?: Pod 的模板。
metadata?: Pod 的元數據,包括標簽。
spec?: Pod 的規格。
nodeName?: 指定 Pod 部署在哪個節點上,這里是 xianchaonode1。
containers?:
name?: 容器的名稱,這里是 grafana。
image?: 容器使用的鏡像,這里是 grafana/grafana:8.4.5。
imagePullPolicy?: 鏡像拉取策略,這里是 IfNotPresent,表示如果鏡像已經存在則不拉取。
ports?: 容器暴露的端口,這里是 TCP 協議的 3000 端口。
volumeMounts?: 掛載的卷。
env?: 環境變量,用于配置 Grafana。
volumes?: 定義的卷。
Service 部分
apiVersion?: v1 表示使用的 Kubernetes API 版本。
kind?: Service 表示這是一個服務資源。
metadata?:
labels?: 服務的標簽。
name?: 服務的名稱,這里是 monitoring-grafana。
namespace?: 服務所在的命名空間,這里是 kube-system。
spec?:
ports?: 服務暴露的端口,這里是 80 端口,目標端口是 Grafana 容器的 3000 端口。
selector?: 用于選擇哪些 Pod 作為服務的后端,這里是選擇標簽 k8s-app: grafana 的 Pod。
type?: 服務的類型,這里是 NodePort,表示服務會在每個節點的隨機端口上暴露,并且可以通過 <NodeIP>:<NodePort> 的方式訪問。
總結
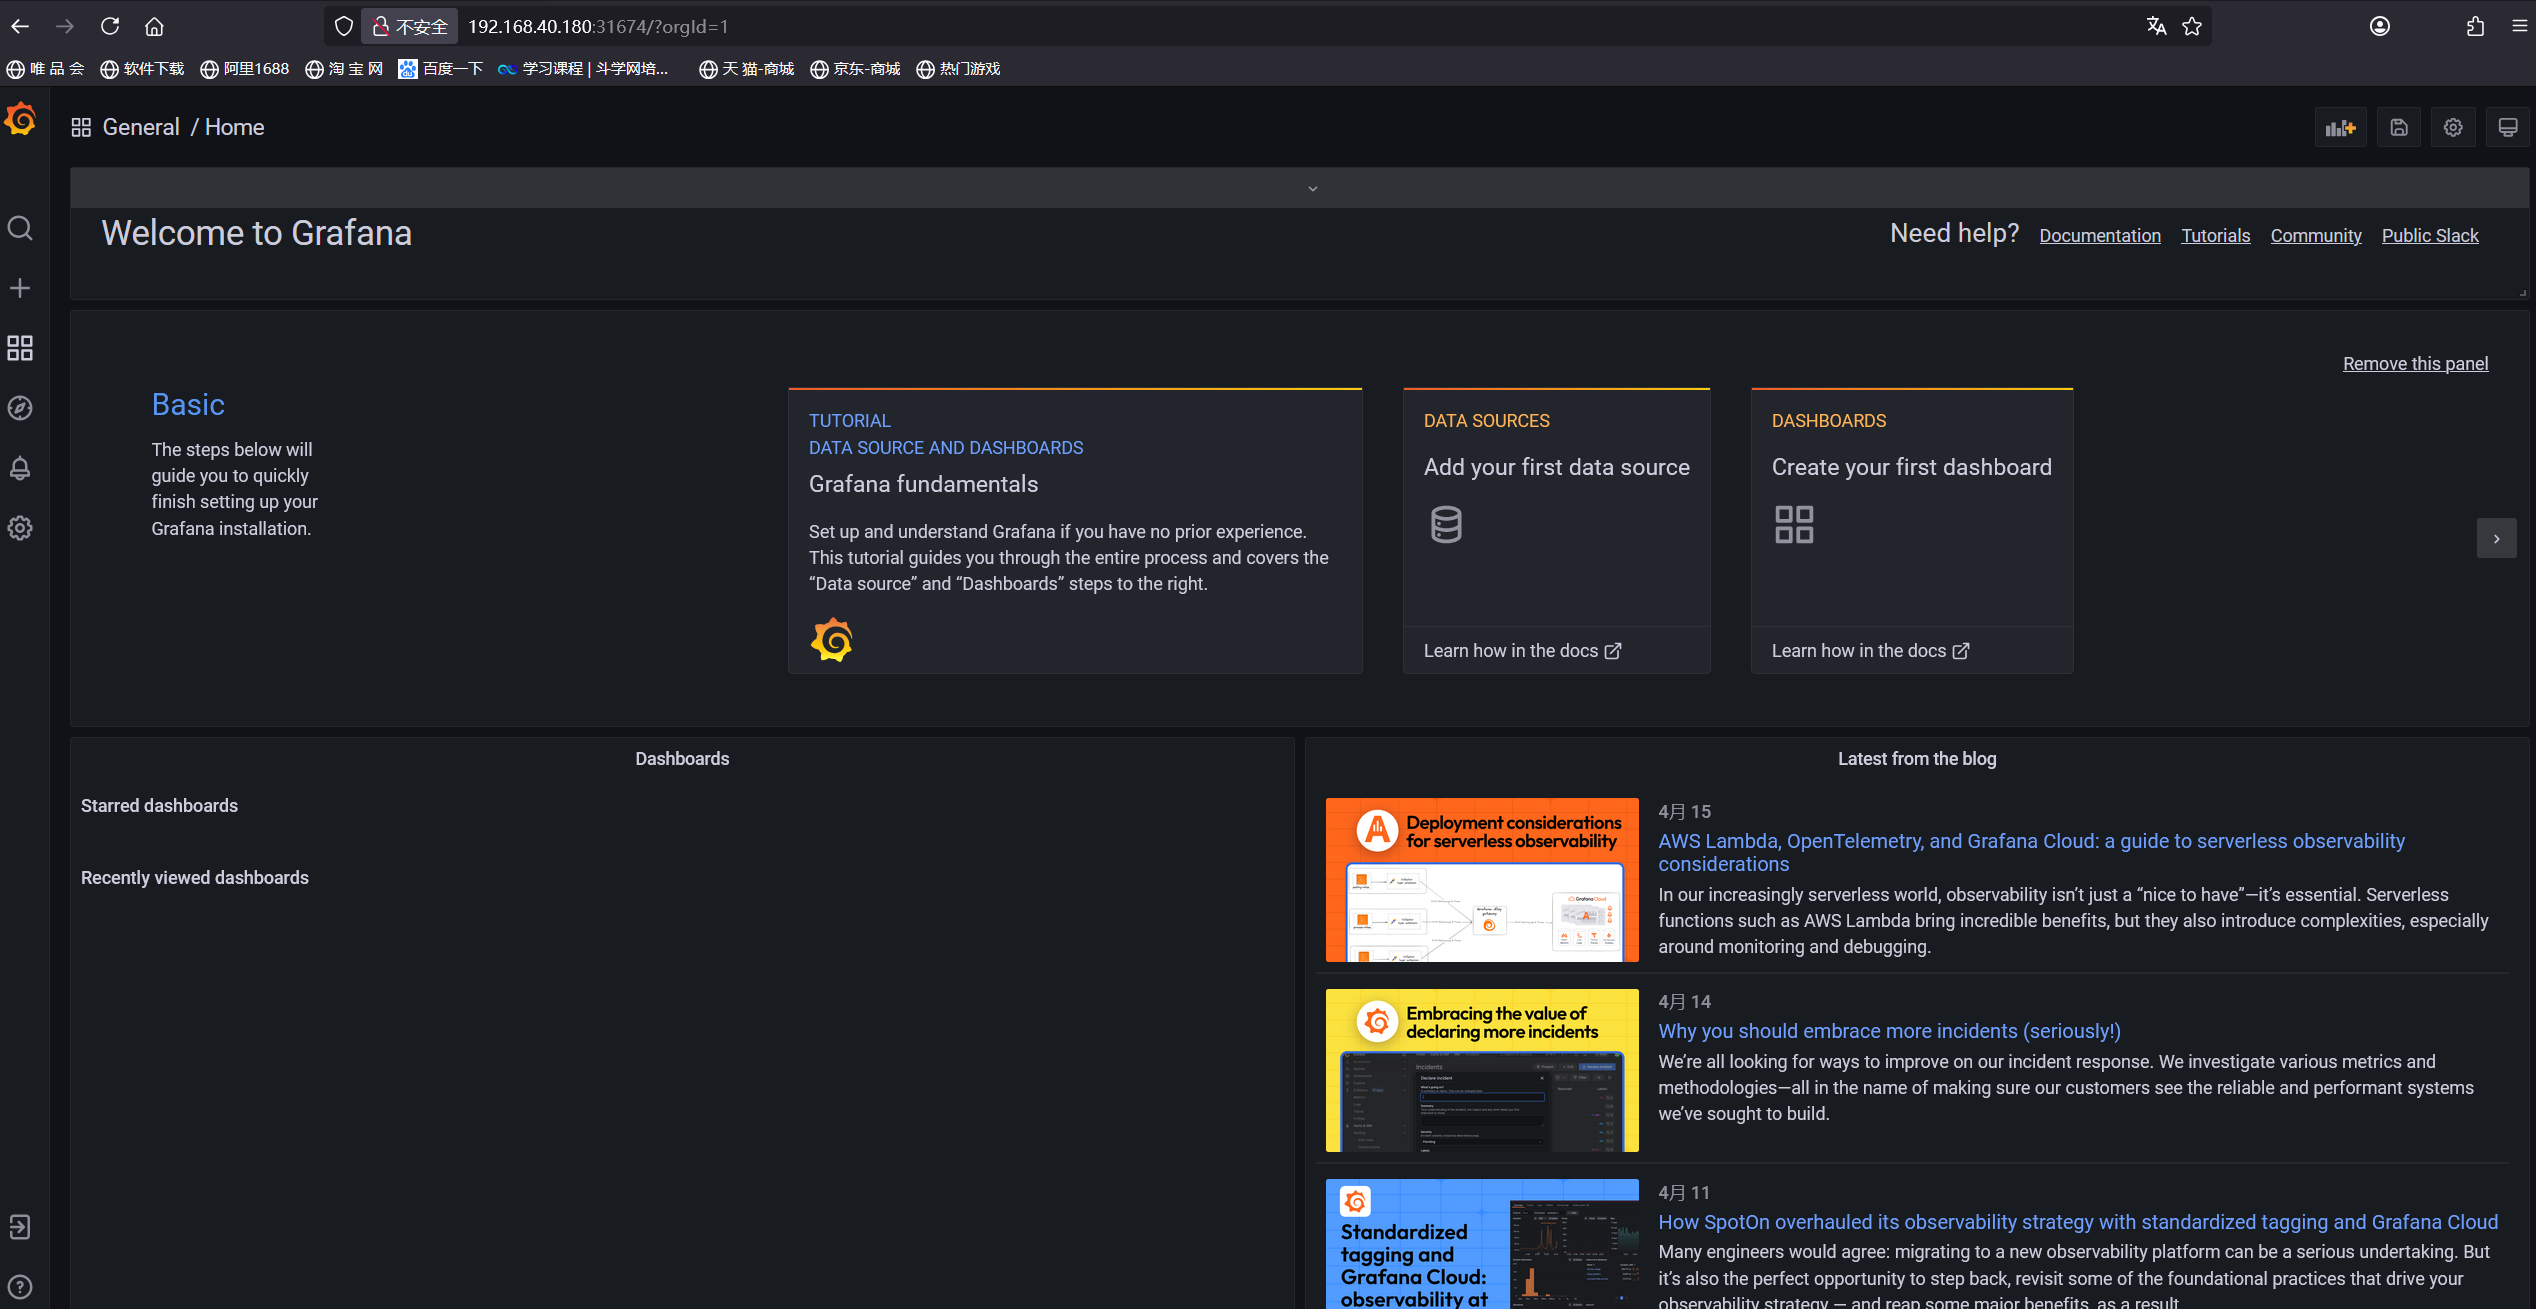
這個文件定義了一個 Grafana 部署,它部署在 xianchaonode1 節點上,使用 grafana/grafana:8.4.5 鏡像,并且暴露了一個 NodePort 類型的服務,可以通過集群節點的 IP 和隨機分配的端口訪問 Grafana 的 Web 界面。文件中還配置了一些環境變量,用于設置 Grafana 的配置,例如 InfluxDB 的主機名、Grafana 的 HTTP 端口、認證設置等。
注意?:在生產環境中,通常建議使用 LoadBalancer 或公共 IP 來暴露 Grafana 服務,并配置適當的認證和授權機制來保護 Grafana 的訪問。
的軌跡仿真,主要用于模擬升力體在不同飛行階段(初始滑翔段、滑翔段、下壓段)的運動軌跡)


)


)


