報告內容
在開始正式的分析之前,需要查看在對齊和計數過程中生成的任何總結統計信息。下圖是由Cell Ranger工具創建的10X總結報告,在從10X scRNA-seq實驗生成計數矩陣時會生成。

?The left half of the report describes sequencing and mapping statistics. One thing to note is the “sequencing saturation”, which estimates the proportion of mRNA transcripts that has been sequenced. This is calculated by downsampling the mean number of reads per cell and obtaining the corresponding number of UMIs (nUMI). The relationship between the number of UMIs obtained against the number of reads is then extrapolated to the asymptote, which corresponds to 100% saturation. A low sequencing saturation implies that deeper sequencing will likely recover more UMIs. That said, some preliminary analysis should first be performed to determine if the current number of UMIs recovered is able to answer the biological questions of interest. Also, check that a high percentage of reads are mapped to the genome, which indicates low amounts of contamination.
The top-right portion of the report plots the nUMI captured in each droplet / barcode, with the droplets ordered in decreasing nUMI from left to right. On the left side of the plot, droplets have very high nUMI and are likely to contain cells. As we scan through the droplets towards the right, we eventually encounter a “knee point” where there is a drastic drop in the nUMI. This likely signifies a transition from observing cell-containing droplets to droplets containing cell debris or no cells at all. Droplets that are deemed by Cell Ranger to contain cells are coloured blue here and the algorithm tends to include slightly more cells beyond the plot shoulder. These cells with smaller nUMIs will have to be removed in the quality control step.
From the summary report, there is another important observation: the nUMI does not correspond to the number of reads per cell. Recall that this is because reads with the same UMI originated from a single mRNA molecule and is thus treated as a single UMI count . Thus, the number of counts i.e.?nUMI is usually only a fraction (about 1/8 to 1/3) of the number of reads.
?下圖為本人使用CellRanger V5.2.0對語一個單細胞數據跑出的結果
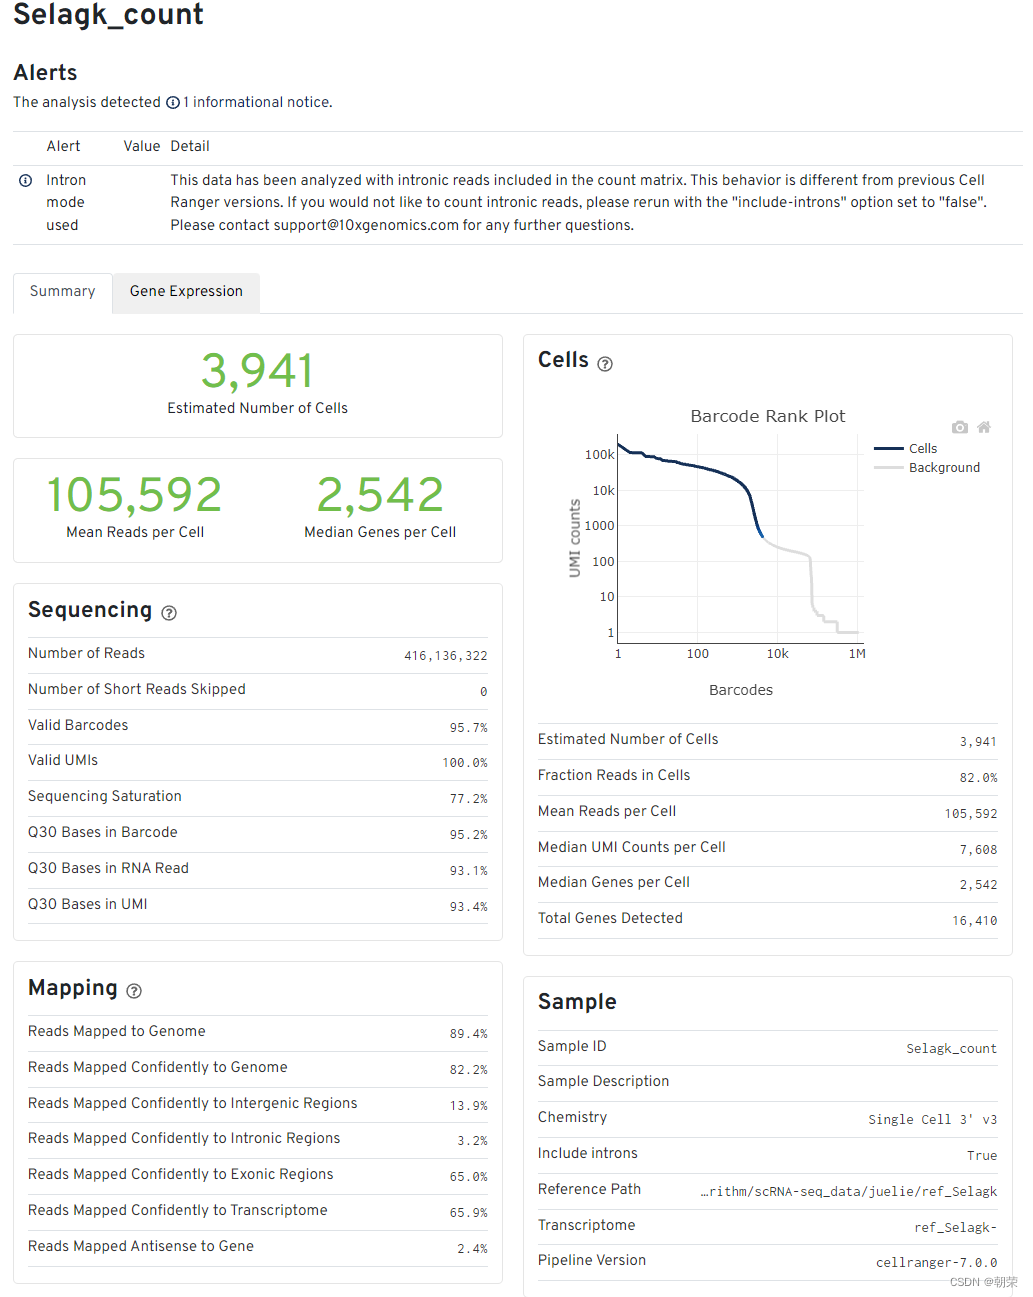
報告解讀
細胞和基因數目的評估
- Estimated number of cells - 樣本測到的細胞數
- Mean reads per cell - 每個細胞測到的平均reads
- Median genes per cell - 每個細胞基因數的中位數
Sequencing中
Number of reads - 測到的總read數目
Valid barcodes - UMI校正后匹配的UMI數量
Sequencing saturation:測序飽和度。一般60-80%比較合適(閾值范圍可以適當調整,但是高于70%或80%左右絕對OK)。如果測到的細胞數多,但是每個細胞里面的平均reads數少,那么飽和度就不高,反之,飽和度高。但也不是越高越好,背后原理是抽樣的原理,到達80%左右就可以代表整個樣本了。
Q30 bases in barcode - 基于barcode的分數,大于30的比率
Q30 bases in RNA read - 基于RNA read的分數,大于30的比率
Q30 bases in UMI - 基于UMI的分數,大于30的比率
(認為要一般要大于65%,少于這個比例的話,這個頁面會報錯,)
Mapping結果
- Reads mapped to genome - 比對到選定基因組的reads
- Reands mapped confidently to genome - 僅僅比對到基因組的reads,如果一條reads既可以比對到外顯子區又可以比對到非外顯子區,那么算比對到了其中一個外顯子區
- Reads mapped confidently to intergenic regions - 比對到基因組的基因間區域
- Reads mapped confidently to intronic regions - 比對到內含子區域
- Reads mapped confidently to exonic regions - 比對到外顯子區域
- Reads mapped confidently to transcriptome - 比對到轉錄組的reads,這些讀數可以用來UMI的計數
- Reads mapped antisense to gene - 比對到基因的相反的reads
細胞數目評估Cells圖
橫軸是barcodes,縱軸是UMI數量。通過barcode上的UMI標簽分布來評估細胞數目,深藍色代表細胞,灰色代表背景。
在前期磁珠(bead)與細胞形成油包水的結構過程中,會存在沒有把細胞包進去的情況,這時候的油包水結構里面就只有磁珠和一些barcode的序列,而cDNA的堿基序列一般都是barcode堿基序列的10倍以上,就是由此來確定哪些是真實的細胞,哪些是background。
其他指標
- Estimated number of cells - 樣本測到的細胞數
- Fraction reads in cells - valid-UMI的質量分數,代表與細胞相關的UMI可靠地比對到基因組,一般要在70%及以上,否則數據質量就不好
- Mean reads per cell - 每個細胞測到的平均reads
- Median genes per cell - 每個細胞的基因數中位數
- Total genes detected - 測到的總基因數,至少有一條UMI
- Median UMI counts per cell - 細胞UMI數量的中間值
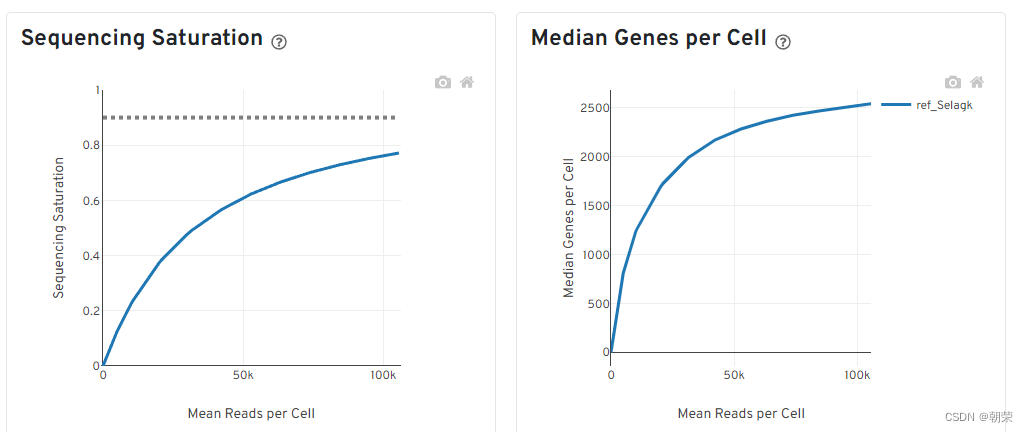
飽和度評估
- 對reads抽樣,觀察不同抽樣條件下檢測到的轉錄本數量占檢測到的所有轉錄本的比例。(如果曲線末端區域平滑,說明測序接近飽和,再增加測序量,覆蓋到的轉錄本數目也不會變化太多。)
- 對reads抽樣,觀察不同測序數據量情況下檢測到的基因數目的分布。(如果曲線末端區域平滑,說明測序接近飽和,再增加測序量,檢測到的基因數目也不會變化太多。)
Reference
[1] A Guide to Analyzing Single-cell Datasets,?John F. Ouyang, January 2023

)


)

的高維度單模態中介模型的參數估計(入門+實操))


