Neo4j 官方網站快速入門新手教精讀
???????本文旨在為Neo4j新手提供一份全面的入門指南。除了基礎的文本解釋,我在里面還插入了每一步驟的詳細截圖或者自己畫的圖,從官方了解知識肯定比自己亂看要權威一些,有看不懂的不要糾結了解大概意思即可,隨著知識的積累最后會頓悟的,這里面的內容好多機翻不出來的或者不好理解的我根據對相關知識的了解人工進行了潤色,如果有表達不準確或者不清楚的地方,非常歡迎批評指正,共同進步。
Neo4j Aura 是一個完全托管的圖形數據庫服務,它提供了一個高度可擴展、安全和操作簡便的環境,使用戶能夠輕松構建和維護基于圖形的數據模型和應用程序。
https://neo4j.com/cloud/platform/aura-graph-database/?ref=neo4j-home-hero
文章目錄
- Neo4j 官方網站快速入門新手教精讀
- 1. Learn the basics 基礎了解
- 2. What is a graph? 圖是什么?
- 3. Nodes, properties, relationships 節點,屬性,關系
- 3.1 Nodes and properties 節點和屬性
- 3.2 Relationships 關系
- 4. Re-imagining a classic (Northwind) 回顧經典圖數據集(北風)
- 5. Finish the Northwind import 完成北風數據集的導入
- 5.1 Preview your data import 預覽導入數據
- 5.2 Explore your data 探索您的數據
- 6. Explore your graph 探索你的圖
- 6.1 Searching for data in Explore 在Explore中搜索數據
- 7. Advanced exploration 先進的展示
- 8. Basic Querying 基礎查詢
- 9. Writing your first query 寫你的第一個查詢
- 10. A more advanced query更高級的查詢
- 11. Next steps 下一步
- 11.1 Next steps with Cypher 關于Cypher語言的下一步
- 11.2 Creating applications 創建應用
- 11.3 Go further with GraphAcademy 在GraphAcademy上更近一步
- 教程中給出的網站匯總
- 結束
1. Learn the basics 基礎了解
???????This guide teaches you about the power of graph databases. It is the recommended starting place for all new users as it touches upon the concepts and tools you need to work with graphs.
???????本指南將向您介紹圖數據庫的強大功能。它是所有新用戶的推薦入門指南,因為它設計到使用圖所需要的概念和工具。
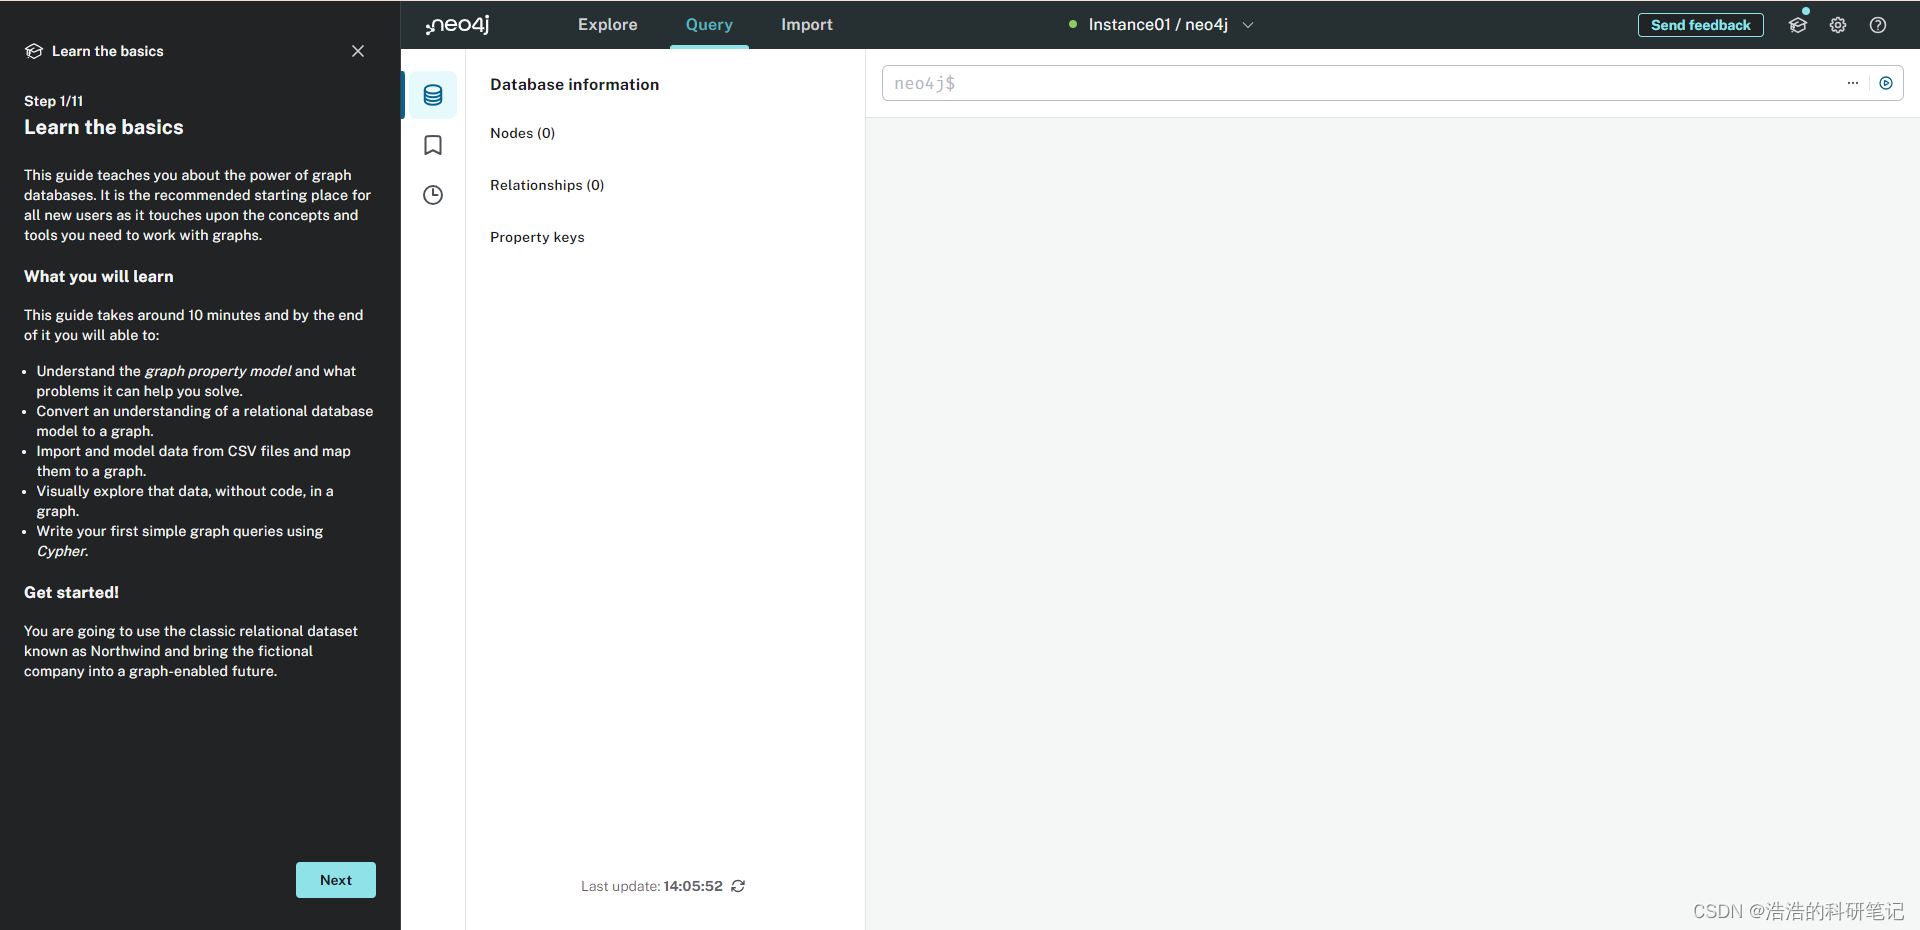
What you will learn
你將會學到什么
This guide takes around 10 minutes and by the end of it you will able to:
本指南大約需要十分鐘,在結束時候您能夠學到
- Understand the graph property model and what problems it can help you solve.
明白圖的性質以及它能幫助你解決什么問題 - Convert an understanding of relational database model to a graph
將對一個關系數據庫的理解轉化為一個圖 - Import and model data from CSV file and map them to a graph.
把CSV格式的文件導入圖數據庫,并將其建模成一個圖 - Visually explore that data, without code, in a graph.
在圖中直觀的查看這些數據,且不需要代碼 - Write your first simple graph queries using Cypher
使用Cypher命令,來進行一個簡單的圖數據庫的查詢
Get started!
讓我們開始
???????You are going to use the classic relational dataset known as Northwind and bring the fictional company into graph-enabled future.
???????你將使用名為NotrhWind的經典關系數據庫,并將一個虛擬公司帶入一個圖使能的未來。
2. What is a graph? 圖是什么?
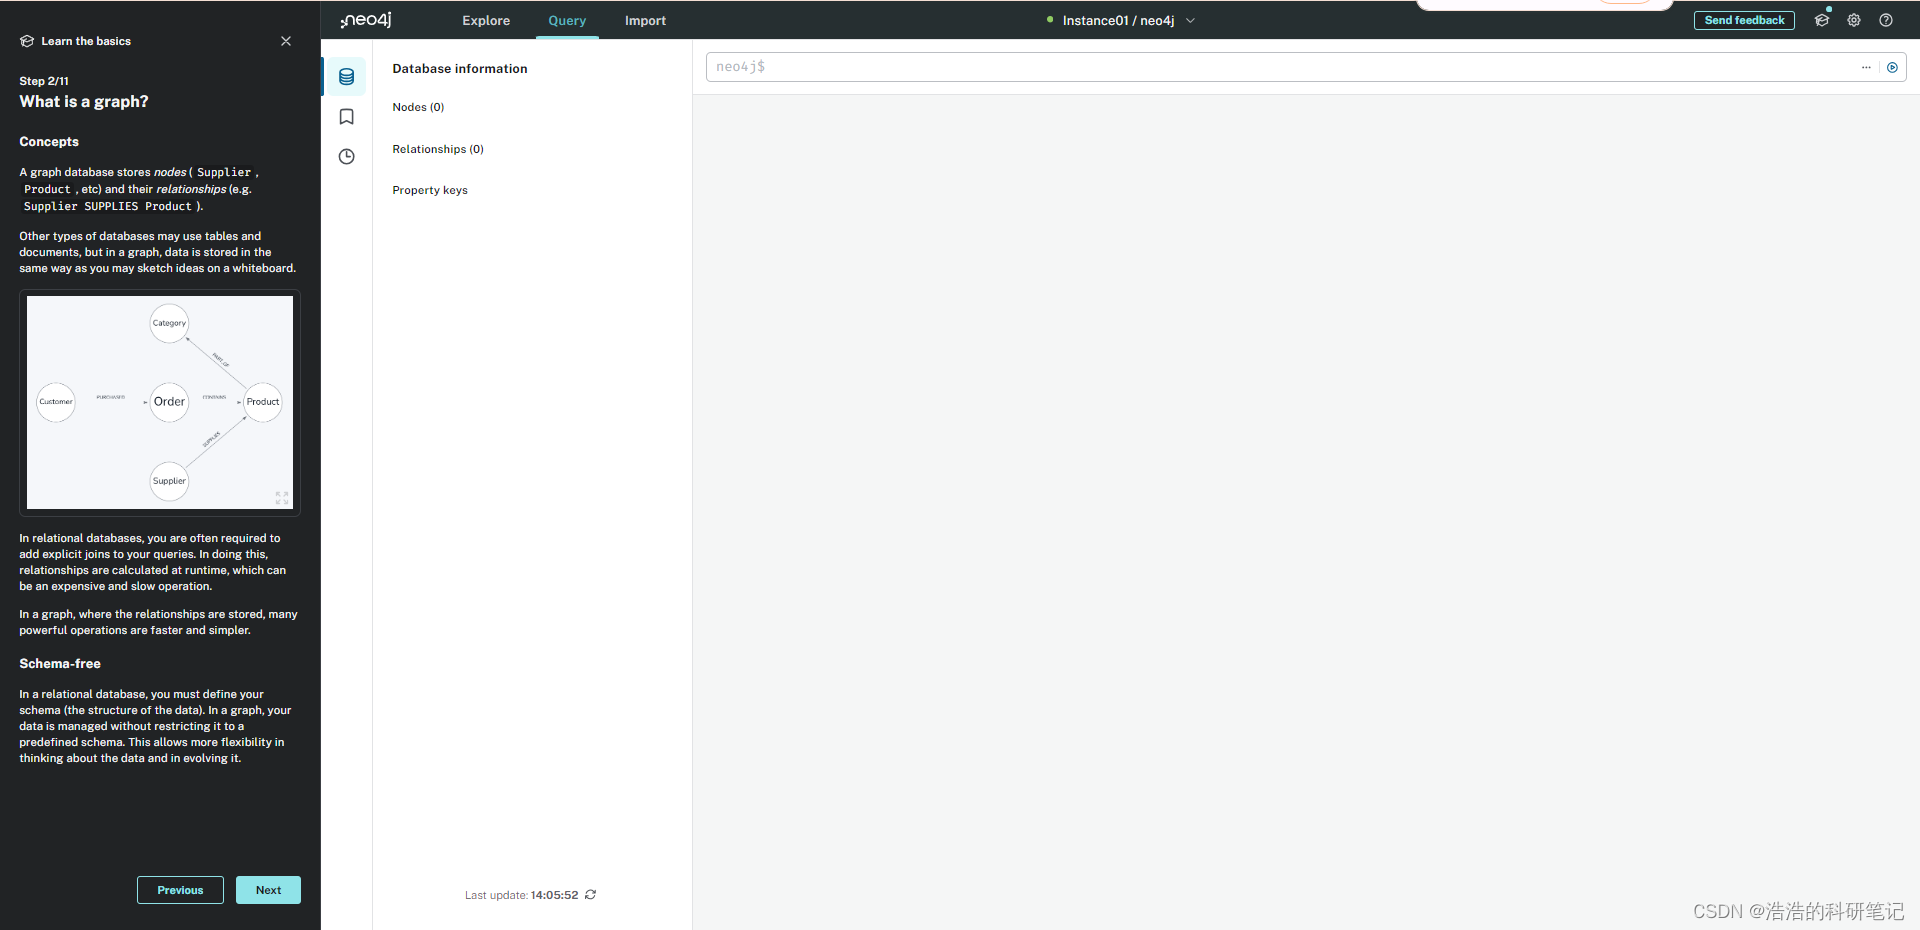
Concepts 圖的概念
???????A graph database stores nodes(Supplier, Product, etc) and their relationship(e,g, Supplier SUPPLIES Product).
???????一個圖數據庫存包含著兩種元素,節點(供應商,產品,等等) 以及他們的關系 (供應商供應產品)
???????Other types of databases may use tables and documents, but in a graph, data is stored in the same way as you may sketch ideas on a whiteborad.
???????其他類型的數據庫可以能使用的是表格和文檔,但是在圖數據庫存儲數據的方式和您在白板上勾畫想法的方式相同。
In a graph, where the relationships are stored, many powerful operations are faster and simpler.
在一個圖數據庫中,在存儲一些關時,很多操作更加快速和便捷
Schema-free形式自由
???????In a relational database, you must define your schema (the structure of the data). In a graph, your data is managed without restricting it to a predefined schema. This allows more flexibility in thinking about the data and in evolving it.
???????在一個關系數據庫中,你必須定義一個數據格式,在一個圖數據庫中,你的數據并沒有需要嚴格遵守的格式限制,因此在考慮數據的時候可以更靈活和發散。
3. Nodes, properties, relationships 節點,屬性,關系
???????The nodes and relationships in your graph can have types and properties.
???????在我們的圖數據庫中的節點和關系可以有類別和屬性。
3.1 Nodes and properties 節點和屬性
???????Nodes can be tagged with labels, representing their different roles in your dataset (e.g. Supplier, Employee, Customer). They can also have any number of key-value pairs as properties (e.g. name:"Camembert Pierrot").
???????節點可以用標簽來標記,表示他們在數據集中的不同角色例如(供應商,員工,客戶),節點也可以包含任意數量的鍵值對作為屬性例如(名字:Camembert Pierrot)
3.2 Relationships 關系
???????Relationships provide directed, typed, or attributed, connections between two node entities (e.g. Shipper SHIPS Order).
???????關系提供了兩個節點之間的指向,類型,所屬關系,例如(托運人的船舶訂單)
???????Relationships always have a direction, a type, a start node, and an end node. They can also have properties, just like nodes.
???????關系包包含一個指向一個類型一個起始節點一個指向節點,且關系和節點一樣依然包含一些屬性。
???????Nodes can have any number of relationships without sacrificing performance.
???????節點可以包含任何數量的關系且不用犧牲任何的已經表現出的信息。
???????Although relationships are always directed, they can be navigated efficiently in any direction. In this example, you can find who shipped an order and you can also reverse that and find what orders were shipped.
???????盡管關系總是有方向的,但是他可以沿著任何方向進行有效的查找。在這個例子中,你可以查找誰發了一個訂單,也也可以反向查找這個訂單是由誰發送的
4. Re-imagining a classic (Northwind) 回顧經典圖數據集(北風)
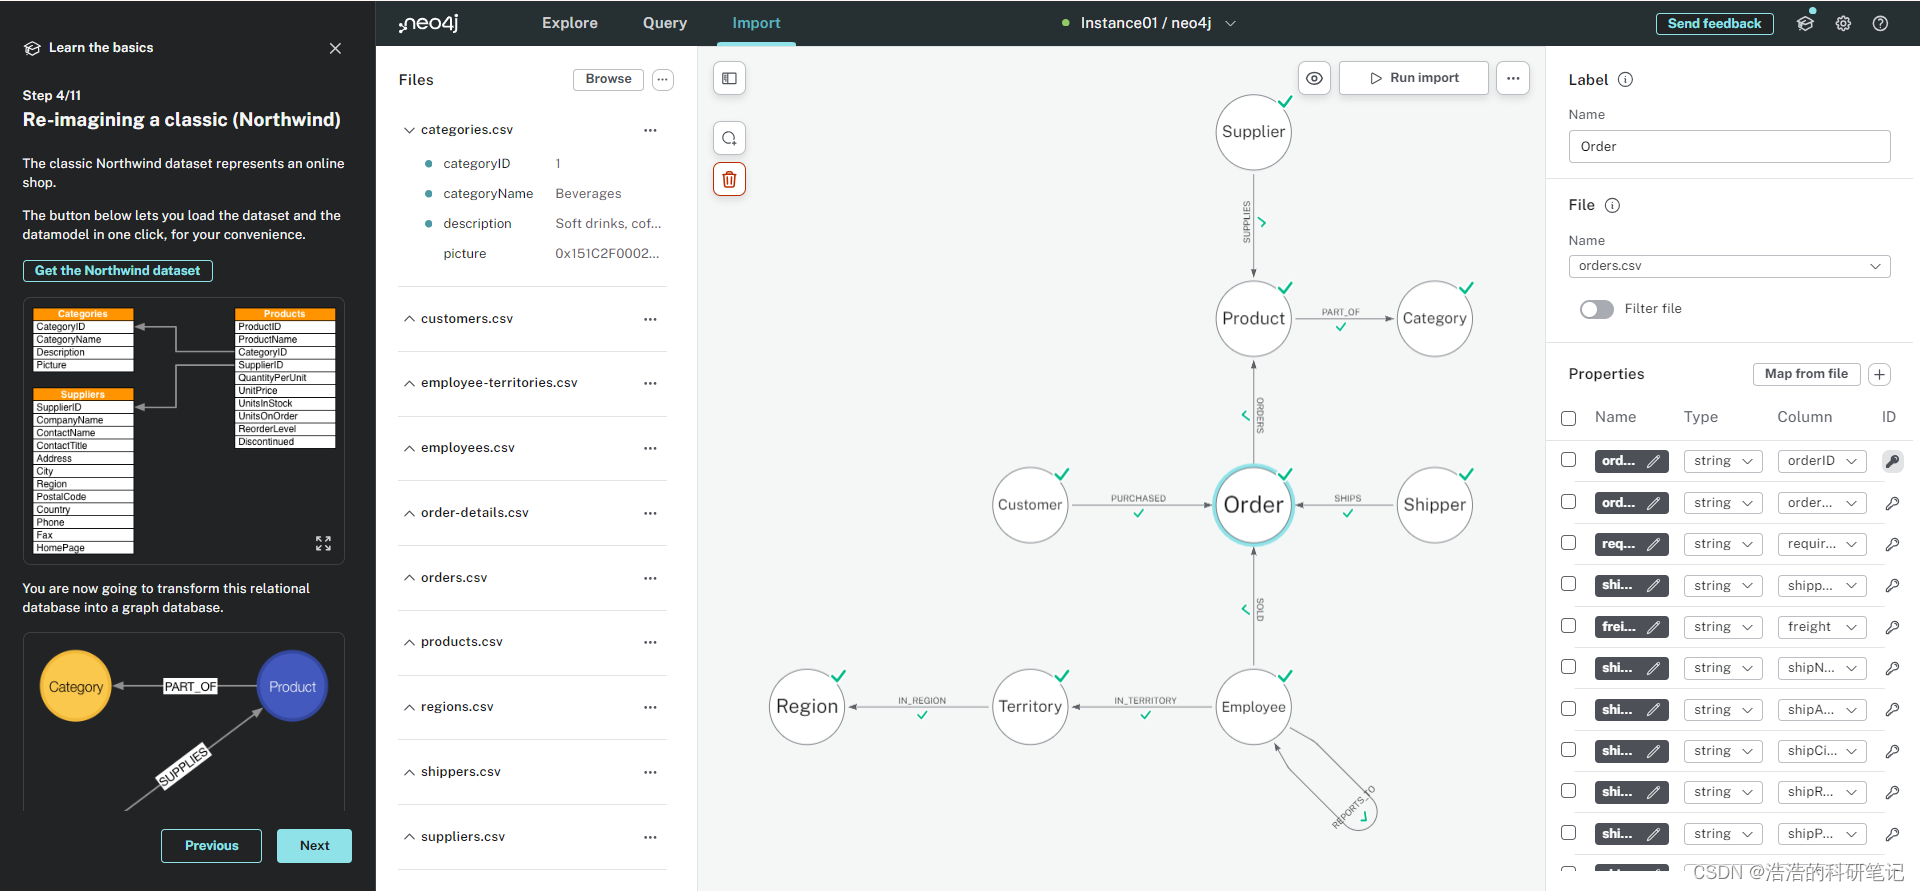
The classic Northwind dataset represents an online shop.
北風數據集表示的是一個在線商店

You are now going to transform this relational database into a graph database
現在你要把這個關系數據集轉換成圖數據集

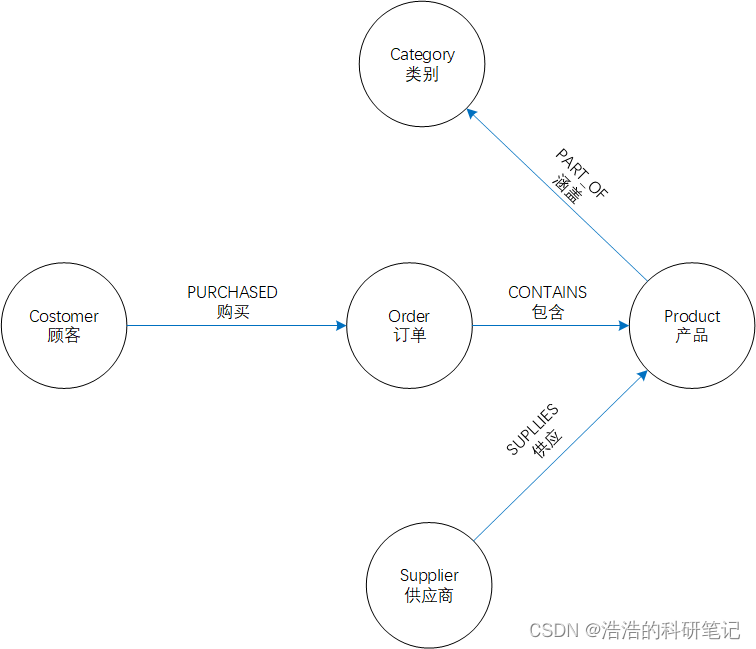
???????You can see the CSV files from Northwind’s tables represented as a graph model. The mappings for these files are already prepared for you.
???????你可以看到北風數據集中的CSV文件表示的圖,里面的映射關系文件當中都已經為你準備好了。
???????Notice the relationships connecting the nodes, e.g. a Customer PURCHASED an Order and the Order ORDERS Products.
???????注意鏈接節點的這些關系,例如:顧客購買了訂單,訂單訂購了產品

5. Finish the Northwind import 完成北風數據集的導入

???????For each node and relationship in the model you can see which parts of the CSV file are mapped to which properties
???????對生成的圖中的節點和關系,你可以看到哪部分的CSV文件映射到了哪種屬性
???????Source and target IDs from the original join tables or foreign keys are used to create relationships to connect nodes
???????原始連接表或外鍵中的源ID和目標ID被用來創建關系以連接節點(白話就說用是CSV中有節點和關系還有屬性讀出來之后生成了圖)
???????The model is interactive; you can click around and explore its nodes and relationships.
???????該模型是交互式的;您可以單擊并探索其節點和關系。
5.1 Preview your data import 預覽導入數據
???????You can see a preview of the data import by clicking the Preview button.
可以點右上的預覽按鈕來查看數據導入的預覽
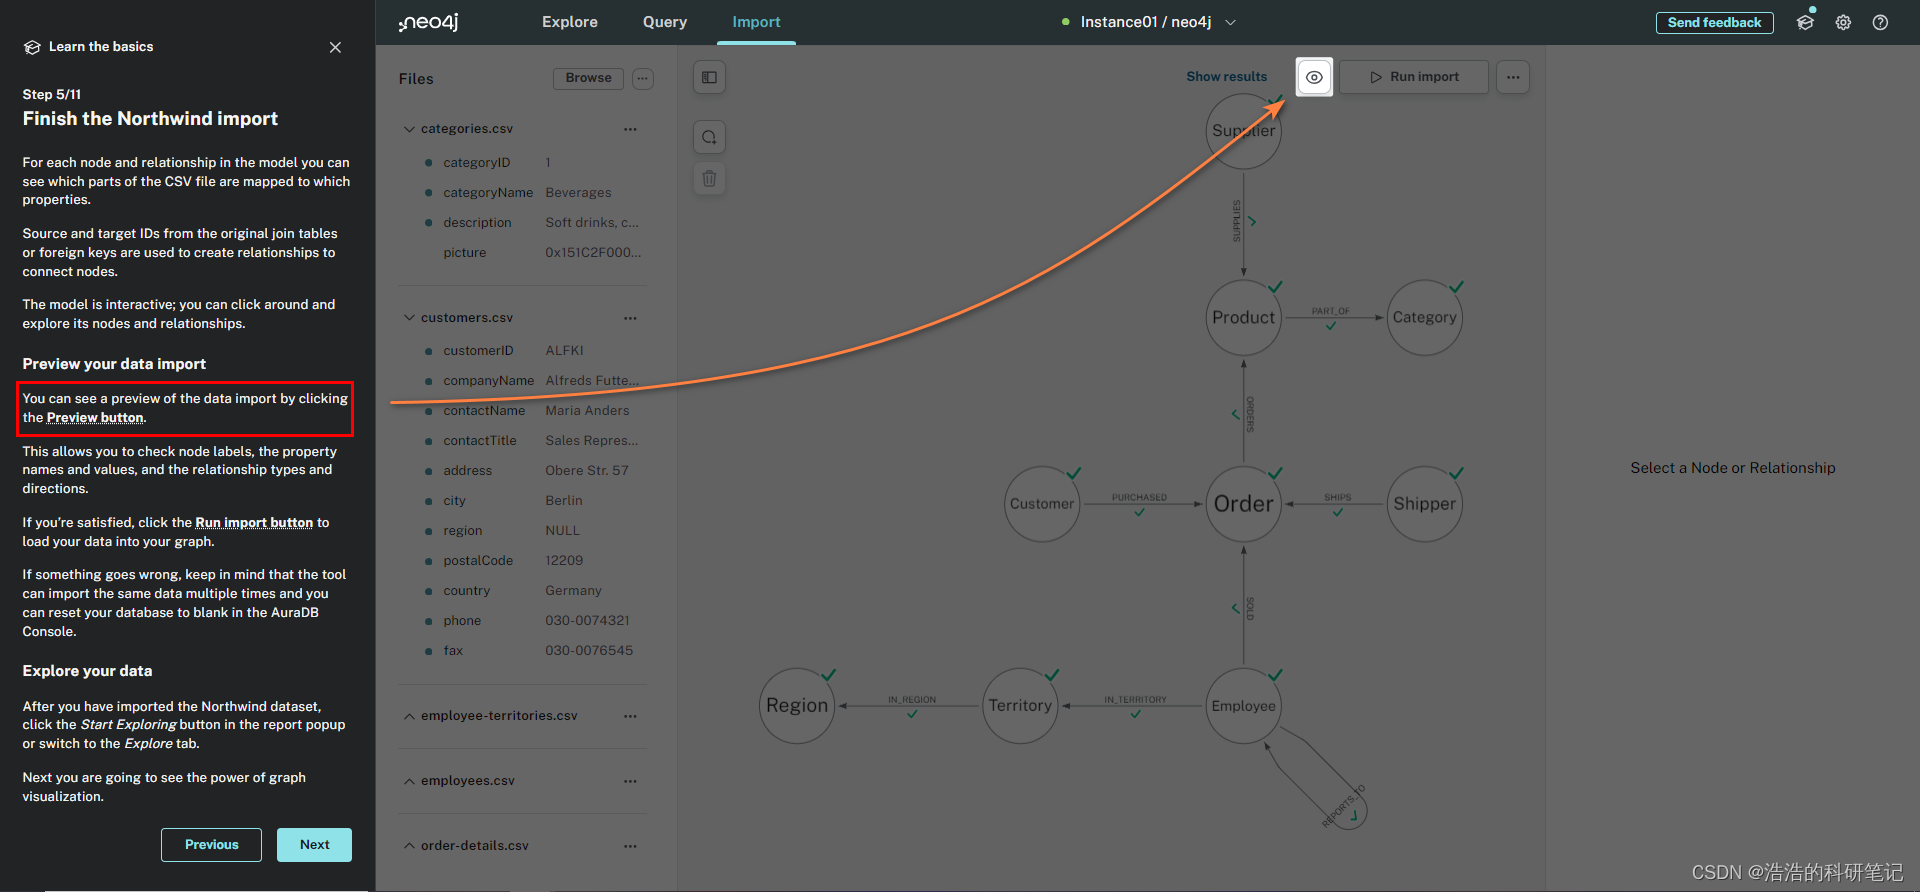
???????This allows you to check node labels, the property names and values, and the relationship types and directions.
???????通過點擊這個按鍵,可以檢查導入的文件的節點標簽、屬性名稱和值,以及關系類型和方向。(點里面的Preview all)

???????If you’re satisfied, click the Run import button to load your data into your graph.
如果你滿意的話,點擊Run import按鈕去把你的數據加載到圖里


???????If something goes wrong, keep in mind that the tool can import the same data multiple times and you can reset your database to blank in the AuraDB Console.
???????如果報錯了的話,注意這個工具(指 Run Import 按鈕)可以多次導入相同數據 然后你可以把你的數據庫在AuraDB Console中清空。
5.2 Explore your data 探索您的數據
???????After you have imported the Northwind dataset, click the Start Exploring button in the report popup or switch to the Explore tab.
???????導入北風數據集后,單擊報告彈出框中的開始探索按鈕或切換到探索選項卡。

???????Next you are going to see the power of graph visualization.
???????之后你會看到圖可視化的力量。
6. Explore your graph 探索你的圖
With the data in a graph, it is time to get familiar with the Explore tab.
有了圖表中的數據,是時候熟悉Explore選項卡了。
???????The Show me a graph Search Phrase runs automatically to show an example subset of the data. The visualized graph represents the relationships in the data in an intuitive way.
???????(剛點擊完 Explore results 之后)Show me a graph 搜索短語會自動運行,以顯示數據的一個示例子集。可視化圖以直觀的方式表示數據之間的關系。
???????You can also run the Show me a graph example Search Phrase yourself by typing the Show me a graph in the top-left search bar.
???????你也可以自己在左上角的搜索欄里自己手動輸入Show me a graph 然后運行。

6.1 Searching for data in Explore 在Explore中搜索數據
???????You can use simple search phrases based on your node labels and relationship types to visualize your graph. If you ran the example Search Phrase, you should clear the scene before you continue. Right-click anywhere on the canvas and select Clear Scene or Ctrl+Bksp/Cmd+Bksp.
???????你可以基于你自己的節點標簽和關系來用一個簡單的搜索詞可視化你的圖,如果你運行一個示例搜索詞,在你進行操作之前要把屏幕情況,右鍵(我實際操作下來應該是左鍵點擊)隨便點擊圖顯示框中的任何一個位置然后按住Ctrl+Bksp/Cmd+Bksp刪除。
???????If you enter Category<tab> and then press return; it fetches and displays all categories. You can now explore and expand the graph visualization.
???????如果你先按<tab>然后安enter就能獲取和顯示所有類別。現在你可以繼續探索和延申圖的可視化。
???????This is a great way to discover interesting relationships and formulate questions about your data.
???????這是發現你的數據中有趣的聯系和規范化問題的一個好的方式(說實話這句沒太明白)。
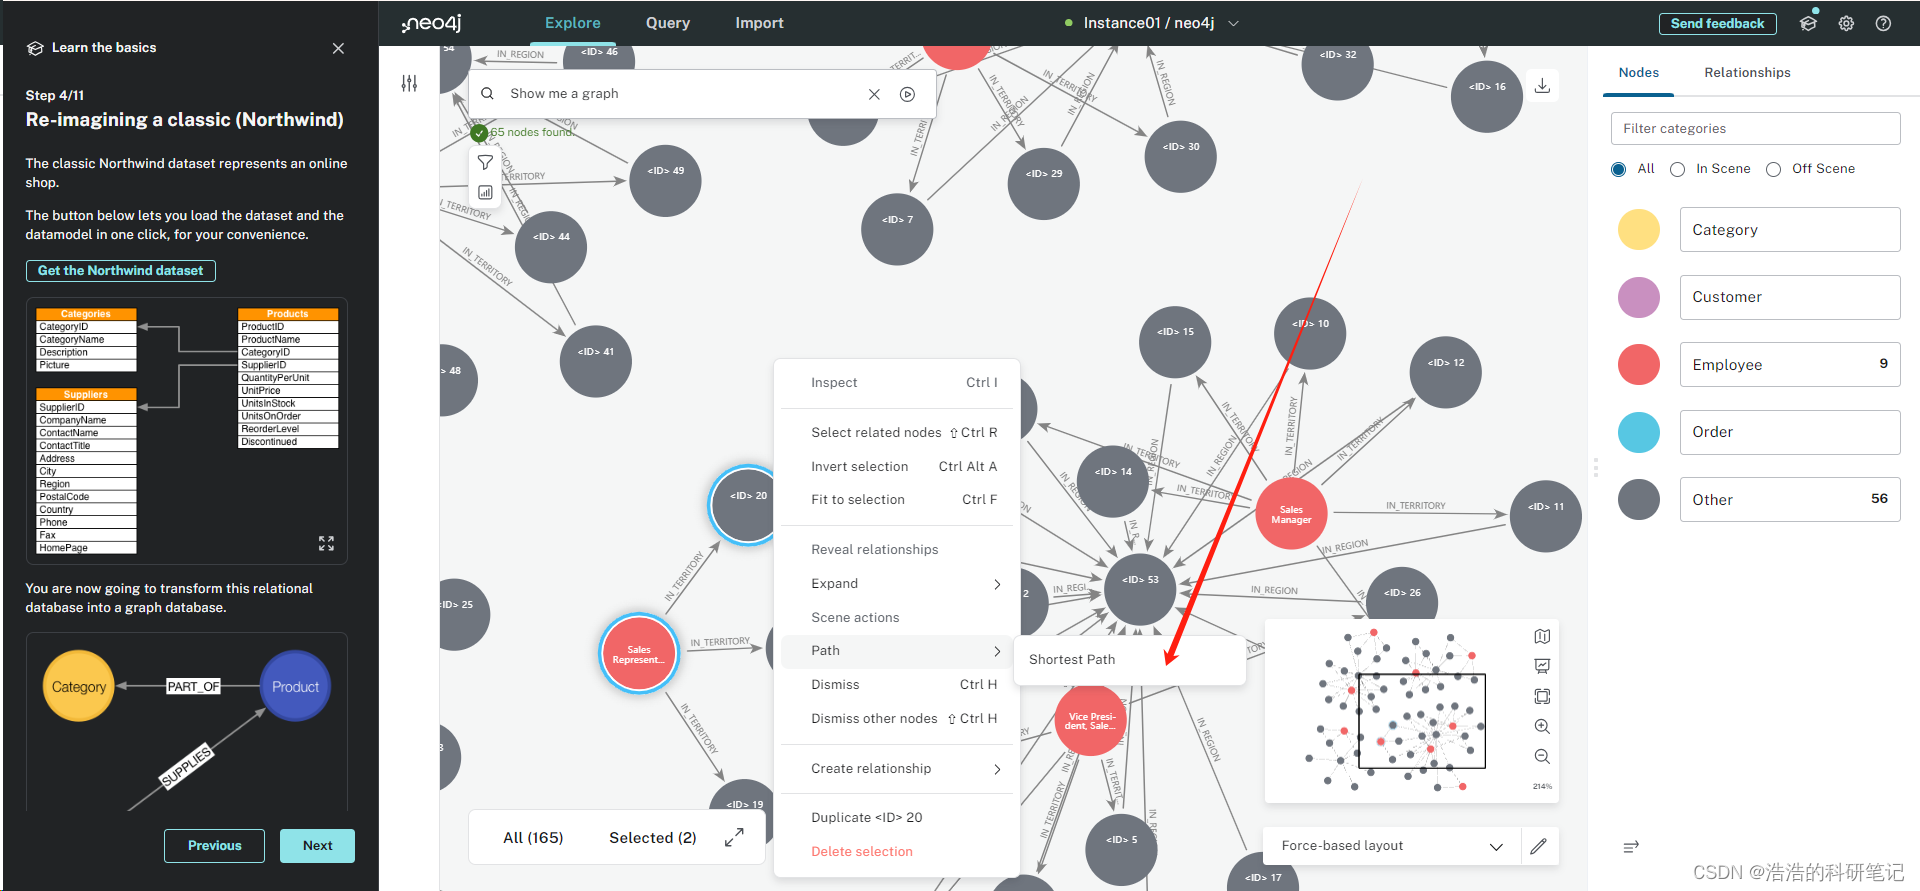
???????Another useful feature is to select two nodes (Ctrl-Click/Cmd-Click) and select Paths → Shortest Path from the right-click context menu on one of them.
???????另一個有用的特性是按住ctrl選擇兩個節點,然后后右鍵的菜單中選擇path,然后選擇Shortest Path最短路徑。(右鍵的時候鼠標要在節點上,然后點了Shortest Path其實也無事發生,就閃了兩下比較雞肋)
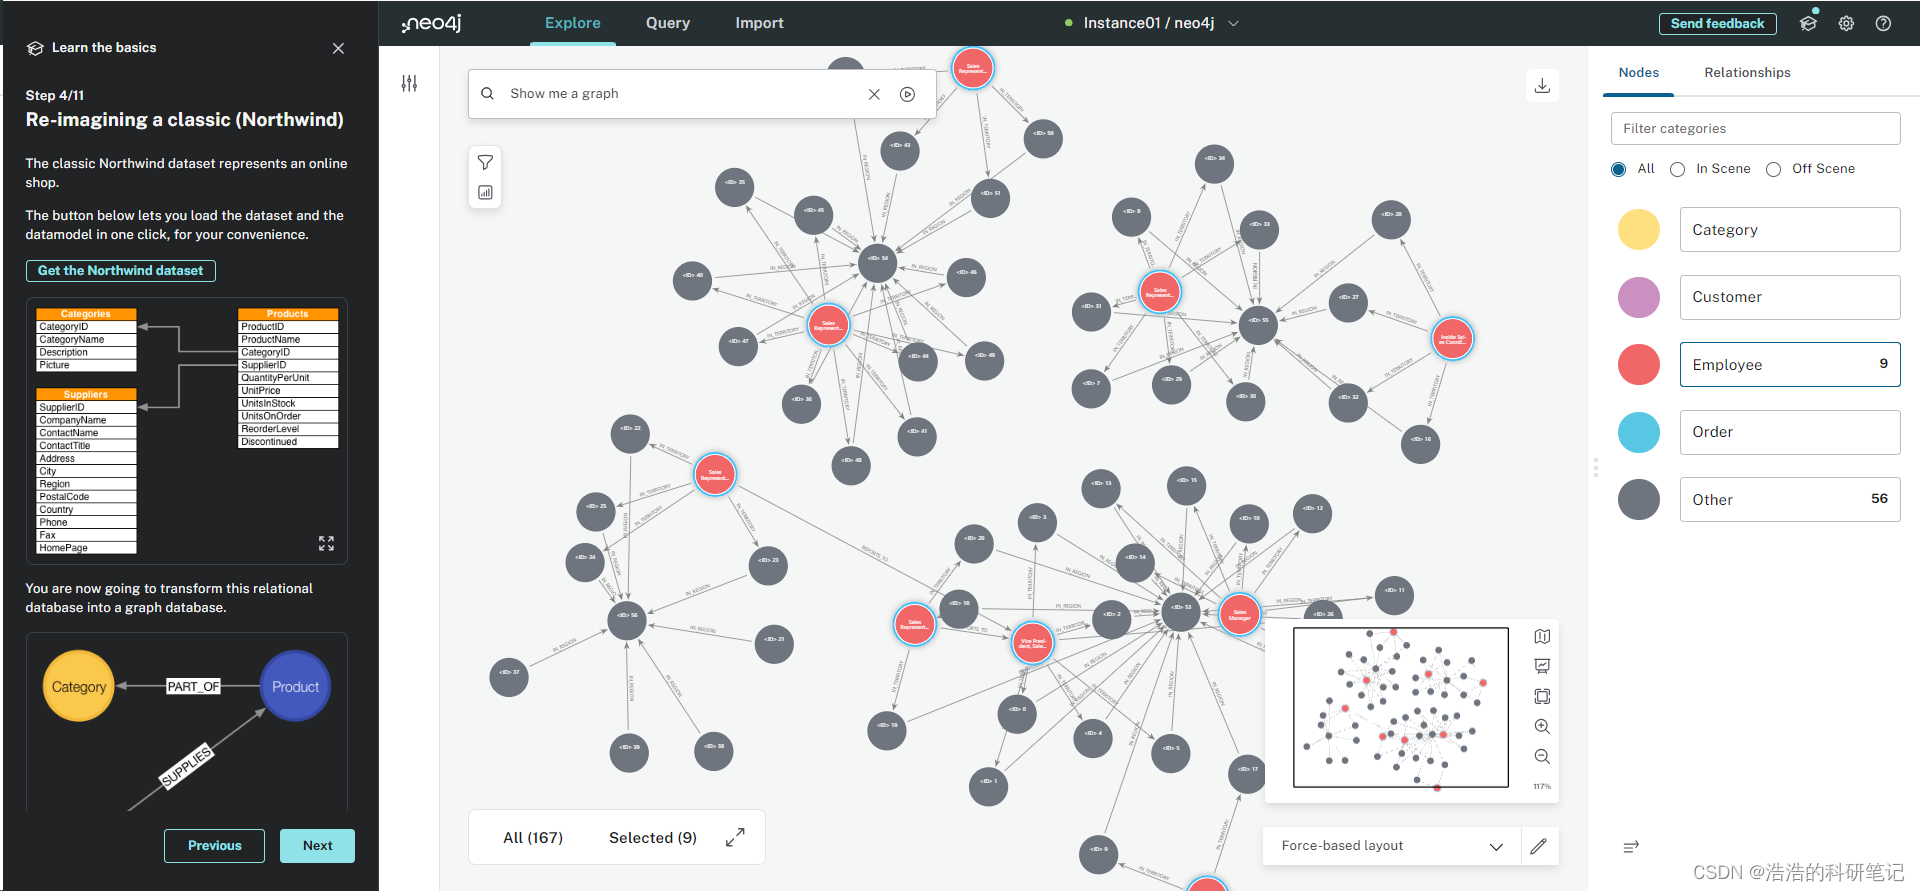
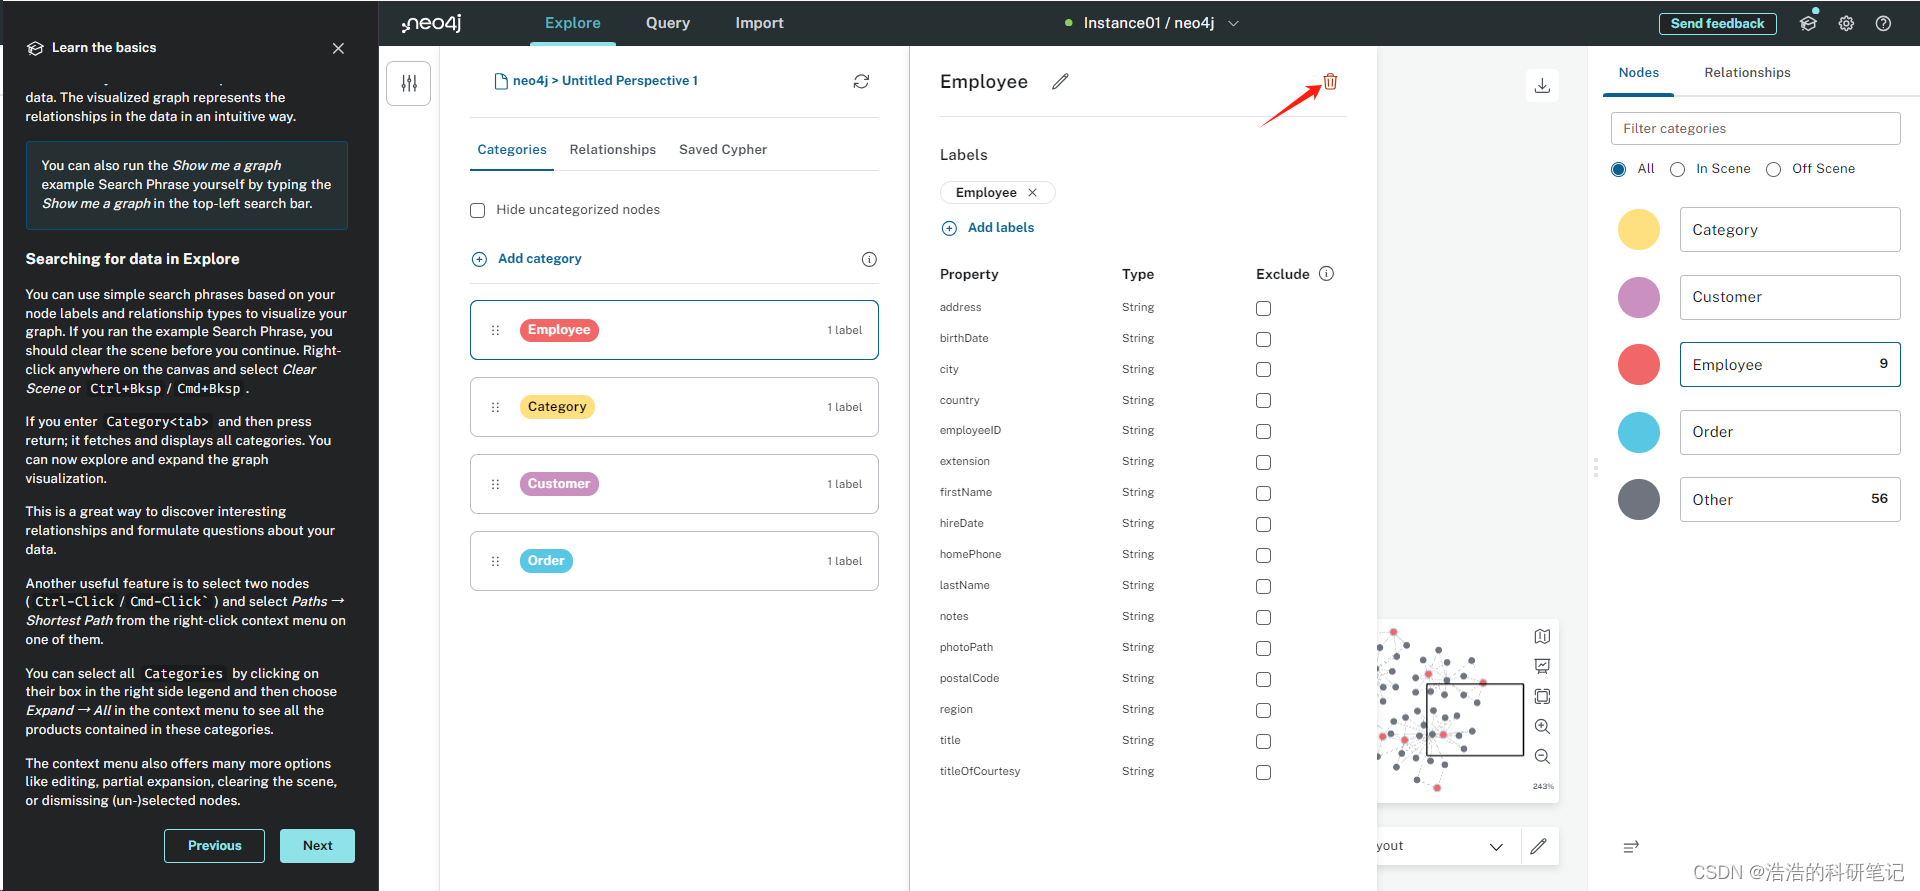
???????You can select all Categories by clicking on their box in the right side legend and then choose Expand → All in the context menu to see all the products contained in these categories.
???????你可以用過右側的框內看到所有類別,然后點擊這個類別就可以看到這個類別的提示。

???????The context menu also offers many more options like editing, partial expansion, clearing the scene, or dismissing (un-)selected nodes.
???????上下文菜單還提供了許多選項,如編輯、部分展開、清除場景或取消(取消)所選節點。(我理解他指的上下文菜單應該是這里,右上角可以刪除節點)
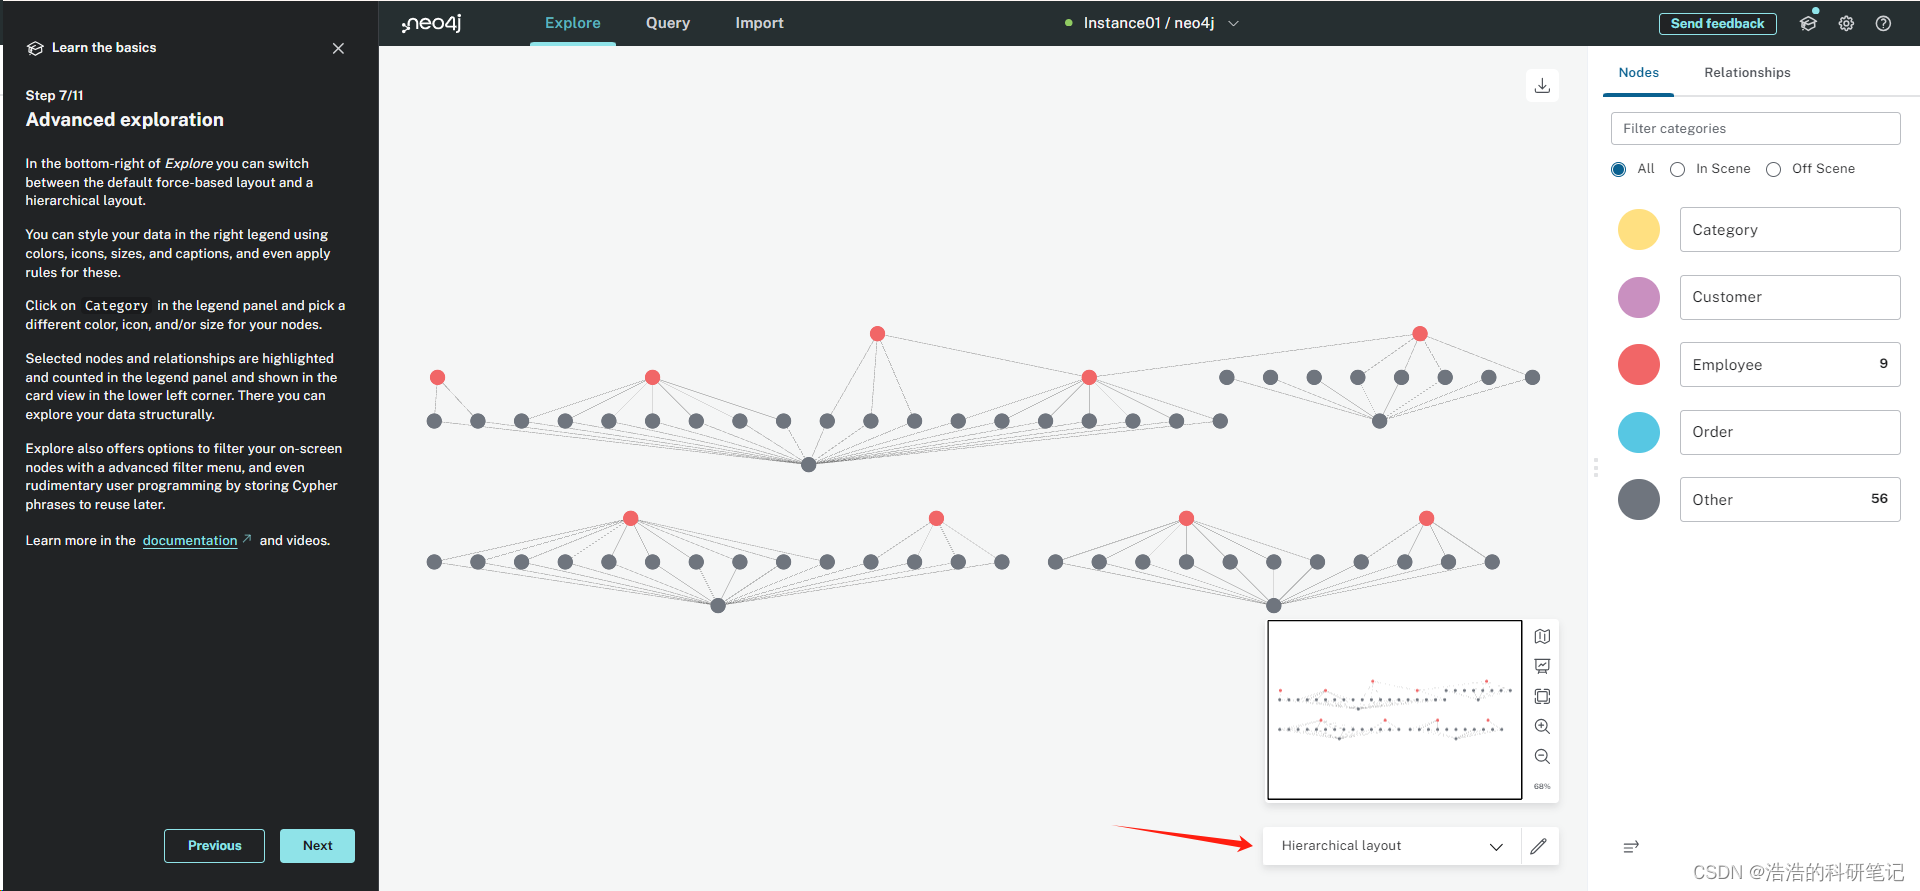
7. Advanced exploration 先進的展示
???????In the bottom-right of Explore you can switch between the default force-based layout and a hierarchical layout.
???????在Explore的右下角,您可以在默認的布局和分層布局之間切換。
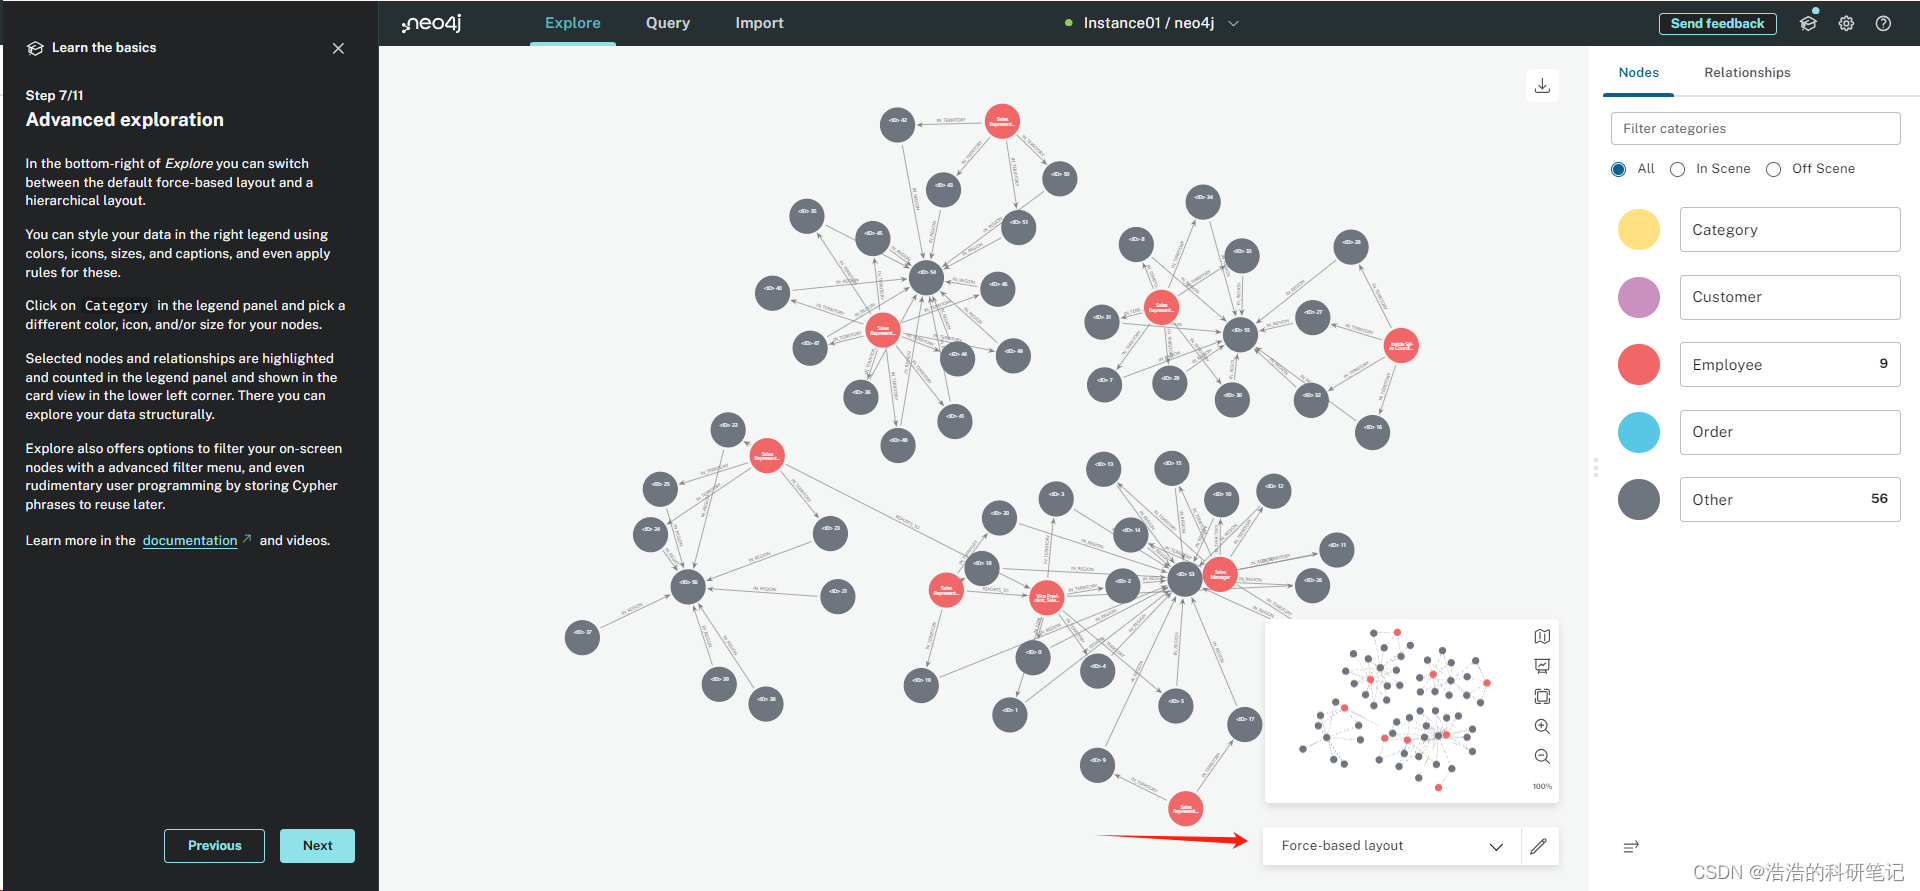
???????You can style your data in the right legend using colors, icons, sizes, and captions, and even apply rules for these.
???????你可以在右側的列表框章設置顏色圖標標題,甚至應用的一些規則。
???????Click on Category in the legend panel and pick a different color, icon, and/or size for your nodes.
???????點擊圖例面板中的Category,為你的節點選擇不同的顏色、圖標和/或大小。

???????Selected nodes and relationships are highlighted and counted in the legend panel and shown in the card view in the lower left corner. There you can explore your data structurally.
???????選擇了節點和關系之后可以高亮對應的元素且后面有計數(只有點后面有數字的它才亮,這句我直接總結歸納了)

???????Explore also offers options to filter your on-screen nodes with a advanced filter menu, and even rudimentary user programming by storing Cypher phrases to reuse later.
???????Explore還提供了使用高級過濾菜單過濾屏幕節點的選項,甚至還提供了通過存儲Cypher短語以供以后重用的基本用戶編程。
8. Basic Querying 基礎查詢
Switch to the Query tab, if you haven’t already done so.
切回查詢頁面Query,如果你還沒切換的話。
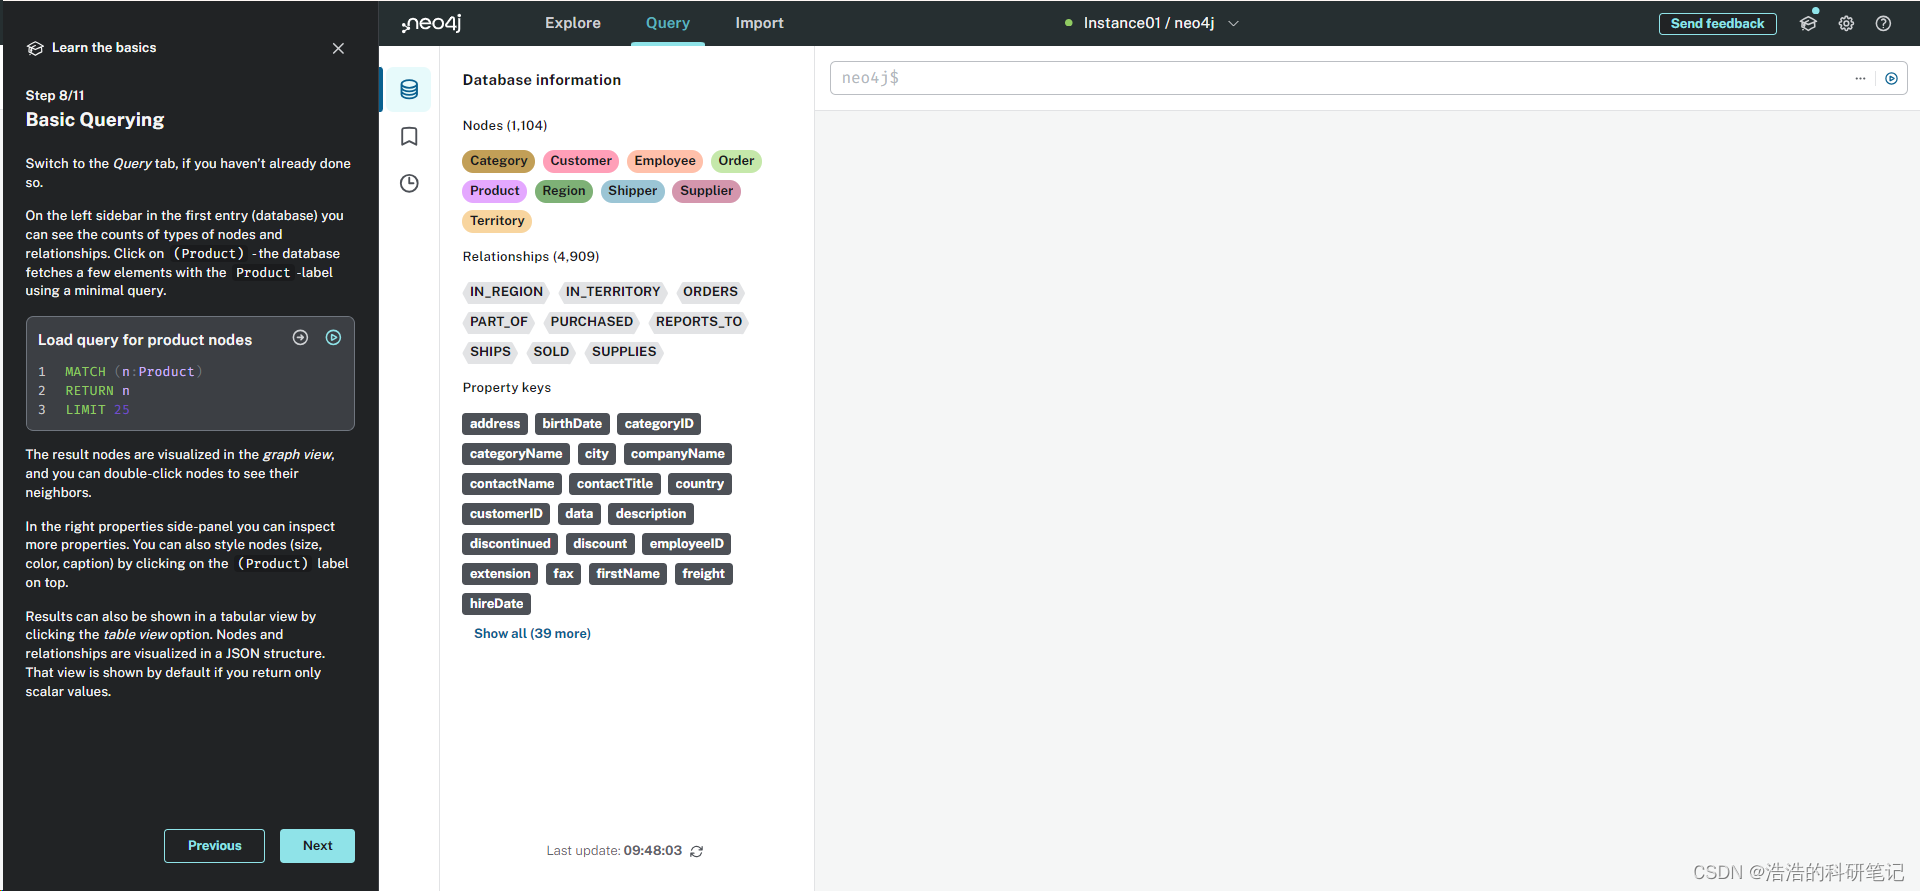
???????In the first entry (database) in the left column, you can see the count of nodes and relationship types. Click on “(Product)” - the database uses a minimal query to get several elements labeled “Product”.
???????在左側欄的第一個條目(數據庫)中,可以看到節點和關系類型的計數。點擊“(Product)”——數據庫使用一個最小的查詢獲取帶有“Product”標簽的幾個元素。
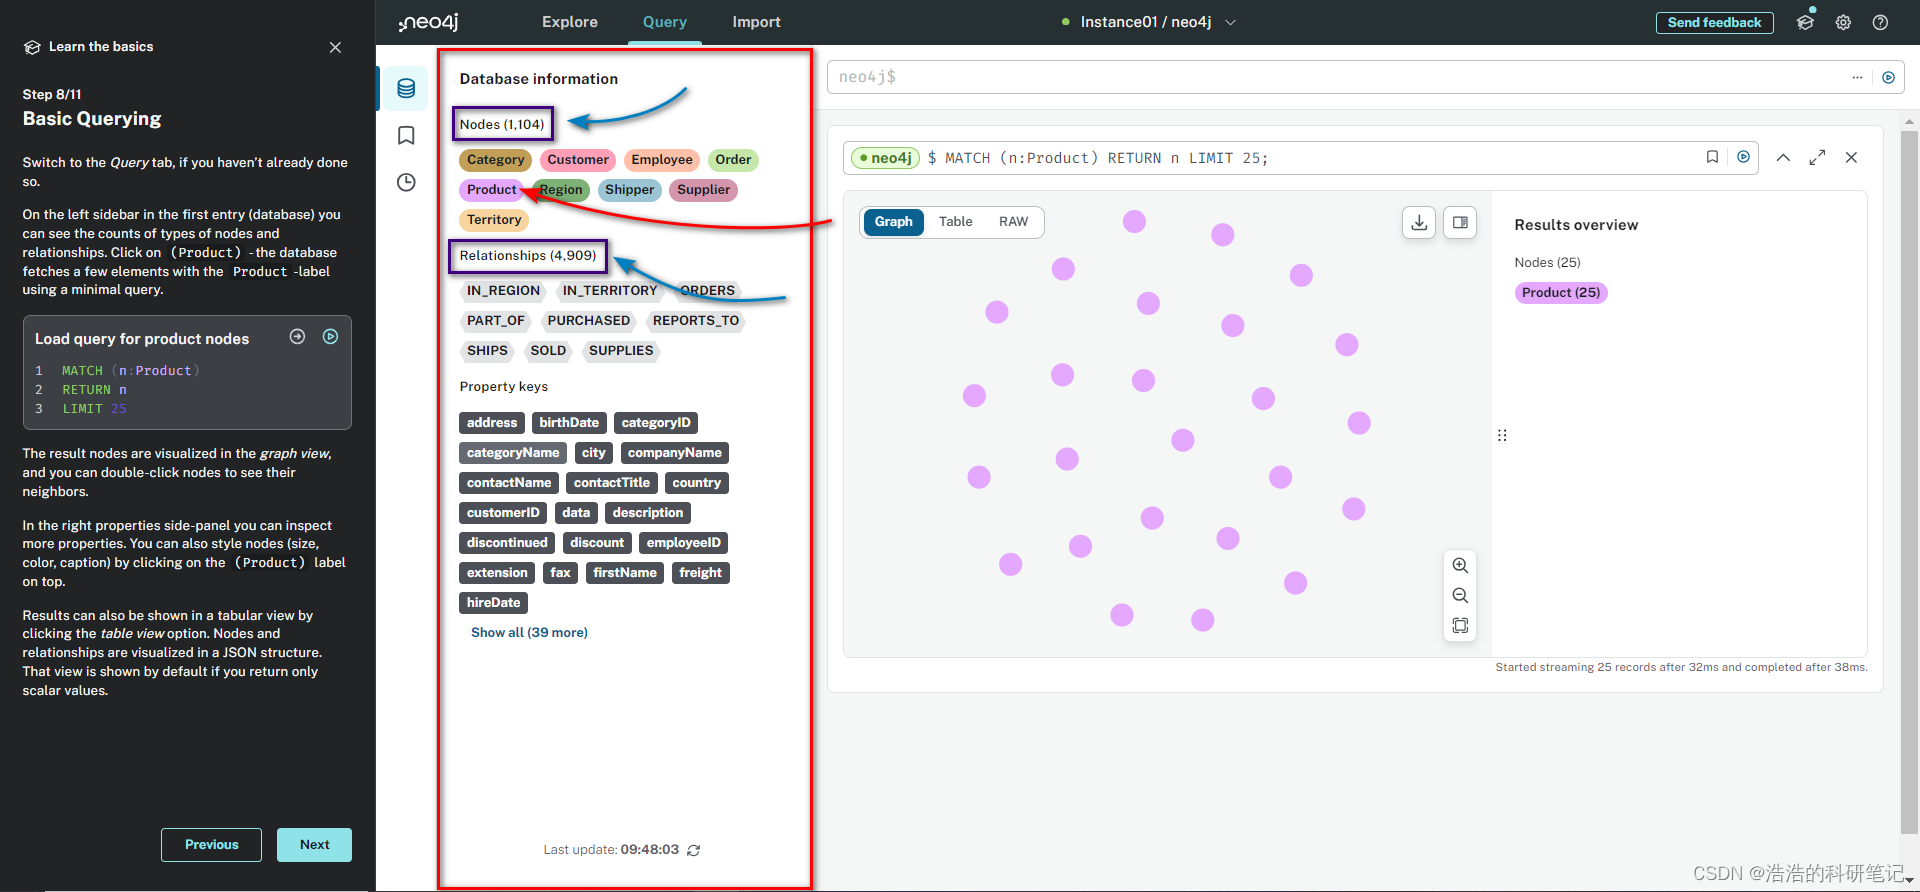
MATCH (n:Product)
RETURN n
LIMIT 25
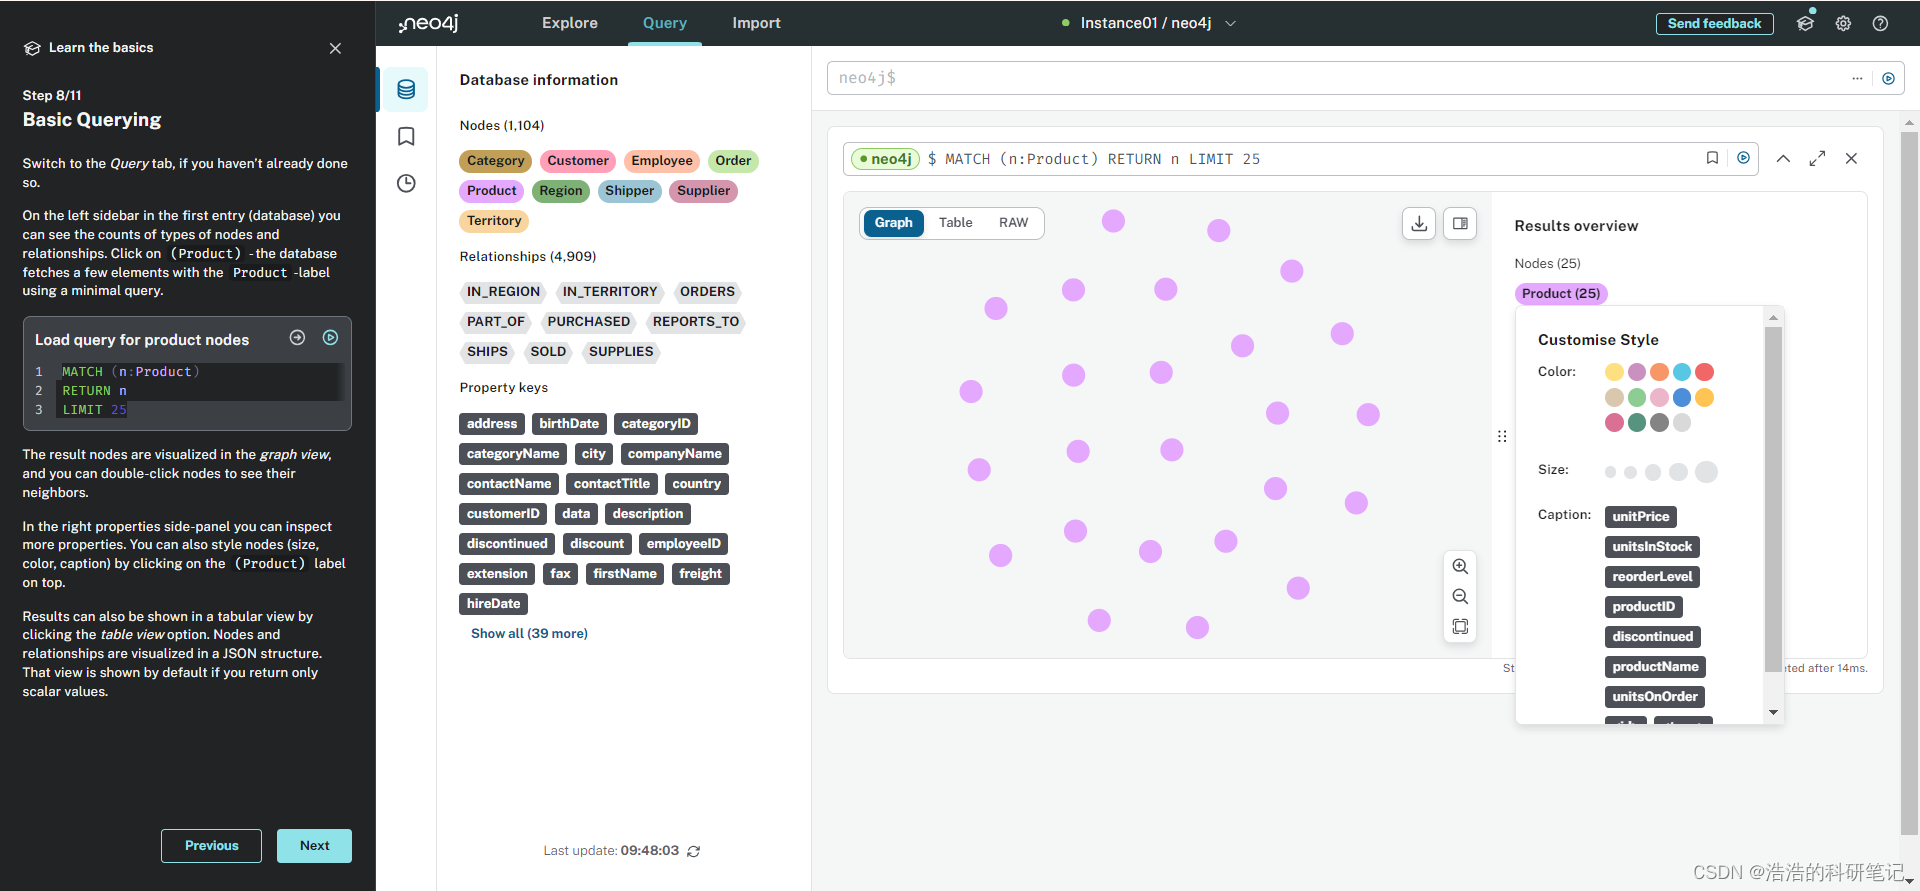
???????The result nodes are visualized in the graph view, and you can double-click nodes to see their neighbors.
???????結果節點顯示在Graph中,可以通過雙擊節點來查看它們的臨近的節點。
???????In the right properties side-panel you can inspect more properties. You can also style nodes (size, color, caption) by clicking on the (Product) label on top.
???????在右側是屬性滑動窗口中,你可以查看更多的屬性,也可以通過點擊窗口中的Pruduct自定義節點的尺寸顏色標題
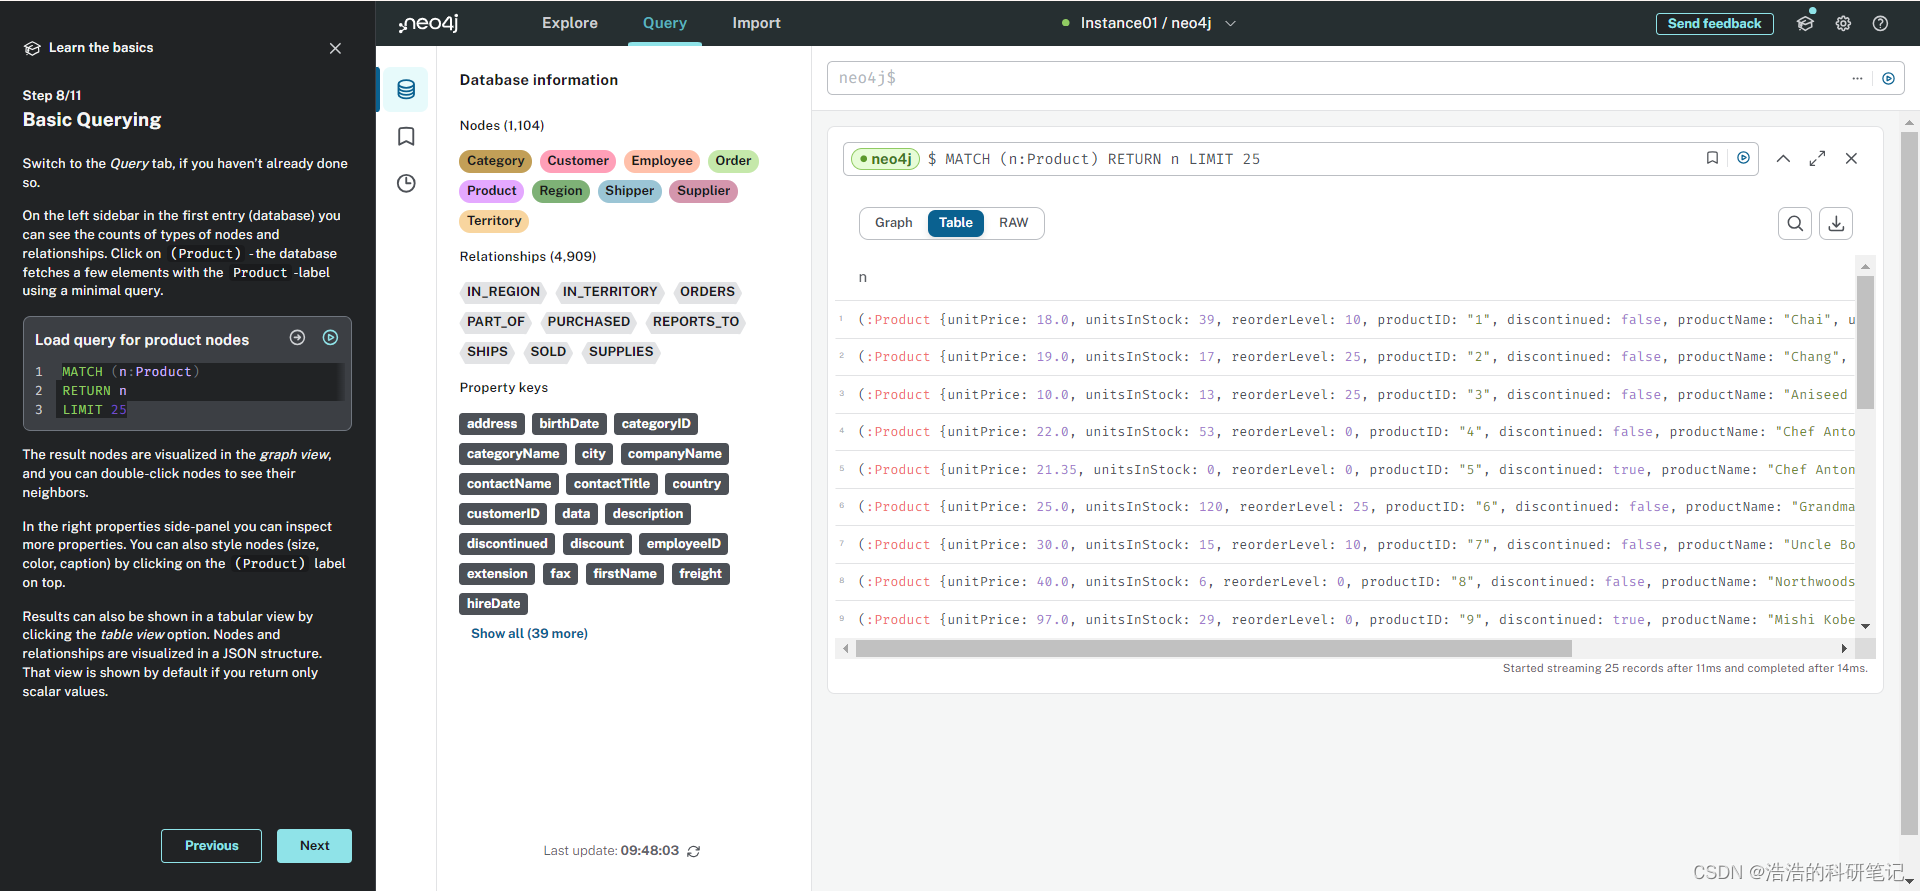
???????Results can also be shown in a tabular view by clicking the table view option. Nodes and relationships are visualized in a JSON structure. That view is shown by default if you return only scalar values.
???????還可以通過單擊table view選項在表格視圖中顯示結果。節點和關系在JSON結構中可視化。如果只返回標量值,則默認顯示該視圖。
9. Writing your first query 寫你的第一個查詢
???????Like any other database, Neo4j can be queried with a query language.
???????就像其他數據庫一樣,Neo4j依舊有一個查詢語言。
???????Neo4j’s graph query language is called Cypher and is very well-suited for finding patterns. Unlike SQL, there is no reliance on writing complex joins
???????Neo4j’s 圖查詢語言叫 Cypher 并且其非常合適用于尋找模型。不像SQL,其并不依賴于編寫復雜鏈接。
???????In Cypher, you represent the graph patterns that you’ve seen in Import and Explore with ascii-art.
???????在 Cypher 中, 你可以用ascii-art表示你在Import和Explore中看到的圖形模式。
ASCII藝術是一種利用ASCII字符集中的字符進行創作,通過排列組合這些字符來構造出圖像或文本視覺表現的計算機藝術形式。
???????Parentheses (p:Product {name:'Camembert Pierrot'}) form “circles” around nodes and arrows -[:SUPPLIES]-> depicts relationships.
???????圓括號(p:Product {name:'Camembert Pierrot'})在節點周圍形成“圓圈”,箭頭-[:SUPPLIES]->表示關系。
???????You draw in text what you would draw on the whiteboard.
???????用文本畫圖和你在白板上畫圖一樣。
???????These patterns are used to find, create, and update graph data.
???????這種模式被用于取創造更新和查找數據。
???????You’ve already seen the MATCH (n:Product) RETURN n LIMIT 25 statement that was run previously.
???????你以及看過MATCH (n:Product) RETURN n LIMIT 25指令之前跑出來的效果
???????Now click on the statement to edit it and change the pattern and result to:
???????現在點擊語句進行編輯,并將模式和結果更改為:
MATCH (n:Product)<-[r:SUPPLIES]-(s:Supplier)
RETURN n,r,s
LIMIT 25
Congratulations, you’ve written and run your first Cypher query!
恭喜你你完成了第一個Cypher 查詢。
10. A more advanced query更高級的查詢
For the last part of this guide you get the opportunity to try some more powerful queries.
最后一部分會知道你有機會去嘗試一些更高級的查詢。
First, this query finds all products ordered by a customer and who supplies them.
首先,該查詢查找客戶訂購的所有產品及其供應商。
MATCH path=(c:Customer)-[:PURCHASED]->()-[:ORDERS]->(:Product)<-[:SUPPLIES]-(:Supplier)
WHERE c.companyName = 'Blauer See Delikatessen'
RETURN path;
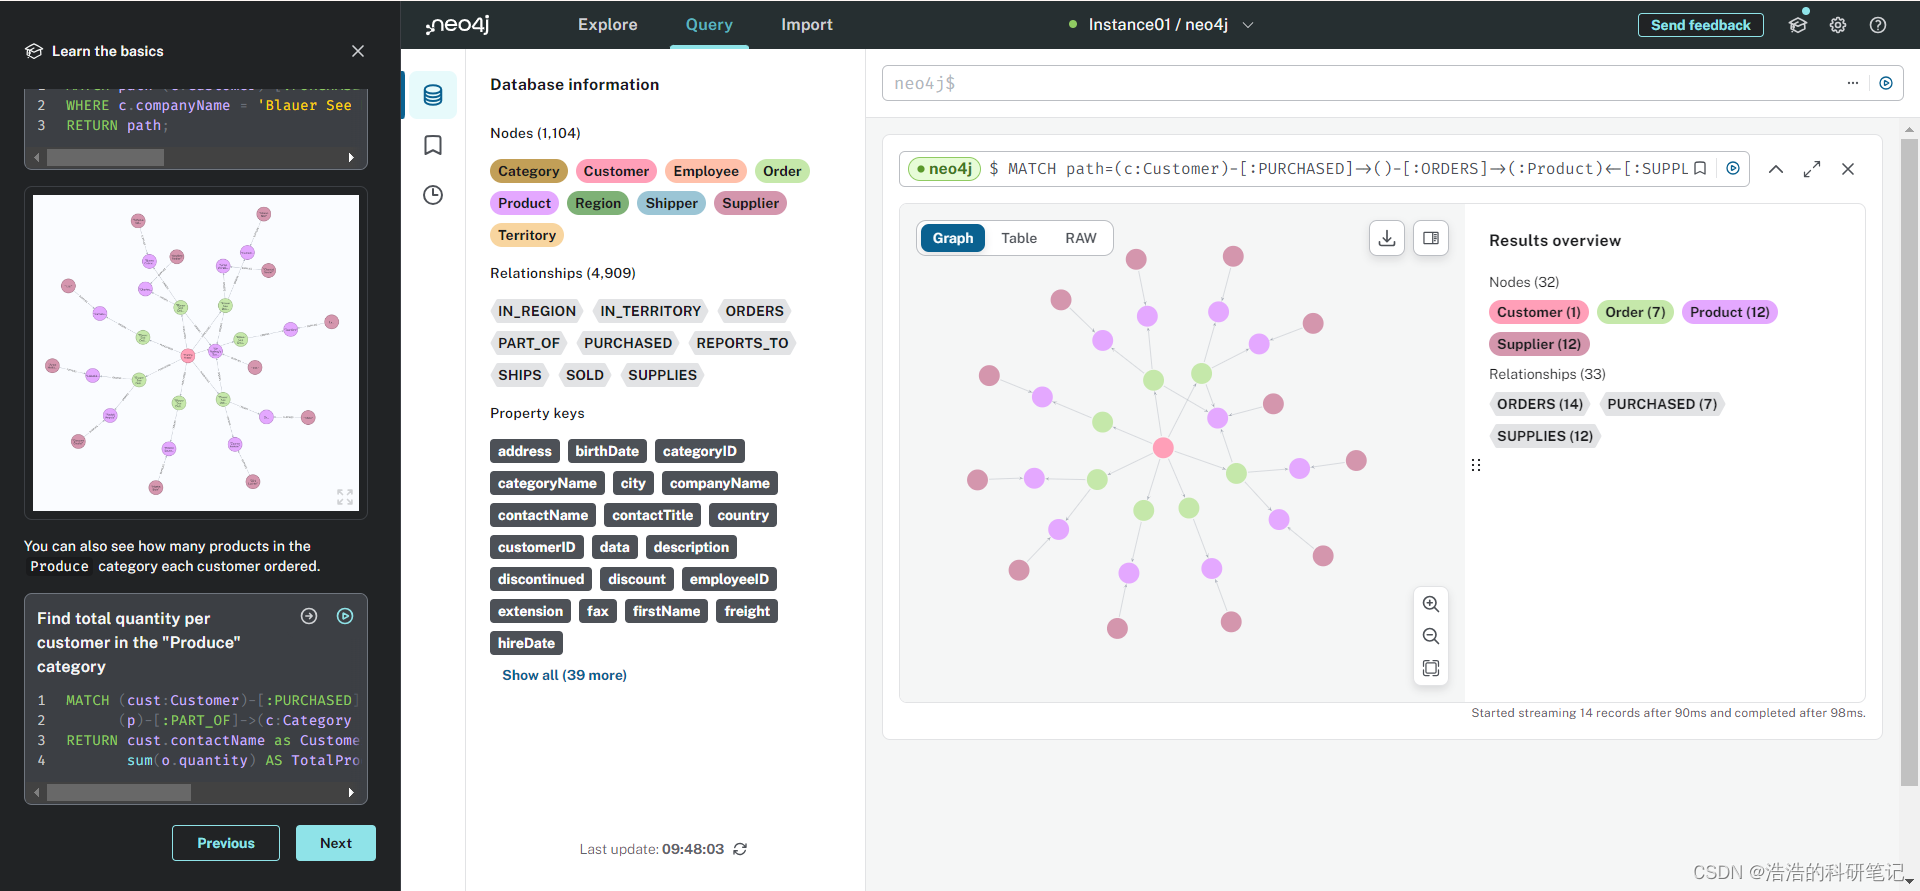
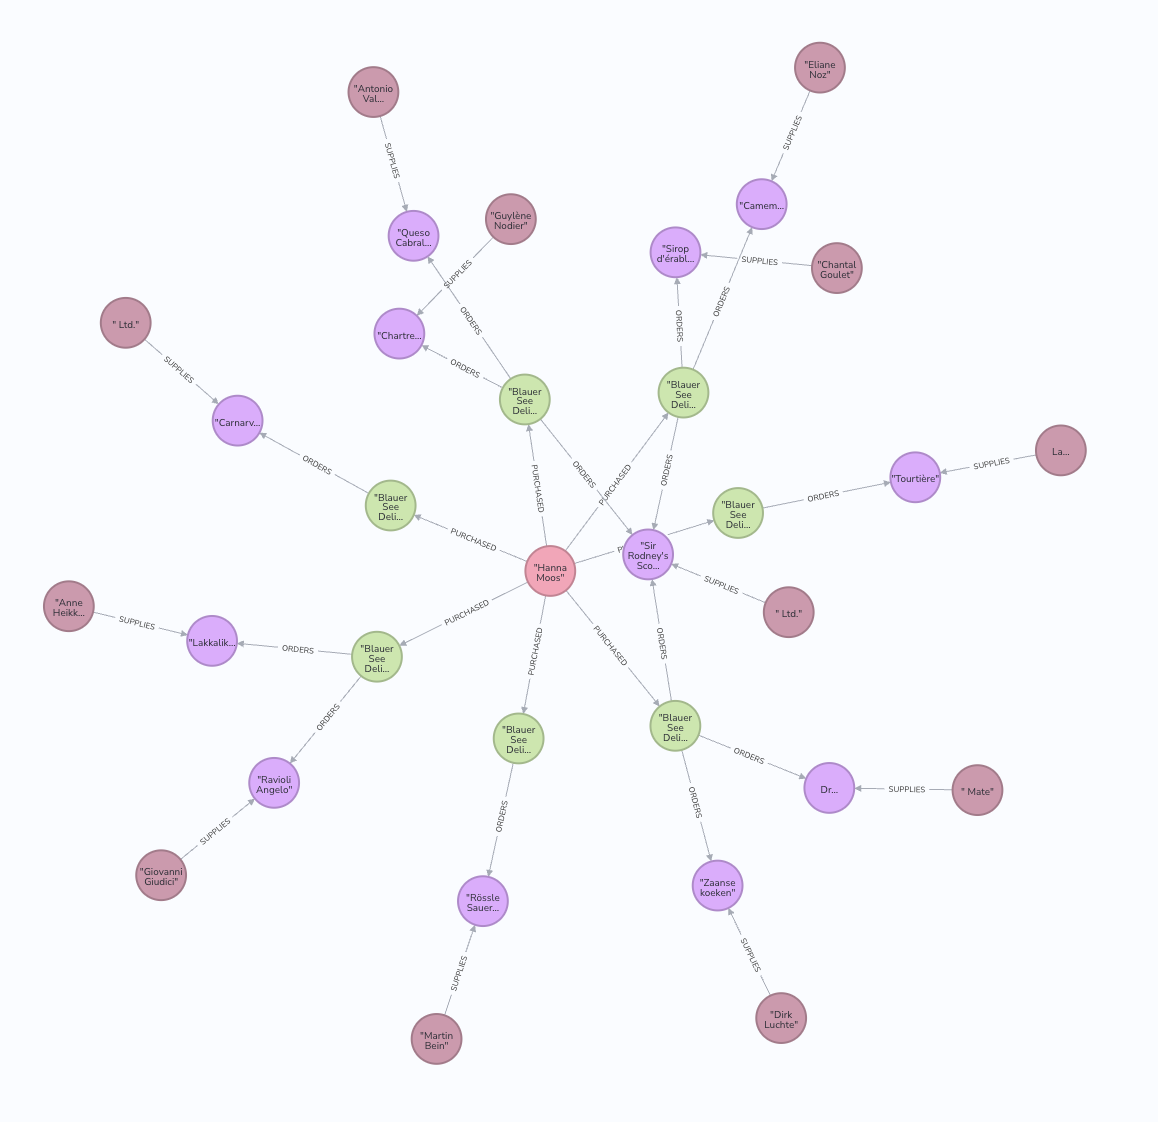
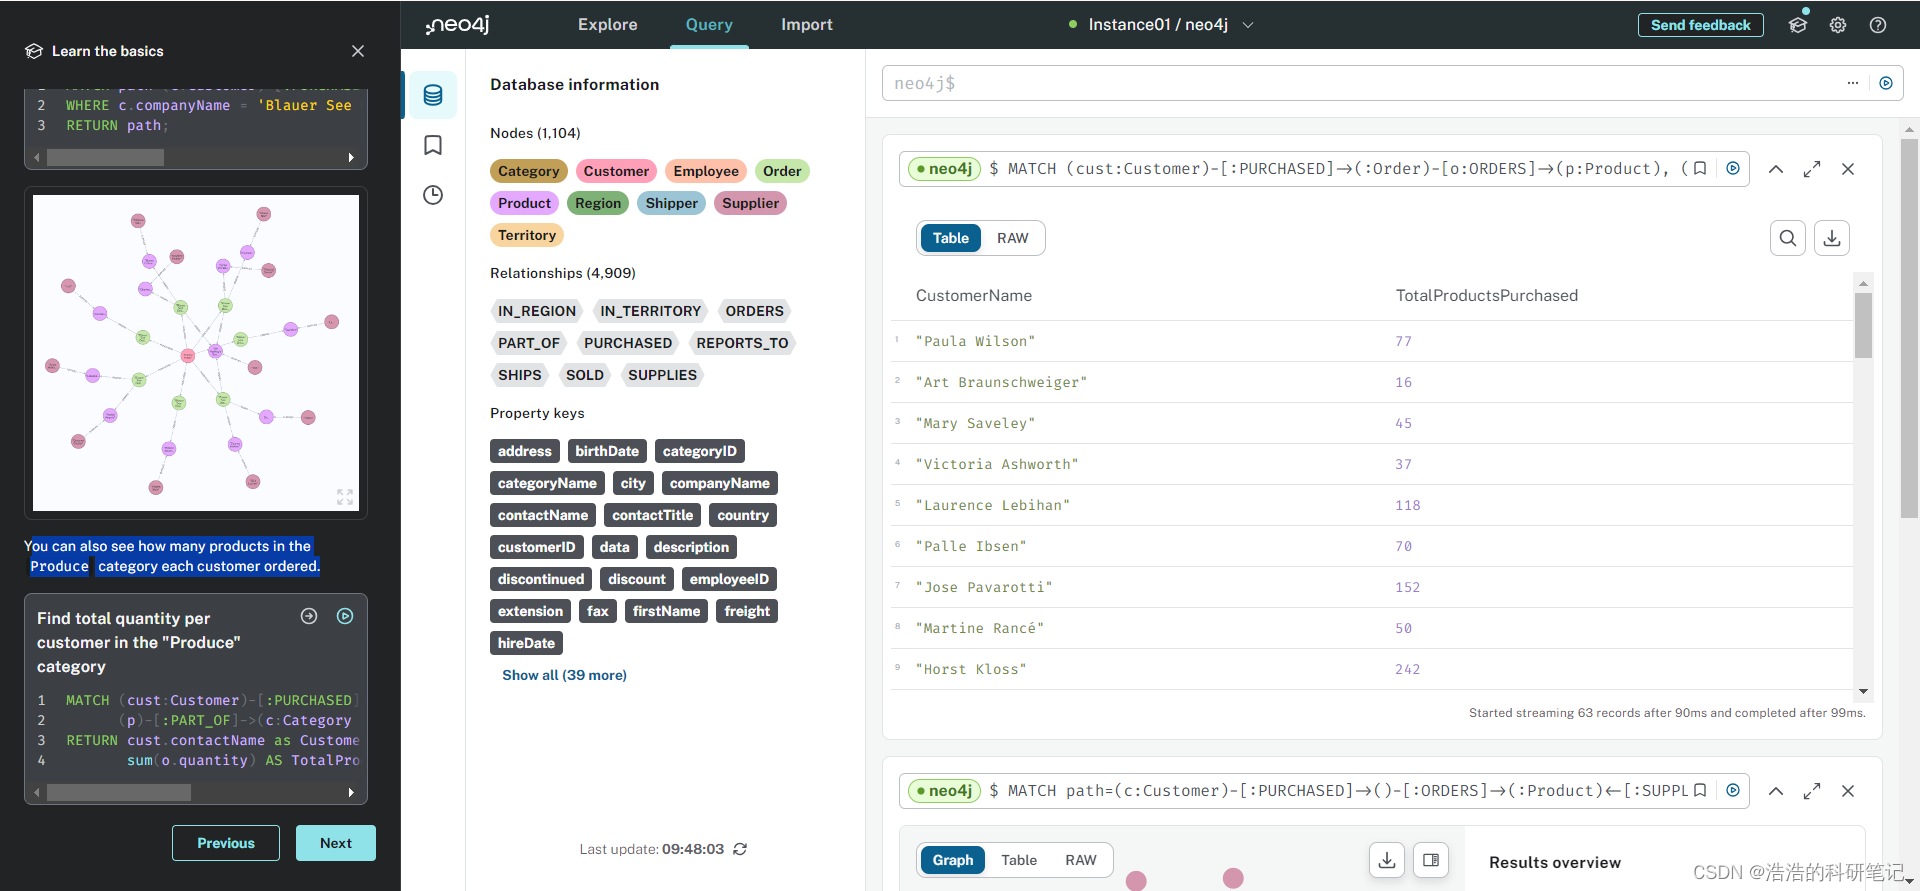
you can also see how many products in the Produce category each customer ordered.
您還可以看到每個客戶訂購了“農產品”類別中的產品數量。
11. Next steps 下一步
Congratulations on completing this tutorial.
祝賀你完成了本教程
???????You can do more with the Northwind dataset or you can reset your instance in AuraDB Console and import your own data.
???????您可以使用Northwind數據集做更多的事情,或者您可以在AuraDB Console中重置實例并導入您自己的數據。
???????For your next steps, a suggestion is to look at furthering your Cypher knowledge or building an application using Neo4j’s popular language drivers.
???????對于接下來的步驟,建議您進一步了解Cypher知識或使用Neo4j的流行語言驅動程序構建應用程序。
11.1 Next steps with Cypher 關于Cypher語言的下一步
To learn more about Cypher, check out the interactive GraphAcademy course
為了進一步了解Cypher,可以看一下這個圖學術課程
https://graphacademy.neo4j.com/categories/beginners/
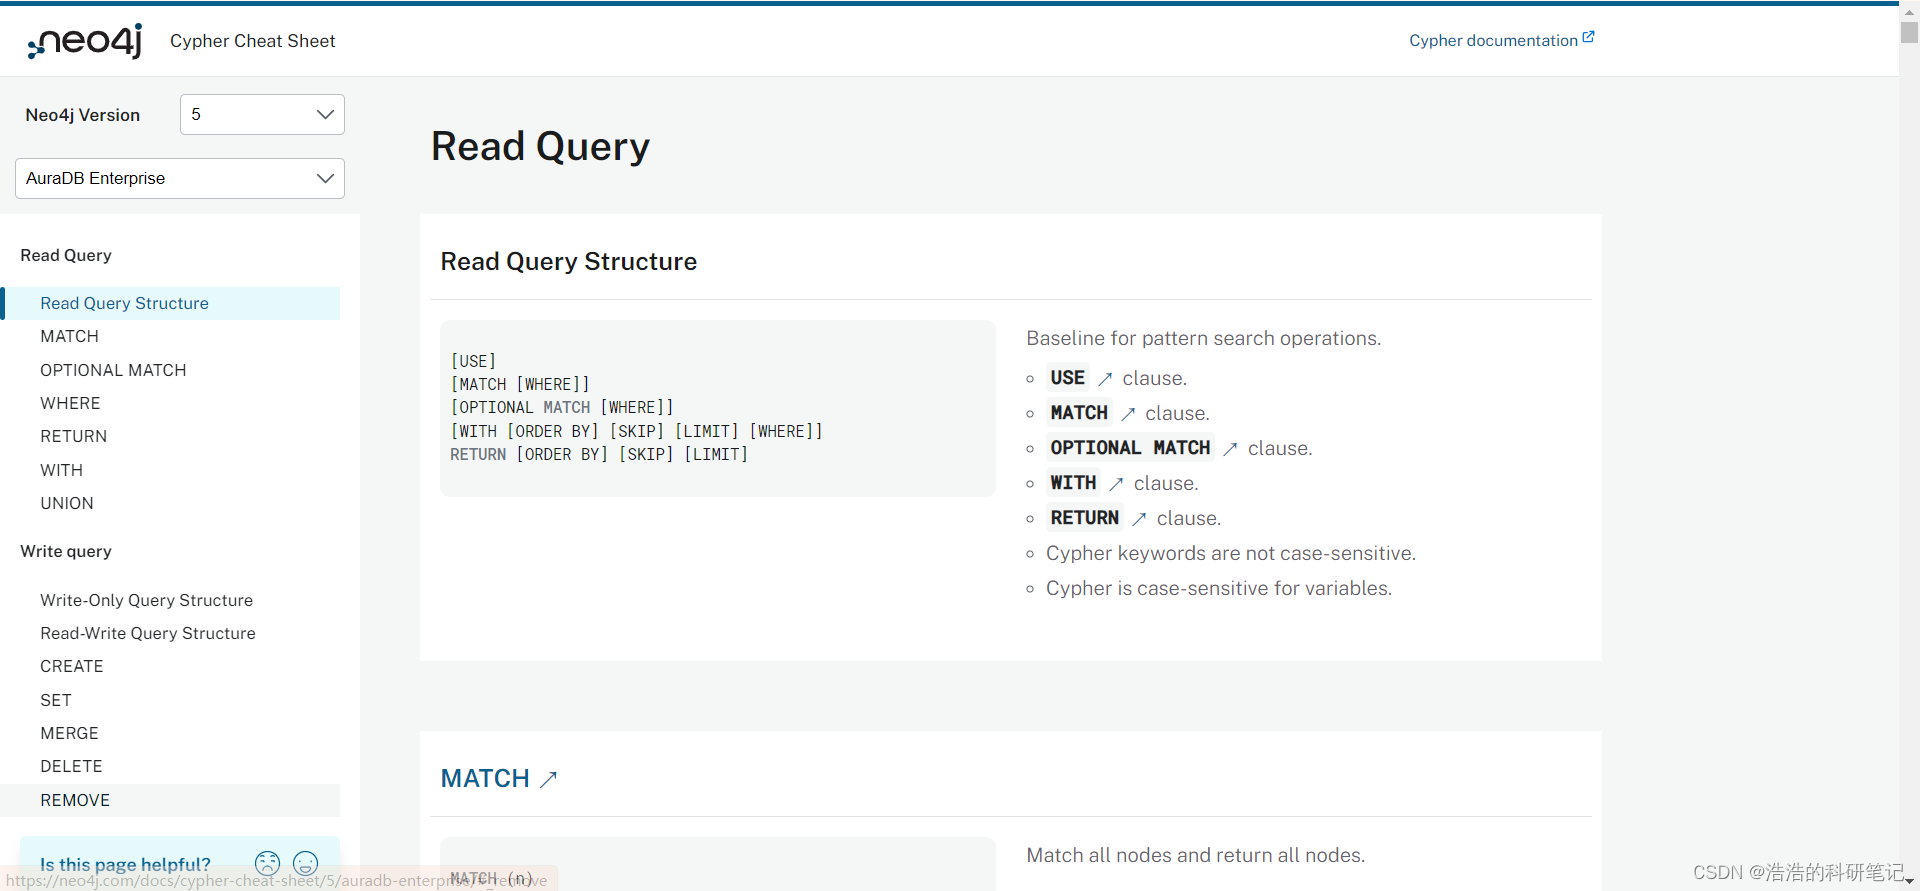
and have a look at the Cypher Cheat Sheet
還有這個 Cypher Cheat Sheet
11.2 Creating applications 創建應用
???????As you get more familiar with Cypher, you can use the
???????如果你已經熟悉了Cypher,你可以使用 C#, Go, Java, JavaScript, and Python 語言構建您的應用
or use our GraphQL or Spring Data Neo4j integrations for building APIs.
或者使用我們的GraphQL或Spring Data Neo4j集成來構建APIs。
https://docs.spring.io/spring-data/neo4j/reference/
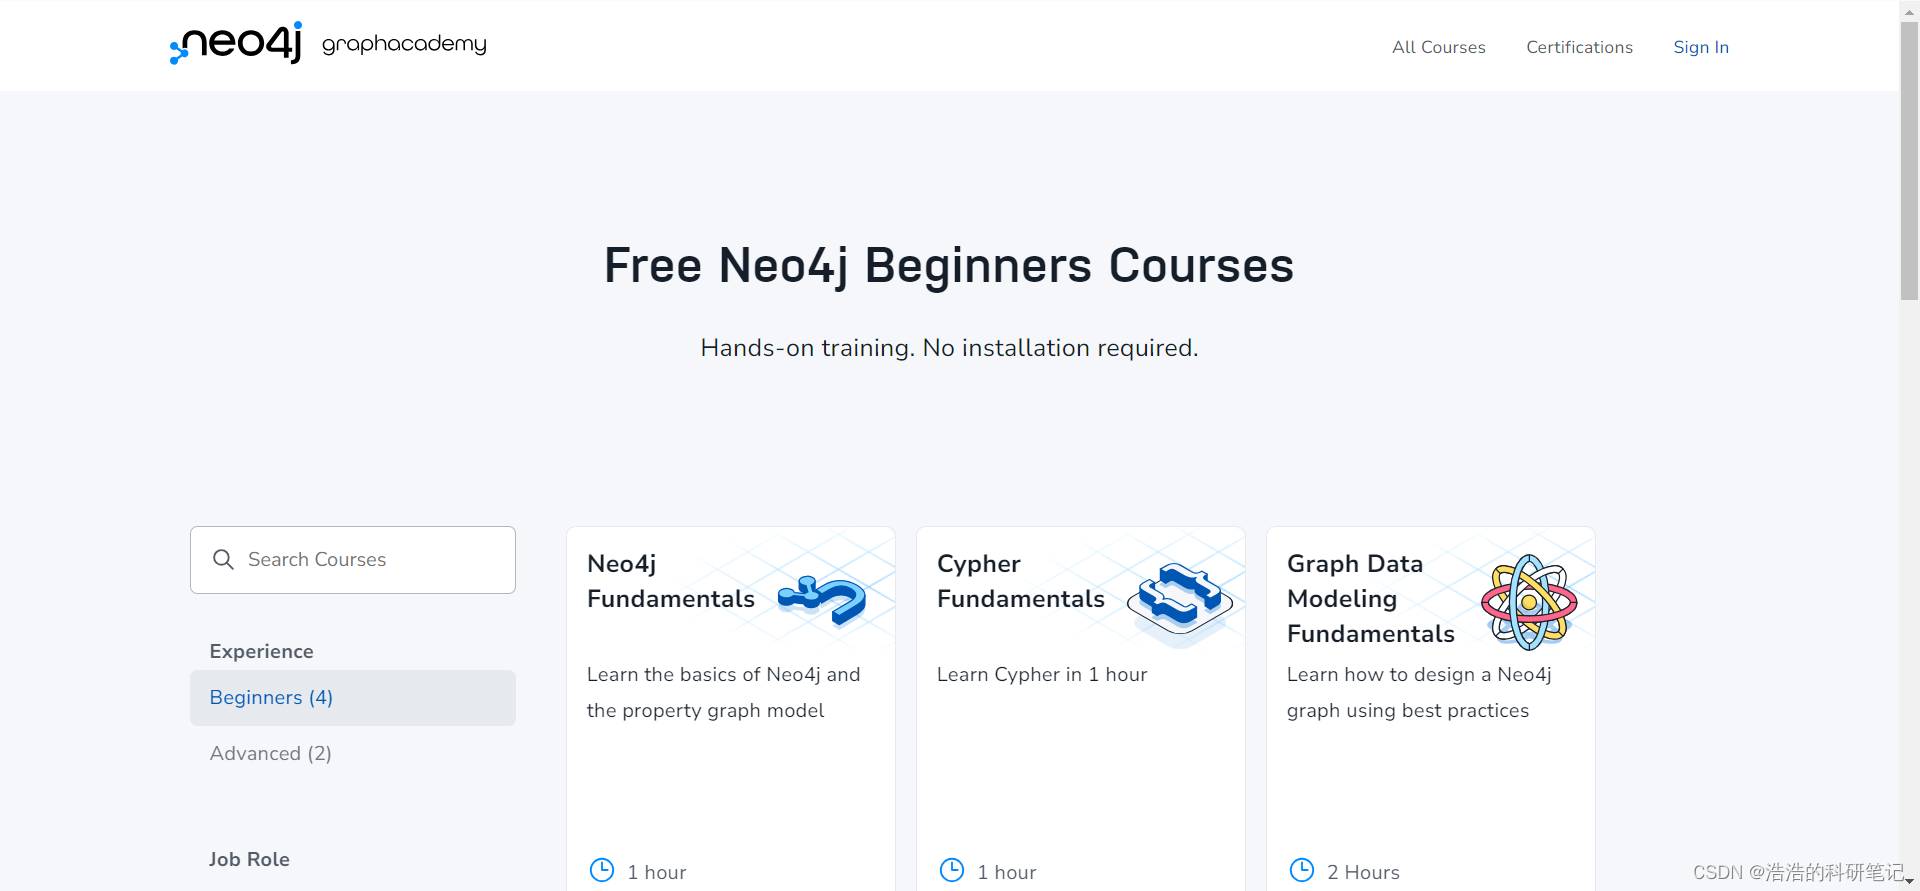
11.3 Go further with GraphAcademy 在GraphAcademy上更近一步
???????GraphAcademy is provided by Neo4j and offers in-depth courses on many aspects of graph databases. Check out the GraphAcademy website
???????GraphAcademy由Neo4j提供,提供關于圖數據庫許多方面的深入課程。請查看 GraphAcademy網站
https://graphacademy.neo4j.com/

教程中給出的網站匯總
GraphAcademy course https://graphacademy.neo4j.com/categories/beginners/
Cypher Cheat Sheet https://neo4j.com/docs/cypher-cheat-sheet/5/auradb-enterprise/
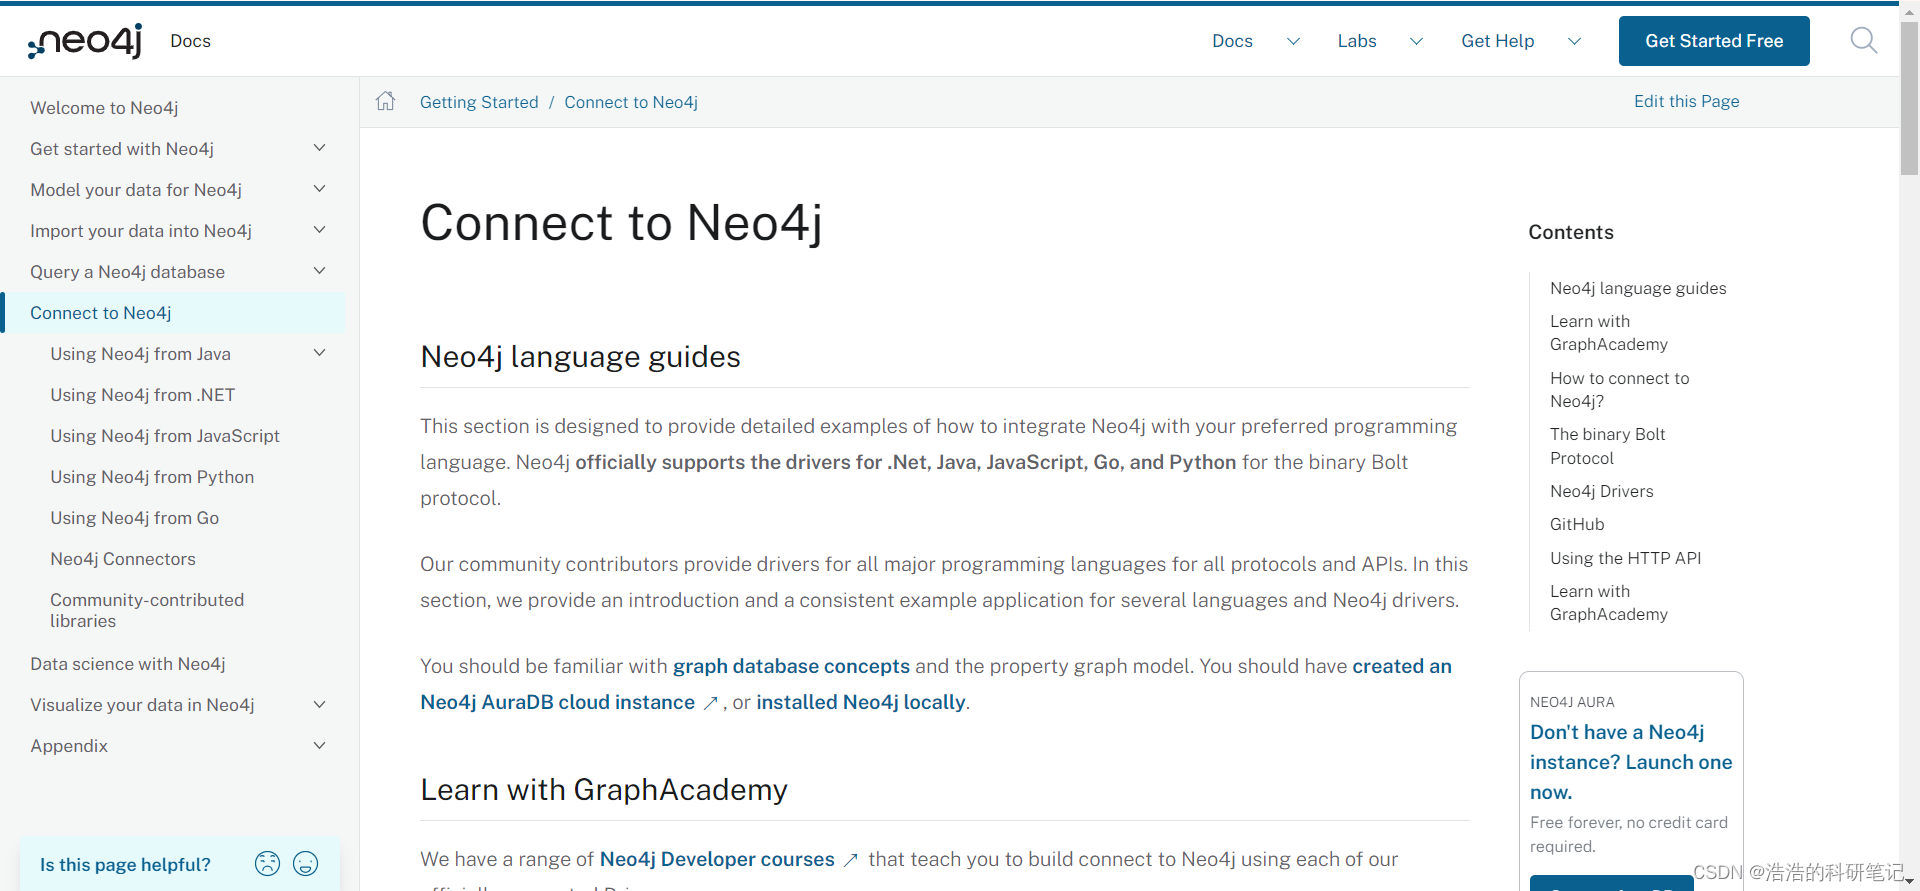
Neo4jAPI https://neo4j.com/docs/getting-started/languages-guides/
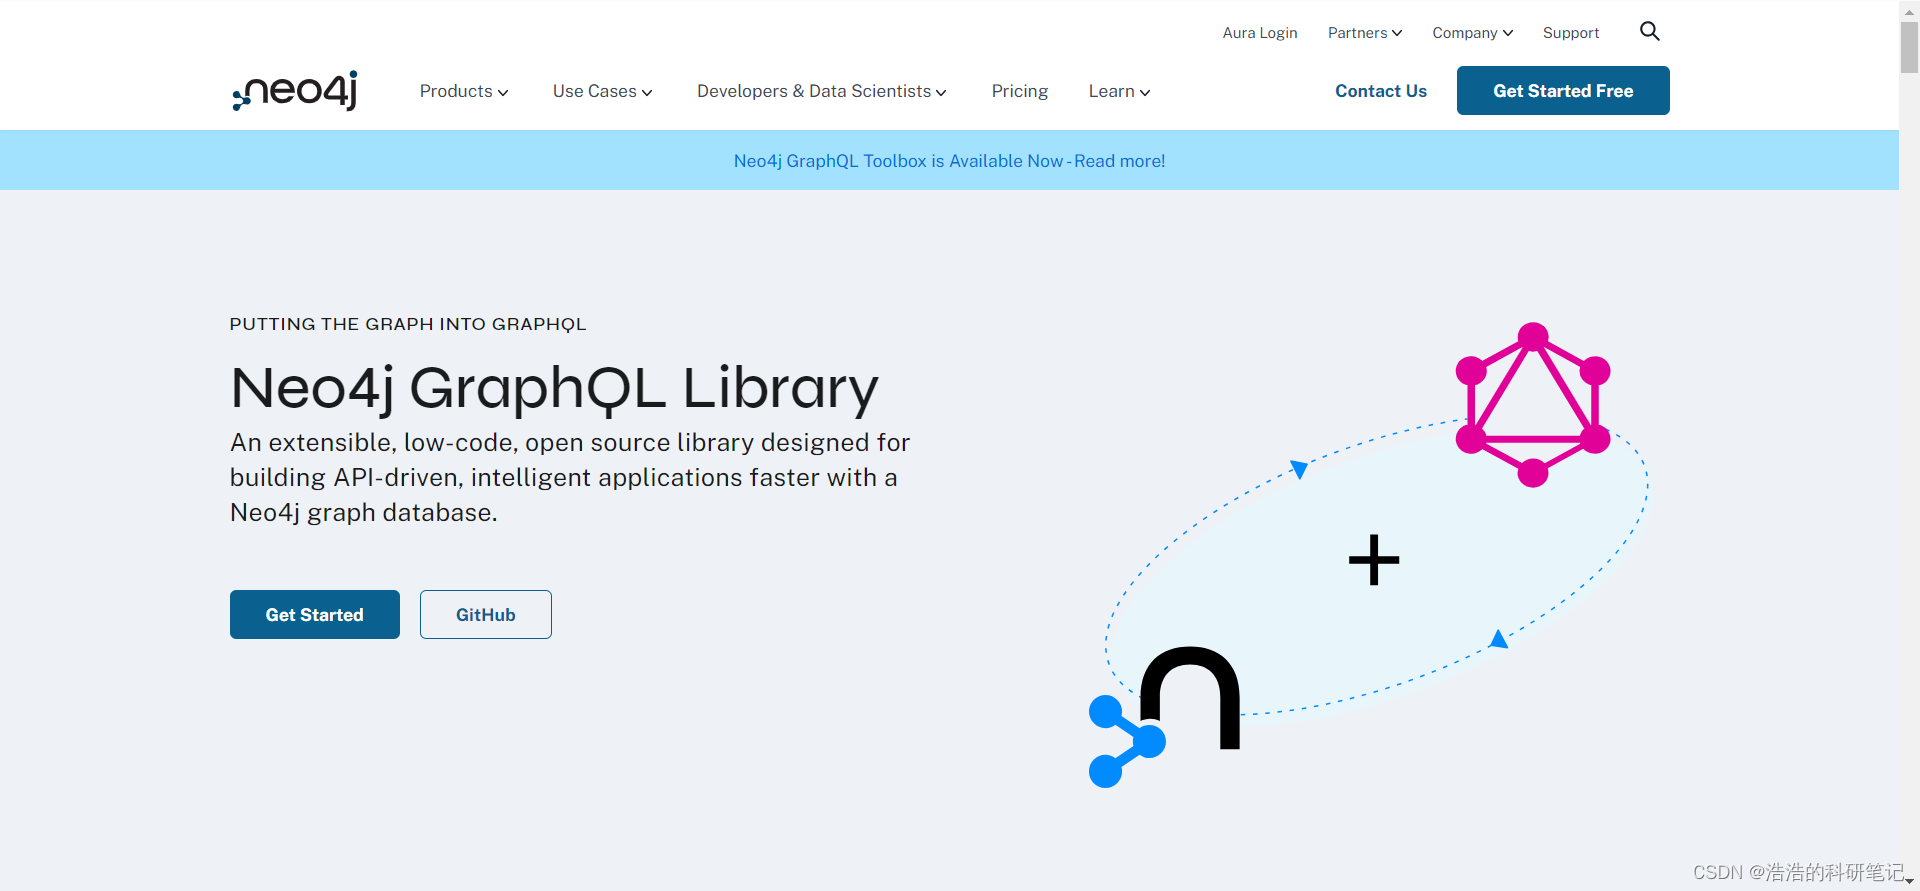
GraphQLhttps://neo4j.com/product/graphql-library/
Spring Data Neo4jhttps://docs.spring.io/spring-data/neo4j/reference/
GraphAcademyhttps://graphacademy.neo4j.com/
結束
???????反正知識圖譜這個東西了解基本概念不難,學起來反正不是很容易,也希望各位不要灰心,看了半天啥也不明白是非常正常的情況,接下來一段時間內我應該會更新大模型和知識圖譜的相關內容,積極分享。

)


)


)
求解23個基準函數)


)


