前言
內存被踩,通過 watchpoint 找到真兇
實例
以 smsc911x 網卡驅動為基體,進行實驗,和網卡本身功能無關,
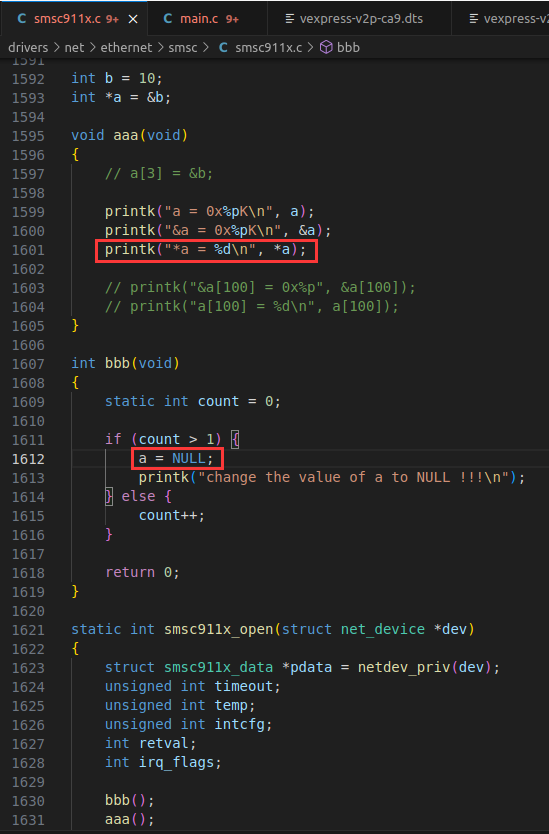
每執行一次 ifconfig eth0 up,就會調用一次 smsc911x_open(),我在這里設計了一段代碼,當第 3 次執行 ifconfig eth0 up 時,bbb() 函數就會將指針變量 a 賦值為 NULL,這樣在 aaa() 函數中訪問 a 指向的內存時就會發生 crash。
# ifconfig eth0 up
change the value of a to NULL !!!
a = 0x00000000
&a = 0xd78476c7
8<--- cut here ---
Unable to handle kernel NULL pointer dereference at virtual address 00000000
[00000000] *pgd=00000000
Internal error: Oops: 5 [#1] SMP ARM
Modules linked in:
CPU: 0 PID: 123 Comm: ifconfig Not tainted 6.1.44 #14
Hardware name: ARM-Versatile Express
PC is at aaa+0x34/0x48
LR is at aaa+0x30/0x48
pc : [<80655788>]    lr : [<80655784>]    psr: 600a0013
sp : 9b411d20  ip : 0e152000  fp : 00000000
r10: 81834800  r9 : 81015800  r8 : 00001002
r7 : 81015800  r6 : 80d73a10  r5 : 80a83234  r4 : 80d739a0
r3 : 00000000  r2 : 00000000  r1 : 00000000  r0 : 0000000e
Flags: nZCv  IRQs on  FIQs on  Mode SVC_32  ISA ARM  Segment none
Control: 10c5387d  Table: 61b84059  DAC: 00000051
Register r0 information: non-paged memory
Register r1 information: NULL pointer
Register r2 information: NULL pointer
Register r3 information: NULL pointer
Register r4 information: non-slab/vmalloc memory
Register r5 information: non-slab/vmalloc memory
Register r6 information: non-slab/vmalloc memory
Register r7 information: slab kmalloc-2k start 81015800 pointer offset 0 size 2048
Register r8 information: non-paged memory
Register r9 information: slab kmalloc-2k start 81015800 pointer offset 0 size 2048
Register r10 information: slab kmalloc-512 start 81834800 pointer offset 0 size 512
Register r11 information: NULL pointer
Register r12 information: non-paged memory
Process ifconfig (pid: 123, stack limit = 0x221691ba)
Stack: (0x9b411d20 to 0x9b412000)
1d20: 81015d80 00000000 81015824 80655808 00000000 9b411d94 0000000e 81015800
1d40: 81834800 80144640 0000000e 9b411d94 81015824 80952860 00001002 8014476c
1d60: 00000000 81015800 00000000 81015824 80952860 00001002 81015800 81834800
1d80: 00000000 8074e6f4 00000000 00000000 81015800 81015800 00000000 45d1466b
1da0: 81015800 81015800 00001043 00000000 00000041 8074eb14 80db44a4 9b411e44
1dc0: 9b411ed4 9b411e24 00000014 45d1466b 81015800 9b411e48 00000000 00001002
1de0: 8183480c 8074eb40 81a59c80 9b411e48 00000000 00000000 8183480c 807f5f34
1e00: ca6f898f 539cfbfe e473426f 00001043 00000000 00000000 00000000 45d1466b
1e20: 9b411e48 00008914 7ee27c84 81bc0000 7ee27c84 00000003 81b98300 81426900
1e40: 76f76000 807f7b14 30687465 00000000 00000000 00000000 00001043 00000000
1e60: 00000000 00000000 00000000 00000000 00000000 00000000 00000000 00000000
1e80: 00000000 00000000 00000000 00000000 00000000 00000000 00000000 00000000
1ea0: 00000000 00000000 00000000 00000000 00000000 00000000 00000000 45d1466b
1ec0: 00008914 81426880 7ee27c84 80726534 9b411edf 818308f8 818308c0 00000007
1ee0: 00000000 00000000 00000000 00000000 00000000 00000000 00000000 00000000
1f00: 00000000 45d1466b 81b84010 00008914 81b98300 7ee27f64 7ee27c84 8029fde4
1f20: 00008914 802a12c8 00555000 9b411fb0 00553000 00553441 00000017 00000254
1f40: 818308c0 00000007 81af1080 80113a34 00000000 45d1466b 00000000 00000000
1f60: 81426880 00000017 00553441 9b411fb0 80d09f3c 80c58044 7ee27e6c 45d1466b
1f80: 76f76000 00546138 7ee27c84 7ee27f64 00000036 801002c4 81af1080 00000036
1fa0: 76f76000 80100060 00546138 7ee27c84 00000003 00008914 7ee27c84 7ee27c18
1fc0: 00546138 7ee27c84 7ee27f64 00000036 7ee27e68 7ee27e6c 76f75ce0 76f76000
1fe0: 00556bdc 7ee27c00 0048ed74 76ed246c 200a0010 00000003 00000000 00000000aaa from smsc911x_open+0x18/0x9c8smsc911x_open from __dev_open+0xc8/0x188__dev_open from __dev_change_flags+0x1b0/0x1c8__dev_change_flags from dev_change_flags+0x14/0x44dev_change_flags from devinet_ioctl+0x264/0x6d0devinet_ioctl from inet_ioctl+0x21c/0x248inet_ioctl from sock_ioctl+0x478/0x588sock_ioctl from vfs_ioctl+0x18/0x34vfs_ioctl from sys_ioctl+0xc10/0xcd4sys_ioctl from ret_fast_syscall+0x0/0x54
Exception stack(0x9b411fa8 to 0x9b411ff0)
1fa0:                   00546138 7ee27c84 00000003 00008914 7ee27c84 7ee27c18
1fc0: 00546138 7ee27c84 7ee27f64 00000036 7ee27e68 7ee27e6c 76f75ce0 76f76000
1fe0: 00556bdc 7ee27c00 0048ed74 76ed246c
Code: e1a01006 e1a00005 ebec5b1a e5943070 (e5931000)
---[ end trace 0000000000000000 ]---
Segmentation fault
內核的 crash 信息幫我們定位到了問題原因是訪問的指針變量 a 是一個空指針。
那接著如何追蹤是誰將 a 賦值為空了呢?
請忽略 change the value of a to NULL !!! 這句 log,實際項目中沒有神仙會幫你加上這句。
在 aaa 函數處打上斷點
(gdb) b aaa
Breakpoint 1 at 0x80655754: file drivers/net/ethernet/smsc/smsc911x.c, line 1596.
斷點命中后,使用 watch 命令監控指針變量 a,當讀或寫 a 變量時,就會觸發該斷點
Breakpoint 1, aaa () at drivers/net/ethernet/smsc/smsc911x.c:1596
1596	{
(gdb) p a
$1 = (int *) 0x80d73a14 <b>
(gdb) p *a
$2 = 10
(gdb) watch a
Hardware watchpoint 2: a
繼續運行代碼,watchpoint 斷點觸發,提示 a 的值從 0x80d73a14 變為了 0x0。
代碼停留在 smsc911x.c 第 1613 行。
Hardware watchpoint 2: aOld value = (int *) 0x80d73a14 <b>
New value = (int *) 0x0
bbb () at drivers/net/ethernet/smsc/smsc911x.c:1613
1613			printk("change the value of a to NULL !!!\n");
代碼停留位置是即將要執行的行,結合代碼,上一行,第 1612 行 a = NULL; 是剛執行過的代碼,也就是該行代碼將指針變量 a 的值由 0x80d73a14 改為了 0x0,這樣就找到了真兇。
總結
有人可能會有疑問,這有什么啊,也沒看出來 watchpoint 有多強大。
別著急,請大家換一種情景,假如 bbb() 函數在別的文件呢?查找問題難度是不是就升級了。
有小伙伴說,我有搜索啊,全局搜索 a =,不也能找到賦值的地方。是的,不過,如果賦值的地方很多,且右值也是個變量,定位起來是不是難度比較大。
還有,修改變量 a 的代碼有可能不在 kernel 源碼中,可能在某個內核模塊中,這樣定位起來也比較費功夫。
最后,有一種情況是非用 watchpoint 不可的,那就是,代碼并不是顯式修改 a 的值,而是由于某處代碼訪問越界了,誤修改到了 a 的值,這種情況看代碼是看不出來的。比如,代碼 int c[4]; 定義了一個數組,i = 100,使用 c[i] 訪問時就出現了數組越界,c[100],是一個未知地址,說不準就是上面變量 a 所在的內存地址。
(容斥原理、博弈論))


)


)


)

