2019獨角獸企業重金招聘Python工程師標準>>> 
上一篇:【TeeChart .NET教程】(六)使用系列
【下載TeeChart.Net最新版本】
(一)功能類型
1.1 功能類型
TeeChart Pro功能是一個系列,幾乎可以是任何系列類型,應用代數功能,數據源是另一個圖表系列。所有函數都派生自Steema.TeeChart.Functions命名空間中的Function類,并繼承Function的 Period屬性。TeeChart Pro提供以下預定義功能列表:

多種功能類型僅支持一個輸入系列。但是,可以鏈接鏈接函數,例如,將圖表中多個系列的平均值創建為平均函數系列,然后使用平均函數作為趨勢函數的輸入來標識平均值的趨勢。
添加功能
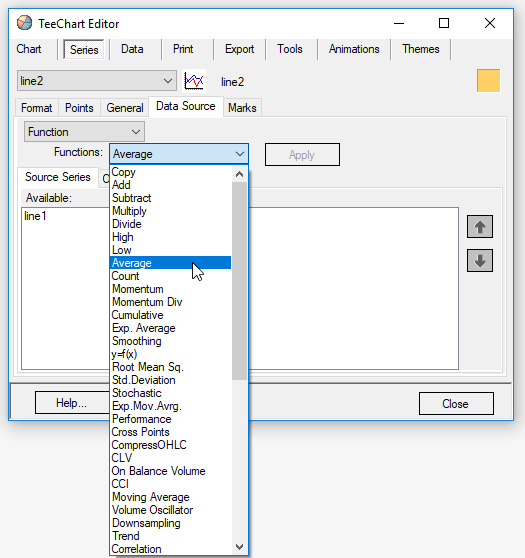
使用TeeChart Editor,在First Chart頁面上,選擇Add按鈕,就像將新系列添加到Chart中一樣。在TeeChart Gallery中,選擇Functions選項卡以選擇所需的功能。每個功能都顯示為一個系列,用戶可以稍后通過選擇第一個圖表頁面上的更改按鈕來更改與該功能關聯的系列類型。之后,在函數系列的“數據源”頁面上可以輕松更改函數定義。在這里,同樣容易,用戶可以將已添加到Chart的正常Series的定義更改為Function的定義(Function實際上是數據源的定義,而不是Series Type的定義)。下圖顯示了編輯函數時的“數據源”頁面。線系列(標題“line2”)已定義。數據源頁面底部的左側列表框顯示了可供輸入的圖表中的其他系列(此處為“line1”)。
從一個完全空的Chart開始,這里是代碼中用于構建簡單的Series-Function相關Chart的步驟。
[C#.Net]
private void Form1_Load(object sender, System.EventArgs e) //Add a data Series Line line1 = new Line(tChart1.Chart); //Populate it with data (here random) line1.FillSampleValues(10); //Add a series to be used for an Average Function Line line2 = new Line(tChart1.Chart); //Define the Function Type for the new Series Steema.TeeChart.Functions.Average average1 = new Steema.TeeChart.Functions.Average(); line2.Function = average1; //Define the Datasource for the new Function Series line2.DataSource = line1; //*Note - When populating your input Series manually you will need to //use the Checkdatasource method //- See the section entitled 'Defining a Datasource' //Change the Period of the Function so that it groups averages //every 2 Points line2.Function.Period = 2; line2.CheckDataSource();
[VB.Net]
Private Sub Form1_Load(ByVal sender As System.Object, ByVal e As System.EventArgs) Handles MyBase.Load 'Add a data Series Dim Line1 As New Steema.TeeChart.Styles.Line(TChart1.Chart) 'Populate it with data (here random) Line1.FillSampleValues(10) 'Add a series to be used for an Average Function Dim Line2 As New Steema.TeeChart.LineSeries(TChart1.Chart) 'Define the Function Type for the new Series Dim Average1 As New Steema.TeeChart.Functions.Average() Line2.Function = Average1 'Define the Datasource for the new Function Series Line2.DataSource = Line1 '*Note - When populating your input Series manually you will need to  'use the Checkdatasource method  '- See the section entitled 'Defining a Datasource' 'Change the Period of the Function so that it groups averages 'every 2 Points Line2.Function.Period = 2 Line2.CheckDataSource()
End Sub
添加另一個函數來獲取有關前一個函數的信息
[C#.Net]
private void button1_Click(object sender, System.EventArgs e) //Let's change to 2D for visibility tChart1.Aspect.View3D = false; //Add another Series to be used for a 2nd Function Line line3 = new Line(tChart1.Chart); //Define the Function Type for the new Series Steema.TeeChart.Functions.High high1 = new Steema.TeeChart.Functions.High(); line3.Function = high1; //Define the Datasource for the new Function Series //Use the existing Function (Series2) as input line3.DataSource = tChart1.Series[1]; //Leave the Period at default 0 (No Period set) to draw //A line at Highest of all points of the Average Function
[VB.Net]
Private Sub Button1_Click(ByVal sender As System.Object, ByVal e As System.EventArgs) Handles Button1.Click 'Let's change to 2D for visibility TChart1.Aspect.View3D = False 'Add another Series to be used for a 2nd Function  Dim Line3 As New Steema.TeeChart.LineSeries(TChart1.Chart) 'Define the Function Type for the new Series  Dim High1 As New Steema.TeeChart.Functions.High() Line3.Function = High1 'Define the Datasource for the new Function Series  'Use the existing Function (Series2) as input  Line3.DataSource = TChart1.Series(1) 'Leave the Period at default 0 (No Period set) to draw  'A line at Highest of all points of the Average Function
End Sub
1.2 定義數據源
上一節中的示例重點介紹如何使用Datasource通過代碼填充Function。Series使用datasource定義Function的輸入或定義Series ADO.NET數據源。使用TeeChart編輯器,在添加函數后,函數系列的“Datasource”頁面將顯示包含在函數定義中的可用系列列表。可以更改要應用于系列的函數類型,并從左側列表框“Available”中選擇系列,并將它們添加到右側列表框“Selected”,按代碼的數據源使用Series.Datasource屬性。
例;
假設在設計時通過TeeChart編輯器添加了2個數據系列,添加了一個由2系列的平均值組成的函數:
[C#.Net]
private void Form1_Load(object sender, System.EventArgs e) tChart1.Aspect.View3D = false; bar1.FillSampleValues(10); bar2.FillSampleValues(10); private void button1_Click(object sender, System.EventArgs e) Steema.TeeChart.Styles.Line line1 = new Steema.TeeChart.Styles.Line(tChart1.Chart); Steema.TeeChart.Functions.Average average1 = new Steema.TeeChart.Functions.Average(); line1.DataSource = new object[] this.bar2,this.bar1; line1.Function = average1; line1.Marks.Visible = true;
[VB.Net]
Private Sub Form1_Load(ByVal sender As System.Object, ByVal e As System.EventArgs) Handles MyBase.Load TChart1.Aspect.View3D = False Bar1.FillSampleValues(10) Bar2.FillSampleValues(10)
End Sub Private Sub Button1_Click(ByVal sender As System.Object, ByVal e As System.EventArgs) Handles Button1.Click Dim DataSource As New ArrayList() DataSource.Add(Bar1) DataSource.Add(Bar2) Dim Line1 As New Steema.TeeChart.Styles.Line(TChart1.Chart) Dim Average1 As New Steema.TeeChart.Functions.Average() Line1.Function = Average1 Line1.DataSource = DataSource
End Sub
為2系列添加點數:
[C#.Net]
private void button2_Click(object sender, System.EventArgs e) Random rnd = new Random(); for(int i = 0; i < 10; ++i) bar1.Add(rnd.Next(500)); bar2.Add(rnd.Next(500));
[VB.Net]
Private Sub Button2_Click(ByVal sender As System.Object, ByVal e As System.EventArgs) Handles Button2.Click Dim rnd As New Random() Dim i As Integer For i = 0 To 10 Bar1.Add(rnd.Next(500)) Bar2.Add(rnd.Next(500)) Next
End Sub
請注意,該功能不會顯示,需要在Button2_Click()事件中添加Series.CheckDatasource方法以讀取Function的值。
[C#.Net]
tChart1.Series [2] .CheckDataSource();
[VB.Net]
TChart1.Series(2).CheckDataSource()
可以在運行時更改函數定義,只需重新定義Series.DataSource屬性即可為系列分配新函數:
[C#.Net]
private void button3_Click(object sender, System.EventArgs e) Steema.TeeChart.Functions.Cumulative cumulative1 = new Steema.TeeChart.Functions.Cumulative(); tChart1.Series[2].Function = cumulative1;
[VB.Net]
Private Sub Button3_Click(ByVal sender As System.Object, ByVal e As System.EventArgs) Handles Button3.Click Dim Cumulative1 As New Steema.TeeChart.Functions.Cumulative() TChart1.Series(2).Function = Cumulative1
End Sub
1.3 功能周期
周期是使用函數的重要屬性,因為周期定義了循環應用函數的點的范圍。
示例
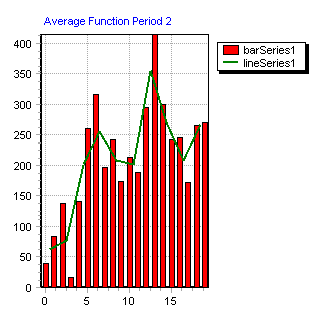
有6個數據點(例如條形系列的條形),其值為: 3,8,6,2,9和12。定義一個具有周期0的函數系列(默認),繪制的平均值為:6.667。將周期設置為2我們得到3個平均值作為函數的輸出:5.5,4和10.5。這些值將在它們的周期范圍中集中繪制,即輸入系列的第1和第2條之間的第1個值,第3和第4個條之間的第2個值等..通過在“Datasource”頁面中選擇相關的“Series and Function”并單擊“Options”選項卡來定義“Period ”,也可以使用“FunctionType”在運行時修改“Period ”。
例如,line1是函數系列:
[C#.Net]
line1.Function.Period = 2;
[VB.Net]
Line1.Function.Period = 2
下面是2個圖表突出顯示應用的周期

1.4 時間段樣式
周期的效果可以定義為范圍,這在使用DateTime系列時非常有用,將函數的“Period”表示為TimeStep,屬性“PeriodStyle”控制如何表達“Period”。例如,可以使用日期時間源系列上的常規“Average”功能繪制“monthly average of sales”功能,并將功能期間設置為“one month”:
[C#.Net]
private void Form1_Load(object sender, System.EventArgs e) //Add in a BarSeries and Average Function at design-time. Random rnd = new Random(); tChart1.Aspect.View3D = false; TimeSpan month = new TimeSpan(30,0,0,0); DateTime today = DateTime.Today; bar1.Marks.Visible = false; bar1.XValues.DateTime = true; tChart1.Axes.Bottom.Labels.Angle = 90; for(int i = 0; i < 60; ++i) today = today.AddDays(5); bar1.Add(today, rnd.Next(100),"",Color.Red); average1.PeriodAlign = Steema.TeeChart.Functions.PeriodAligns.First; average1.PeriodStyle = Steema.TeeChart.Functions.PeriodStyles.Range; average1.Period = month.TotalDays; line1.DataSource = bar1; line1.CheckDataSource();
[VB.Net]
Private Sub Form1_Load(ByVal sender As System.Object, ByVal e As System.EventArgs) Handles MyBase.Load 'Add in a BarSeries and Average Function at design-time. TChart1.Aspect.View3D = False Dim Month As New TimeSpan(30, 0, 0, 0) Dim Today As DateTime = DateTime.Today Dim i As Integer Bar1.Marks.Visible = False Bar1.XValues.DateTime = True TChart1.Axes.Bottom.Labels.Angle = 90 For i = 0 To 60 Today = Today.AddDays(5) Bar1.Add(Today, Rnd() * 100, "", Color.Red) Next Average1.PeriodAlign = Steema.TeeChart.Functions.PeriodAligns.First Average1.PeriodStyle = Steema.TeeChart.Functions.PeriodStyles.Range Average1.Period = Month.TotalDays Line1.DataSource = Bar1 Line1.CheckDataSource()
End Sub
這將產生幾個點,每個點顯示BarSeries中每個月數據的“average”,在計算日期時間段的函數時,必須按源日期對源系列中的點進行排序,該范圍也可用于非日期時間序列:
[C#.Net]
for(int i = 0; i < 60; ++i)  bar1.Add(Convert.ToDouble(i), rnd.Next(100),"",Color.Red); average1.PeriodAlign = Steema.TeeChart.Functions.PeriodAligns.First;
average1.PeriodStyle = Steema.TeeChart.Functions.PeriodStyles.Range;
average1.Period = 6;
[VB.Net]
For i = 0 To 60 Bar1.Add(i, Rnd() * 100, "", Color.Red)
Next
Average1.PeriodAlign = Steema.TeeChart.Functions.PeriodAligns.First
Average1.PeriodStyle = Steema.TeeChart.Functions.PeriodStyles.Range
Average1.Period = 6
這將計算每個“6”區間內每組點的平均值。(X > = 6,X < 6的點將用于計算第一個平均值,X> = 6的點,X < 12將用于計算第二個平均值,依此類推......),這與計算每6個點的平均值不同。使用“周期對齊”屬性可以對齊“系列”范圍內的功能點,以下將繪制每月結束時的功能點:
[C#.Net]
average1.PeriodAlign = Steema.TeeChart.Functions.PeriodAligns.First;
average1.PeriodStyle = Steema.TeeChart.Functions.PeriodStyles.Range;
average1.Period = month.TotalDays;
[VB.Net]
Average1.PeriodAlign = Steema.TeeChart.Functions.PeriodAligns.First
Average1.PeriodStyle = Steema.TeeChart.Functions.PeriodStyles.Range
Average1.Period = Month.TotalDays
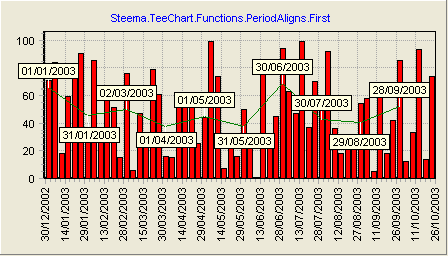
Period = Month.TotalDays and PeriodAligns.First,從下圖中可以看出,“average”是在月末繪制的。
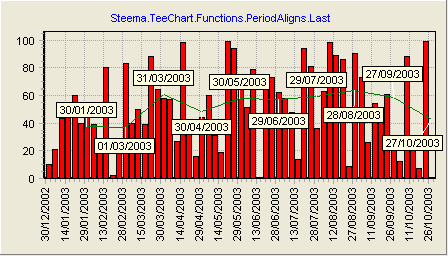
Period = Month.TotalDays and PeriodAligns.Last,在這種情況下,“average”是在月初繪制的。
1.5 派生自定義函數
創建新的Function組件只是創建一個派生自Function類的新組件(它也可以從現有的函數類派生),Function中有兩個重要的虛擬方法可以重寫以創建新的Function類型。 1)Function.Calculate:public virtual double Calculate(Series Source,int First,int Last) 2)Fu??nction.CalculateMany:public virtual double CalculateMany(ArrayList SourceSeries,int ValueIndex) 如果只有一個系列用作數據源,則Calculate方法用于計算函數結果。如果多個系列可用作數據源,則CalculateMany用于計算函數結果。
示例:創建新的SquareSum功能,需要一個SquareSum函數來返回“sum of squares(平方和)”,此函數只能有一個數據源或多個數據源,因此我們將覆蓋Calculate和CalculateMany方法。
[C#.Net]
public class SquareSum : Steema.TeeChart.Functions.Function public SquareSum(): base() public SquareSum(Steema.TeeChart.Chart c): base(c) public override double Calculate(Series SourceSeries,int FirstIndex,int LastIndex) ValueList v=ValueList(SourceSeries); if ( FirstIndex==-1 ) return v.Total; else double result=0; for (int t=FirstIndex; t<=LastIndex; t++) result+=Math.Sqrt(v[t]); return result; public override double CalculateMany(ArrayList SourceSeriesList,int ValueIndex) ValueList v; double result=0; for (int t=0; tValueIndex ) result+=Math.Sqrt(v[ValueIndex]); return result;
[VB.Net]
Public Class SquareSum Inherits Steema.TeeChart.Functions.Function Public Sub New() MyBase.New() End Sub Public Sub New(ByVal c As Steema.TeeChart.Chart) MyBase.New(c) End Sub Public Overrides Function Calculate(ByVal Source As Steema.TeeChart.Series, ByVal First As Integer, ByVal Last As Integer) As Double Dim v As Steema.TeeChart.ValueList Dim t As Integer v = ValueList(Source) If First = -1 Then Return v.Total Else Dim Result As Double = 0 For t = First To t < Last Result += Math.Sqrt(v(t)) Next Return Result End If End Function Public Overrides Function CalculateMany(ByVal SourceSeries As System.Collections.ArrayList, ByVal ValueIndex As Integer) As Double Dim v As Steema.TeeChart.ValueList Dim Result As Double = 0 Dim t As Integer For t = 0 To t < SourceSeries.Count v = ValueList(CType(SourceSeries(t), Steema.TeeChart.Series)) If v.Count > ValueIndex Then Result += Math.Sqrt(v(ValueIndex)) End If Next Return Result End Function
End Class
FirstIndex和EndIndex變量用于“loop(循環)”所有SourceSeries點以計算平方和。“ValueList”方法用于提取必需的Steema.TeeChart.ValueList,以使這些類與HorizBarSeries等Series類型一起使用,其中“XValues”保存點值而不是“YValues”,當Series只有一個Series作為DataSource時,使用“Calculate”方法,當Series有多個Series作為數據源時,將調用“CalculateMany”方法。對于源系列中的每個點,“CalculateMany”將被調用一次,從零開始,以所有數據源的最小點數結束。理解Calculate和CalculateMany之間的區別非常重要,當只有一個數據源并且只調用一次時調用“Calculate”。當有多個Series作為數據源時,會多次調用“CalculateMany”(每個點一個)。


)


![[Web 前端] 解決因inline-block元素導致的空白間距和元素下沉](http://pic.xiahunao.cn/[Web 前端] 解決因inline-block元素導致的空白間距和元素下沉)


基礎學習—FTP服務)


