以周為單位,獲取本周最強的5只行業指數,進行均值購買。
數據源采用akshare。
導入包
import akshare as ak
import pandas as pd
import numpy as np
import matplotlib
?日線換為周線
#日線換為周線數據
def transferToWeekLine(df):data1=dfstock_data = pd.DataFrame(data1)#設定轉換周期period_type  轉換為周是'W',月'M',季度線'Q',五分鐘'5min',12天'12D'stock_data["date"] = pd.to_datetime(stock_data["date"])period_type = 'W'stock_data.set_index('date',inplace=True)#進行轉換,周線的每個變量都等于那一周中最后一個交易日的變量值period_stock_data = stock_data.resample(period_type).last()# 周線的open等于那一周中第一個交易日的openperiod_stock_data['open'] = stock_data['close'].resample(period_type).first()#周線的high等于那一周中的high的最大值period_stock_data['high'] = stock_data['close'].resample(period_type).max()#周線的low等于那一周中的low的最大值period_stock_data['low'] = stock_data['close'].resample(period_type).min()#周線的volume和money等于那一周中volume和money各自的和period_stock_data['chg_pct'] = stock_data['chg_pct'].resample(period_type).sum()period_stock_data['volume'] = stock_data['volume'].resample(period_type).sum()# period_stock_data['money'] = stock_data['money'].resample(period_type,how='sum')#計算周線turnover# period_stock_data['turnover'] = period_stock_data['volume'](period_stock_data['traded_market_value']/period_stock_data['close'])#股票在有些周一天都沒有交易,將這些周去除period_stock_data = period_stock_data[period_stock_data['volume'].notnull()]period_stock_data.reset_index(inplace=True)data = np.array(period_stock_data) #先將數據框轉換為數組data_list = data.tolist()  #其次轉換為列表for i in data_list:i[0]=str(i[0]).split(" ")[0]return data_list
獲取申萬二級行業代碼
#獲取申萬二級行業代碼
sw_index_third_info_df = ak.sw_index_third_info()
sw_index_third_info_df['行業代碼']=sw_index_third_info_df['行業代碼'].apply(lambda x:str(x)[:6])
#獲取行業指數行情
#策略1,行業輪動現象的直觀表征:相對強弱
ind = pd.DataFrame()
for i in range(len(sw_index_third_info_df)):#print(sw_index_third_info_df.iloc[i,0])sw_index_daily_df = ak.sw_index_daily_indicator(symbol=sw_index_third_info_df.iloc[i,0], start_date="20191201", end_date="20220310",data_type='Day')stock_data=pd.DataFrame(transferToWeekLine(sw_index_daily_df))stock_data.rename(columns={0:'date',1:'code',2:'name',3:'close',4:'volume',5:'chg_pct'},inplace=True)stock_data=stock_data.iloc[:,:6]stock_data['ret'] = stock_data['chg_pct'].shift(-1)ind = ind.append(stock_data)
#獲取每個交易周的行業指數,并買入排名前五,(均值買入),并計算持倉一個禮拜的收益。
ind = ind.sort_values(by='date')
last = pd.DataFrame()
l = []
for i in ind['date'].unique():d = ind.loc[ind['date']==i].sort_values('close',ascending=True).head(5)l = l+[d.ret.mean()/100]
繪制資金曲線圖
pd.DataFrame(l).cumsum().plot()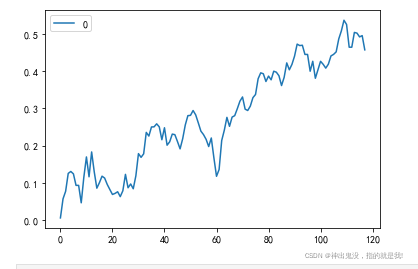
?


![[個人網站搭建]·Django增加評論功能(Python3)](http://pic.xiahunao.cn/[個人網站搭建]·Django增加評論功能(Python3))


