轉載請注明出處:https://www.cnblogs.com/shining5/p/11142357.html
MongoDB監控及報警
Prometheus是由SoundCloud開發的開源監控報警系統和時序列數據庫,其使用go語言開發。基本原理是通過HTTP協議周期性抓取被監控組件的狀態,任意組件只要提供對應HTTP接口就可以接入監控。Prometheus服務端產生告警向Altermanager發送告警。
Grafana是一個開源的度量分析和可視化套件,常用于可視化基礎設施和應用程序分析的時間序列數據。
監控
目標:可視化顯示MongoDB的運行狀態。
工具:Grafana,Prometheus
因為grafana本身數據源沒有mongodb,所以中間加上Prometheus來對mongodb進行監控。
服務端組件:
Prometheus #服務端
Grafana #前端展示
客戶端組件:
node_exporter
mongodb_exporter
步驟
安裝go環境
$ yum install go
$ go version
go version go1.6.3 linux/amd64
安裝Prometheus
$ wget https://github.com/prometheus/prometheus/releases/download/v2.11.0-rc.0/prometheus-2.11.0-rc.0.linux-amd64.tar.gz
$ tar xvf prometheus-2.11.0-rc.0.linux-amd64.tar.gz -C /usr/local/
$ ln -sv /usr/local/prometheus-2.11.0.linux-amd64/ /usr/local/prometheus
$ cd /usr/local/prometheus
備注:下載2.0以上版本,否則讀取規則的時候報錯
修改配置文件
將監管的ip地址添加到prometheus.yml中
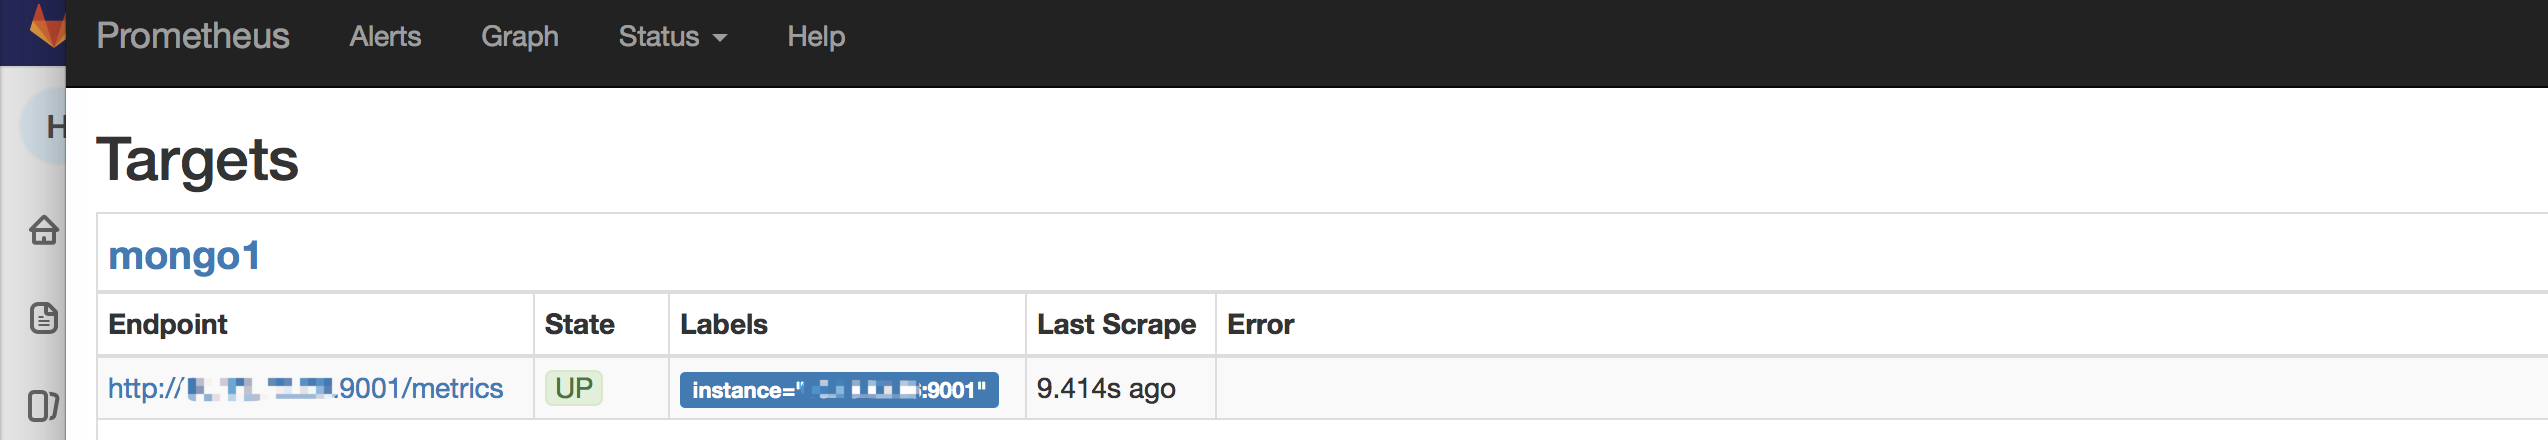
scrape_configs:# The job name is added as a label `job=<job_name>` to any timeseries scraped from this config. - job_name: 'mongo1'static_configs:- targets: ['10.13.72.26:9001'] - job_name: 'node'static_configs:- targets: ['10.13.72.26:9100'] 其中'10.13.72.26:9001'是mongodb_exporter監聽端口,后面安裝mongodb_exporter會提到
啟動服務
nohup ./prometheus --web.enable-lifecycle &
備注:啟動時添加–web.enable-lifecycle可以自動加載配置文件,可以通過?curl -X POST http://localhost:9090/-/reload?重新加載配置
prometheus內置列一個web界面,可以通過http://install_host:9090訪問。在Status->Targets頁面中,我們可以看到配置的mongo1,狀態為Down,說明未檢測到數據。如何解決呢?需要安裝好node_exporter,mongodb_exporter狀態才會變為Up
安裝node_exporter
node_exporter服務端agent,用go語言編寫,主要用于采集系統數據,如cup,內存,負載,磁盤,網絡等信息。
啟動后監聽9100端口。
$ wget https://github.com/prometheus/node_exporter/releases/download/v0.14.0/node_exporter-0.14.0.linux-amd64.tar.gz
$ tar xvf node_exporter-0.14.0.linux-amd64.tar.gz -C /usr/local/
$ nohup /usr/local/node_exporter-0.14.0.linux-amd64/node_exporter &
安裝mongodb_exporter
wget https://github.com/dcu/mongodb_exporter/releases/mongodb_exporter-linux-amd64
nohup ./mongodb_exporter-linux-amd64
啟動后占用9001端口
安裝grafana
wget https://dl.grafana.com/oss/release/grafana-6.2.5-1.x86_64.rpm
sudo yum localinstall grafana-6.2.5-1.x86_64.rpm
啟動后默認占用3000端口
sudo service grafana-server start
grafana顯示mongodb數據
步驟1: 打開grafana前端頁面http://install_host:3000
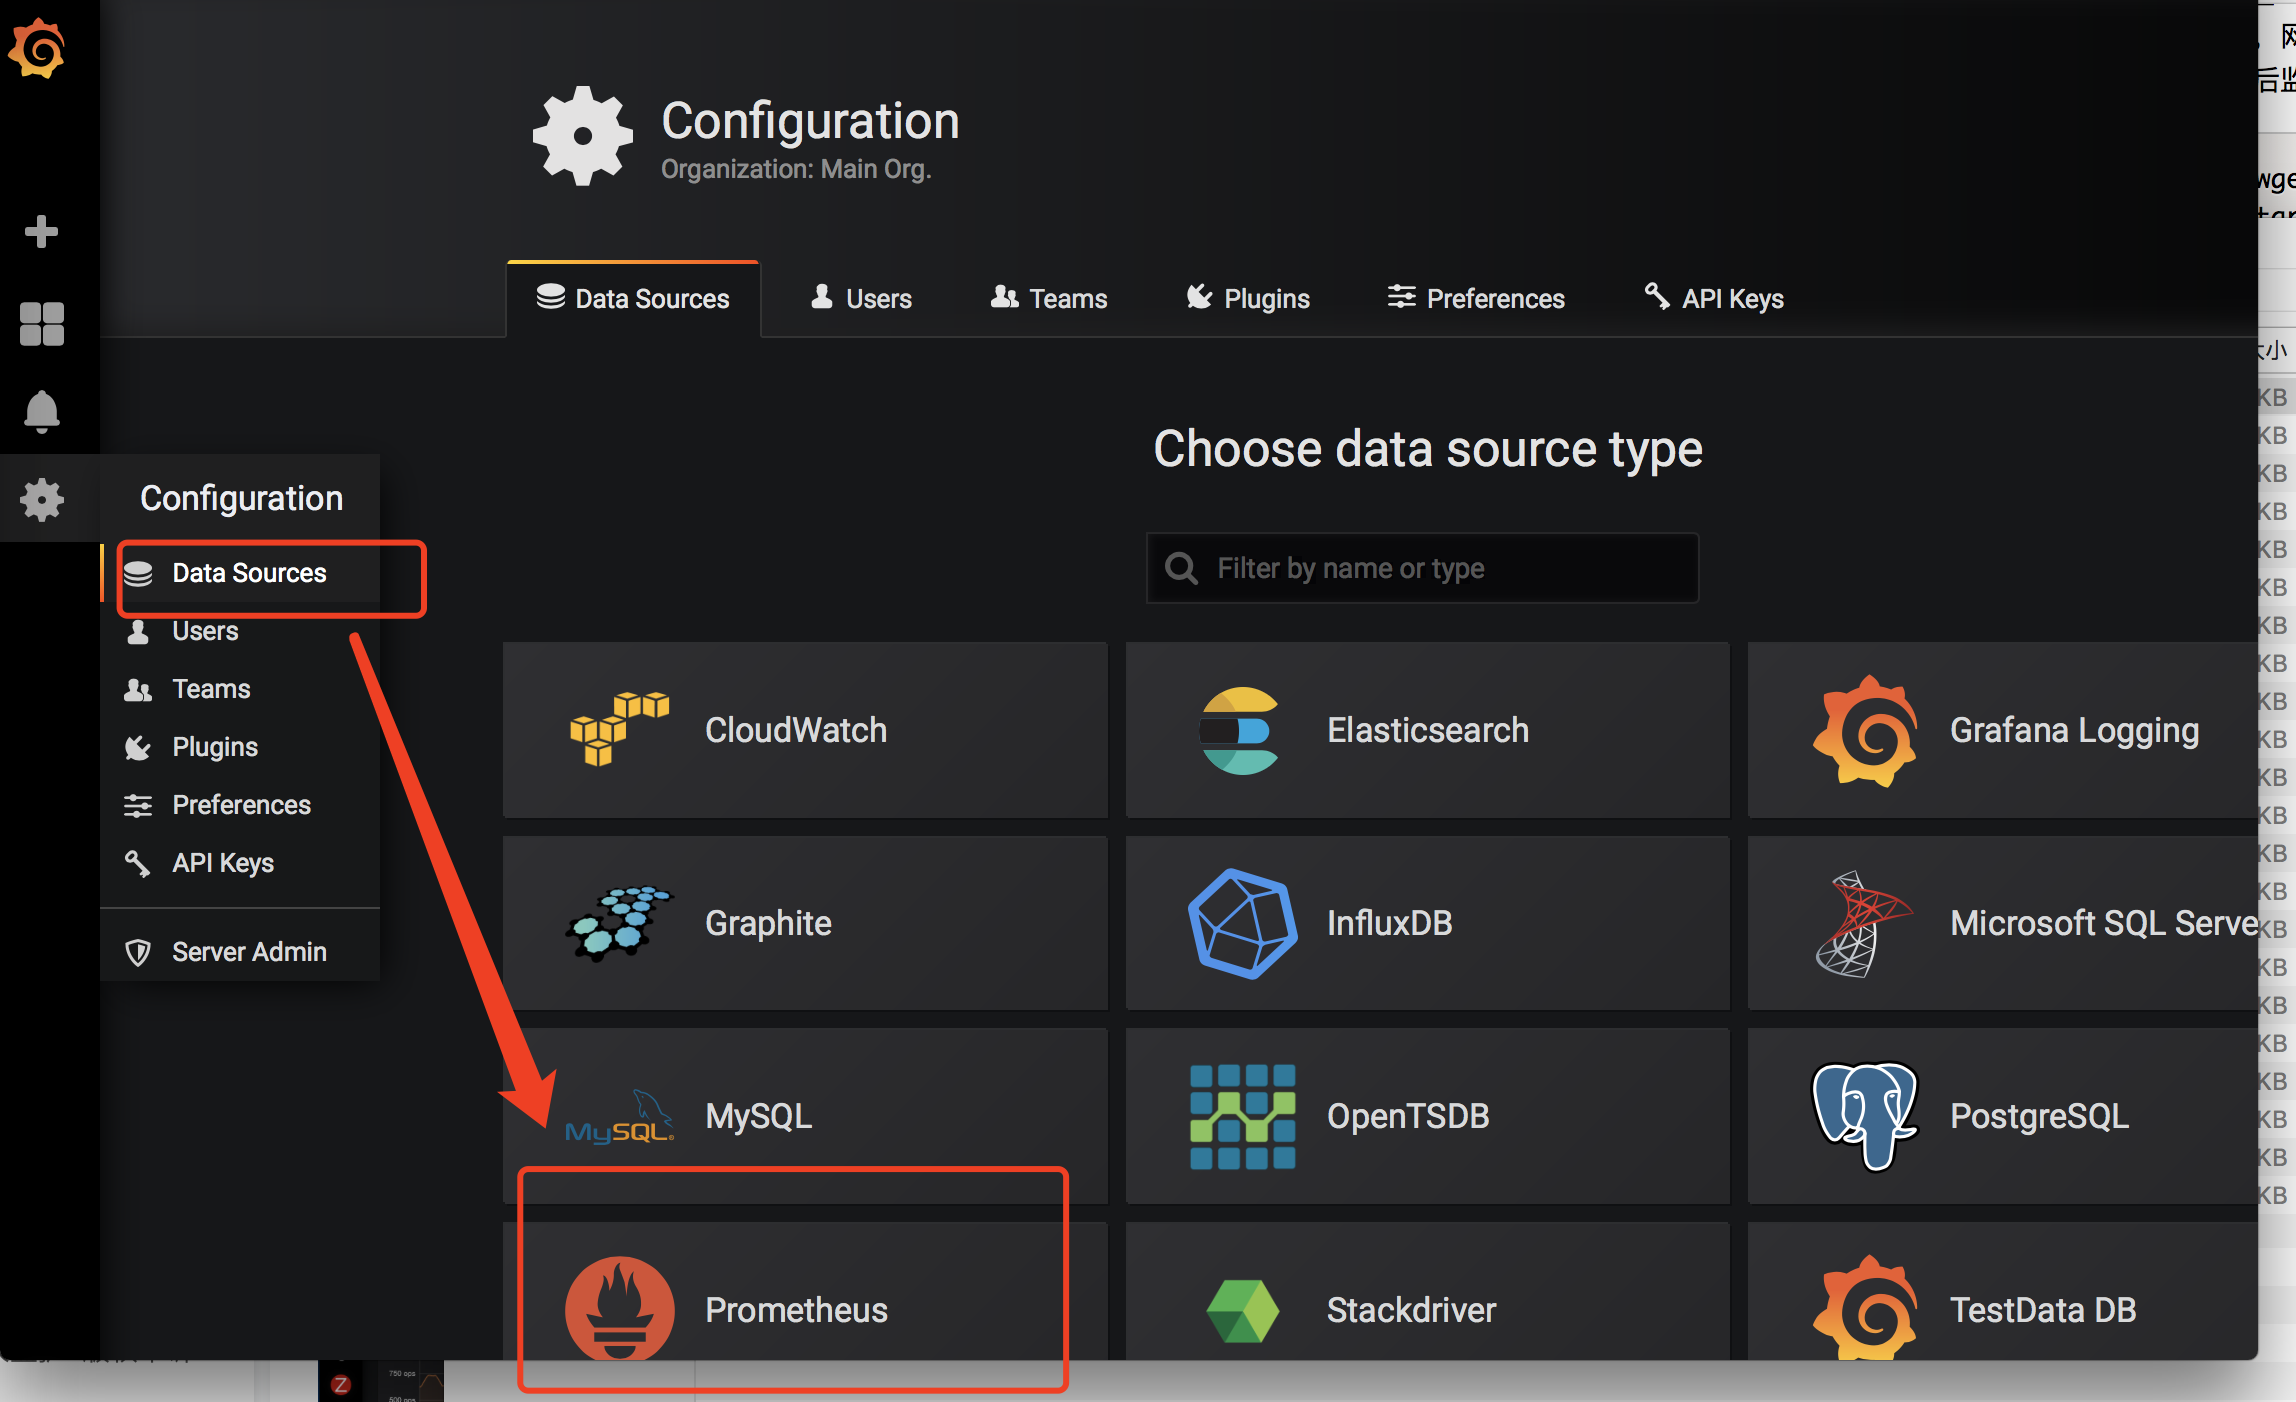
步驟2:在Data Sources添加數據源

步驟3: Create dashboard
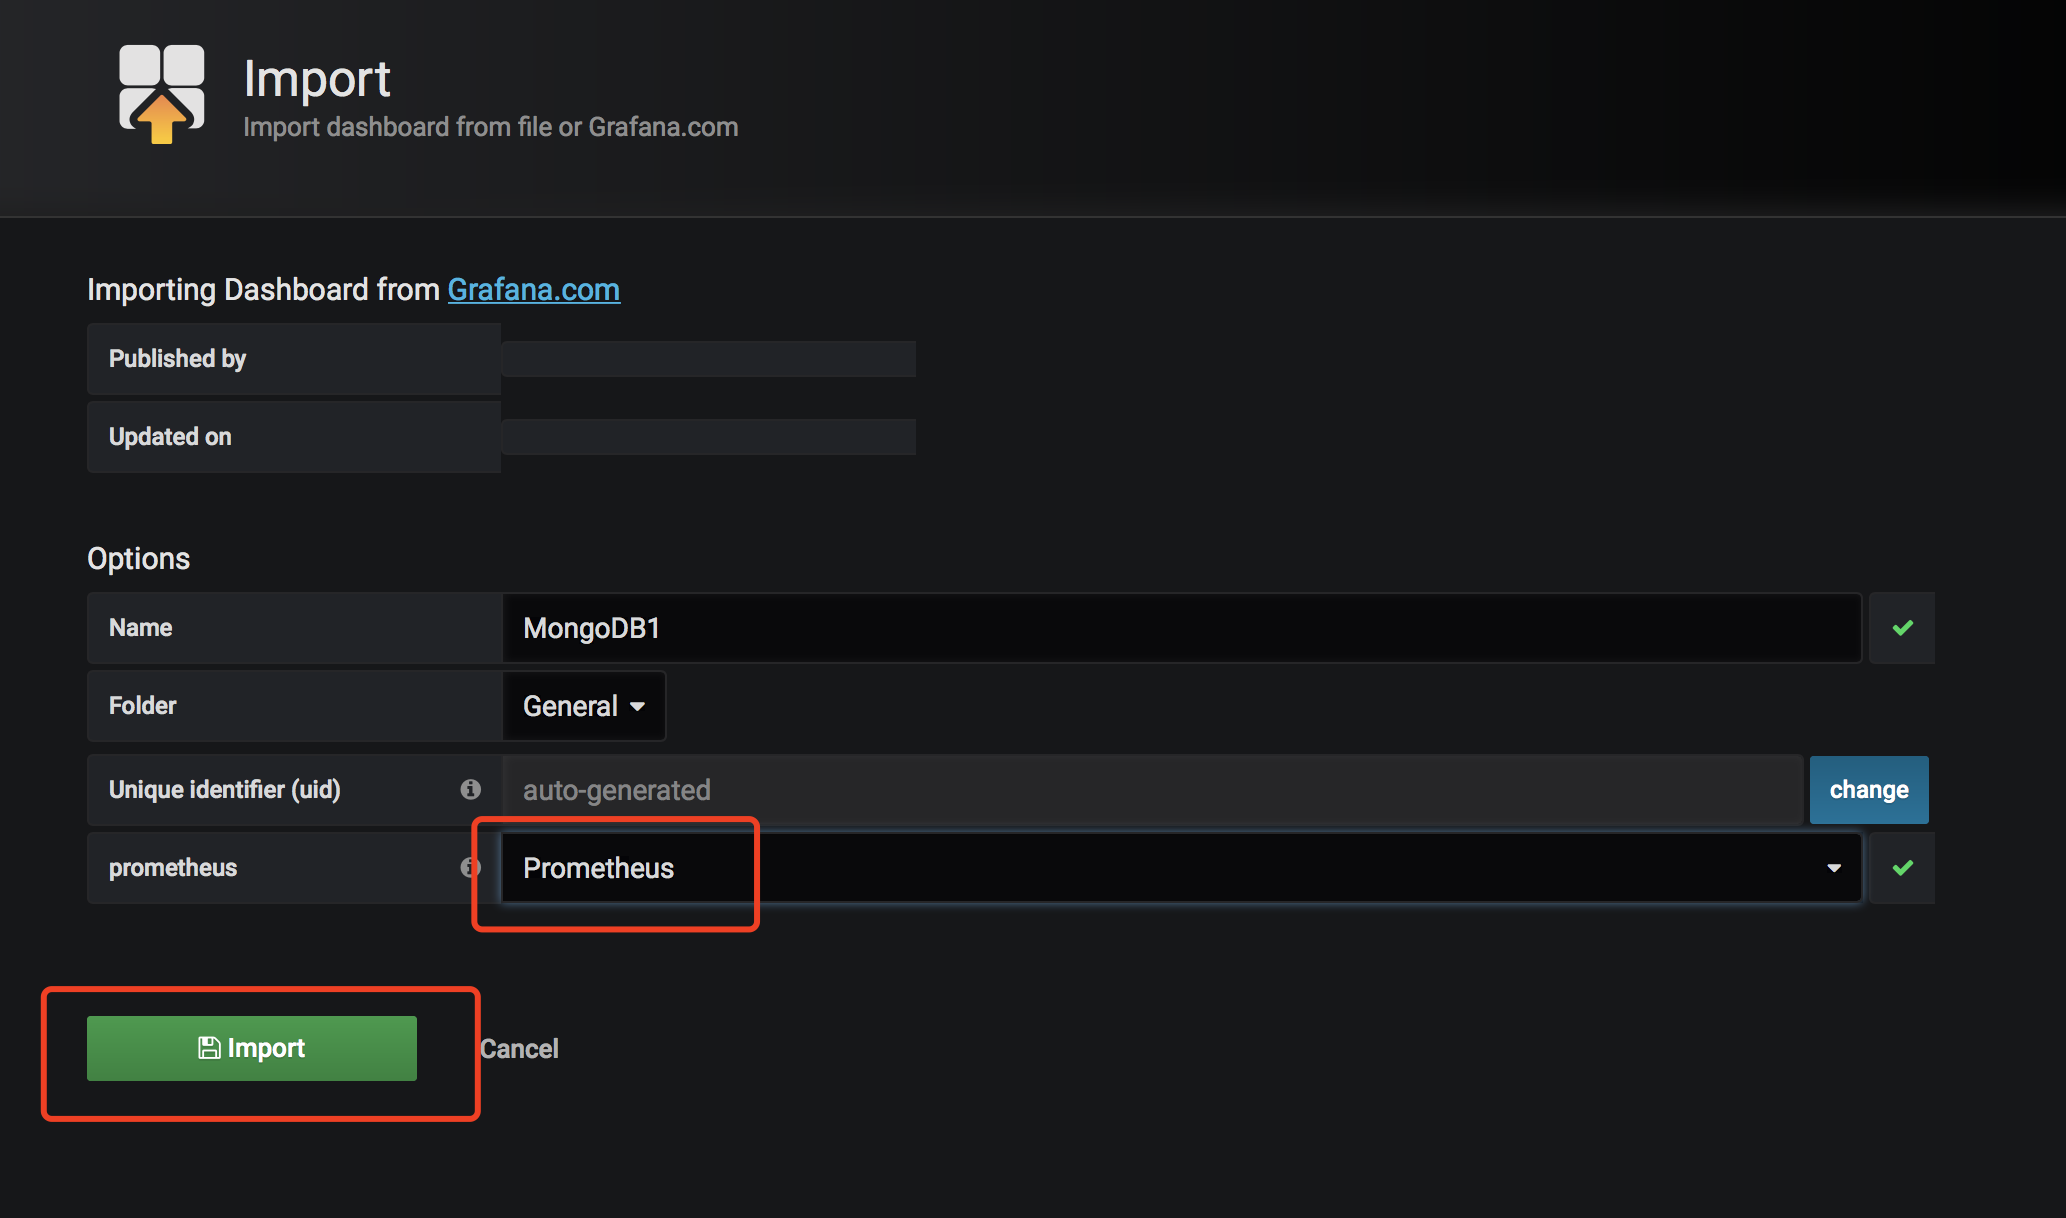
import一個已經做好的表盤
https://grafana.com/dashboards/2583
DownloadJSON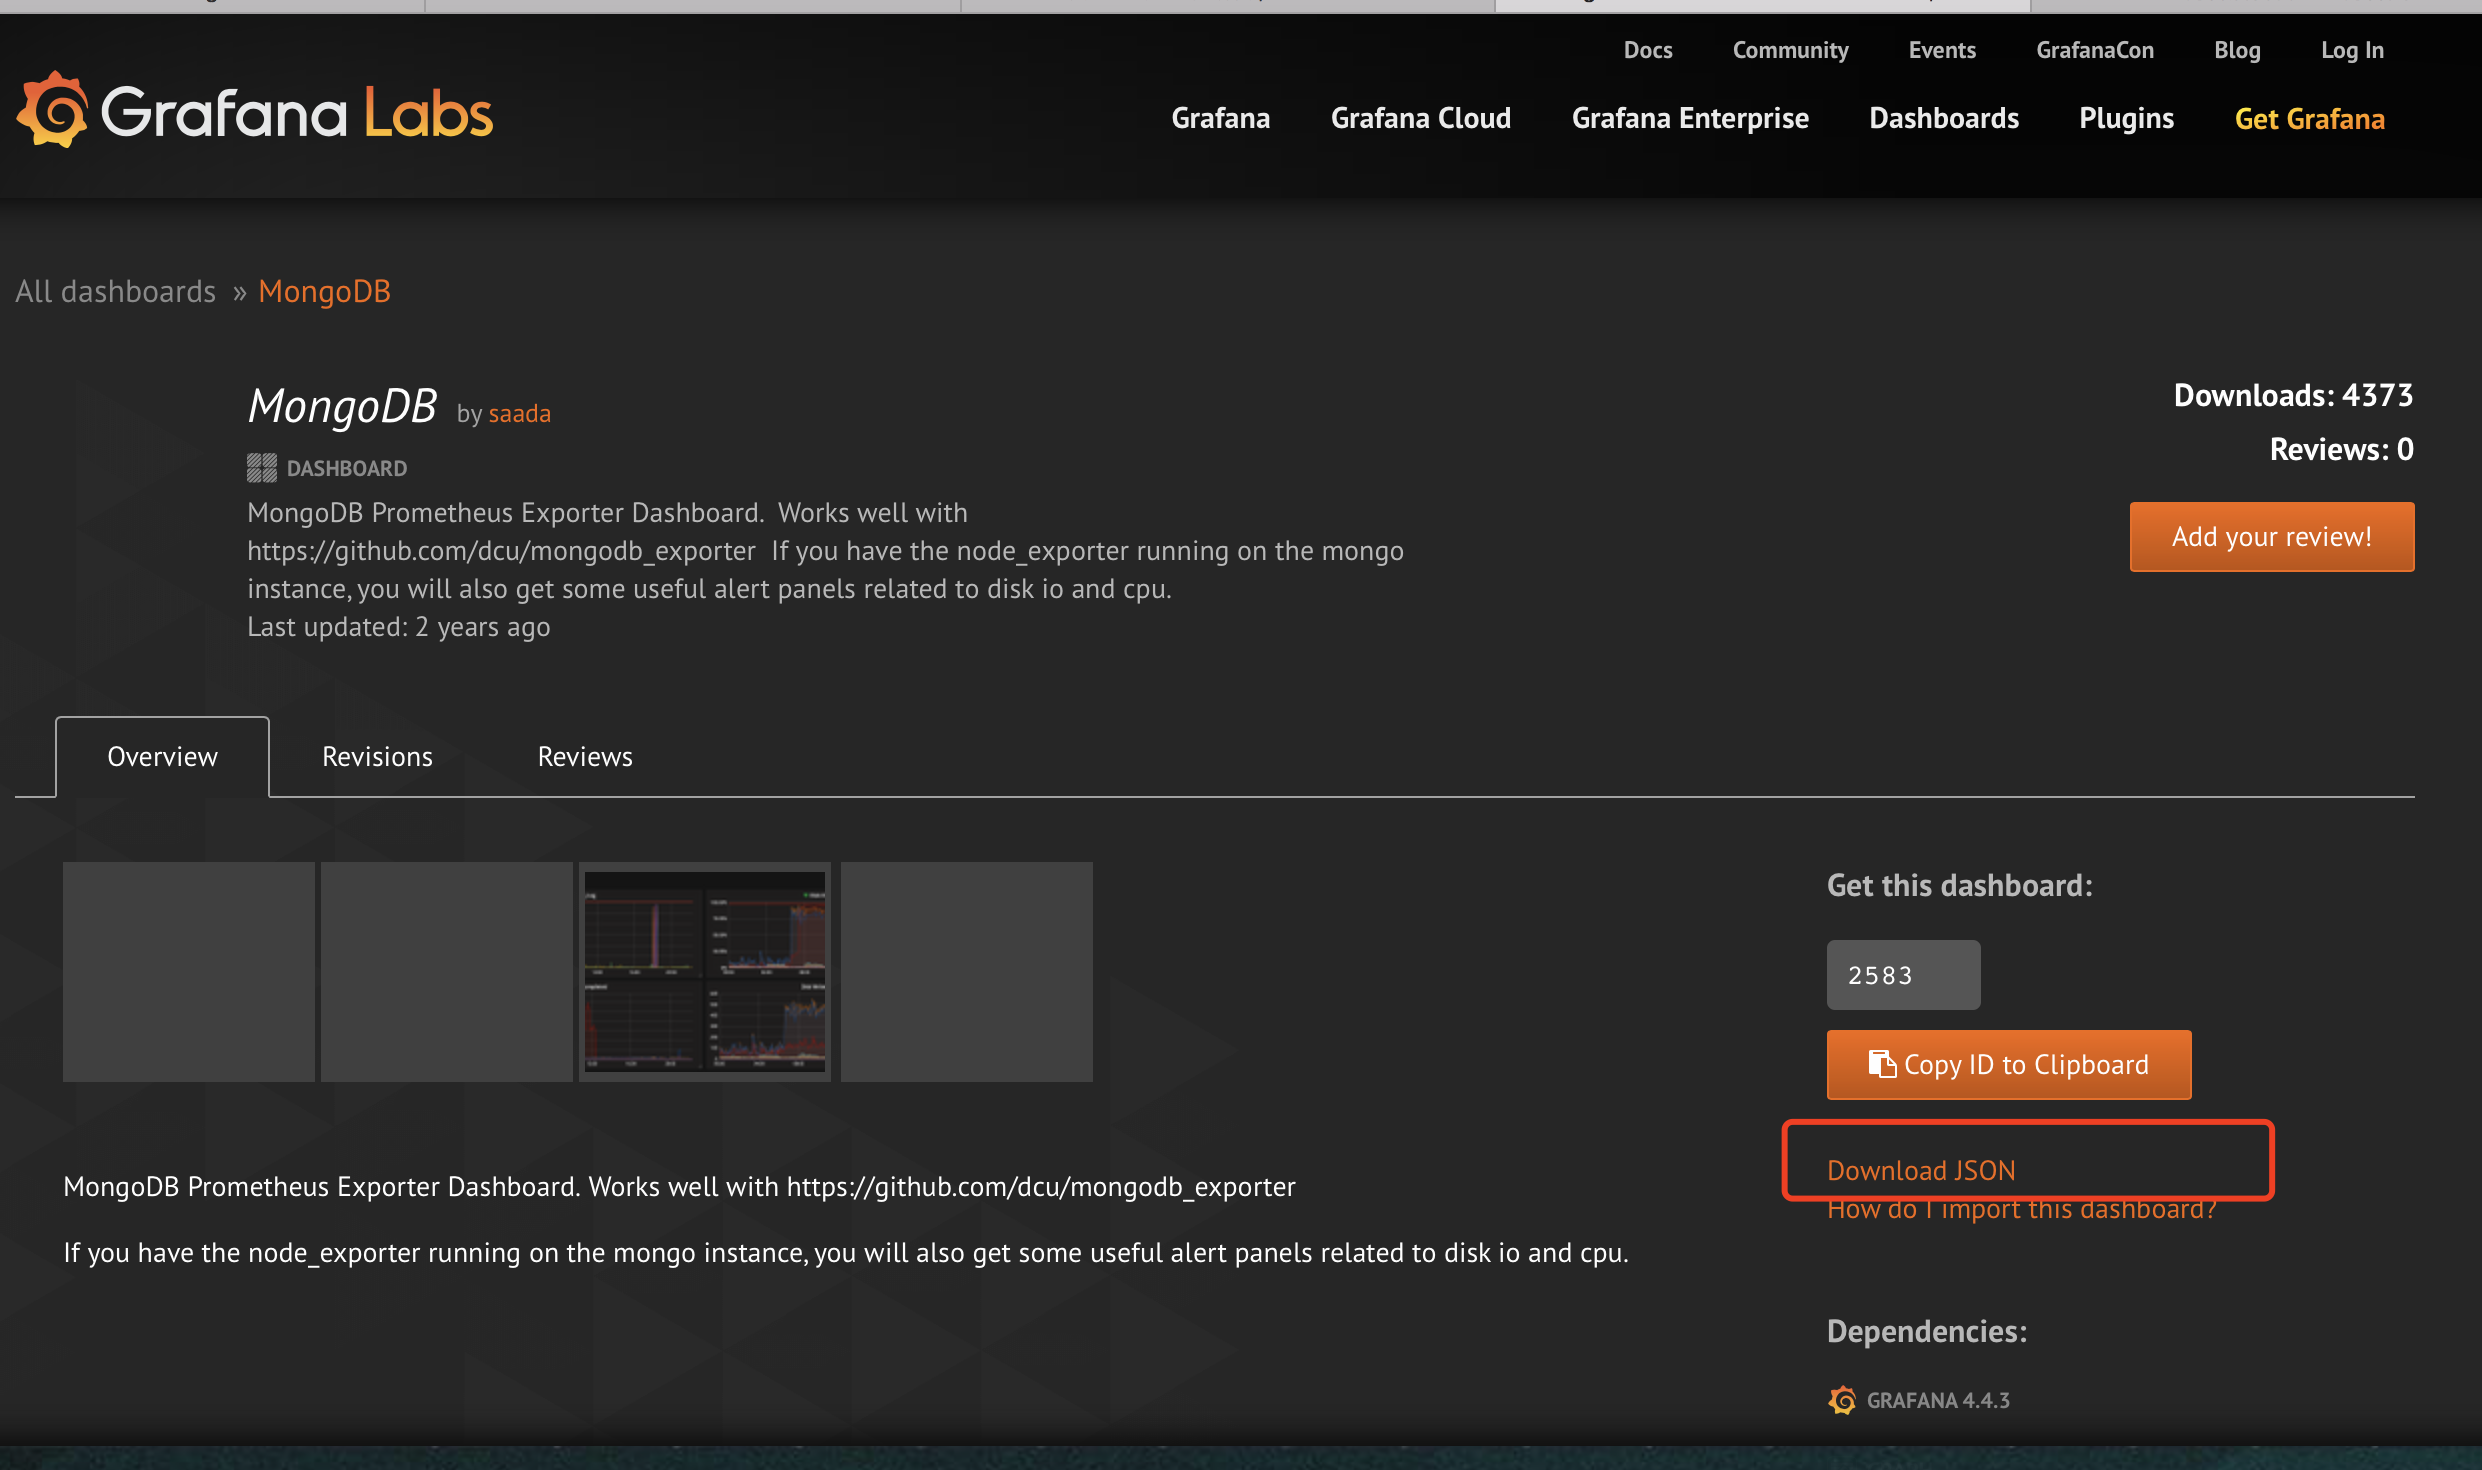
improt此表盤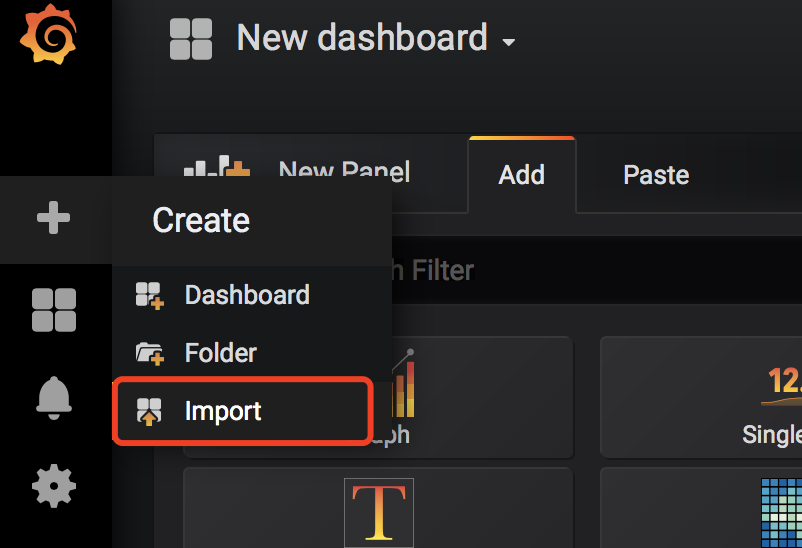

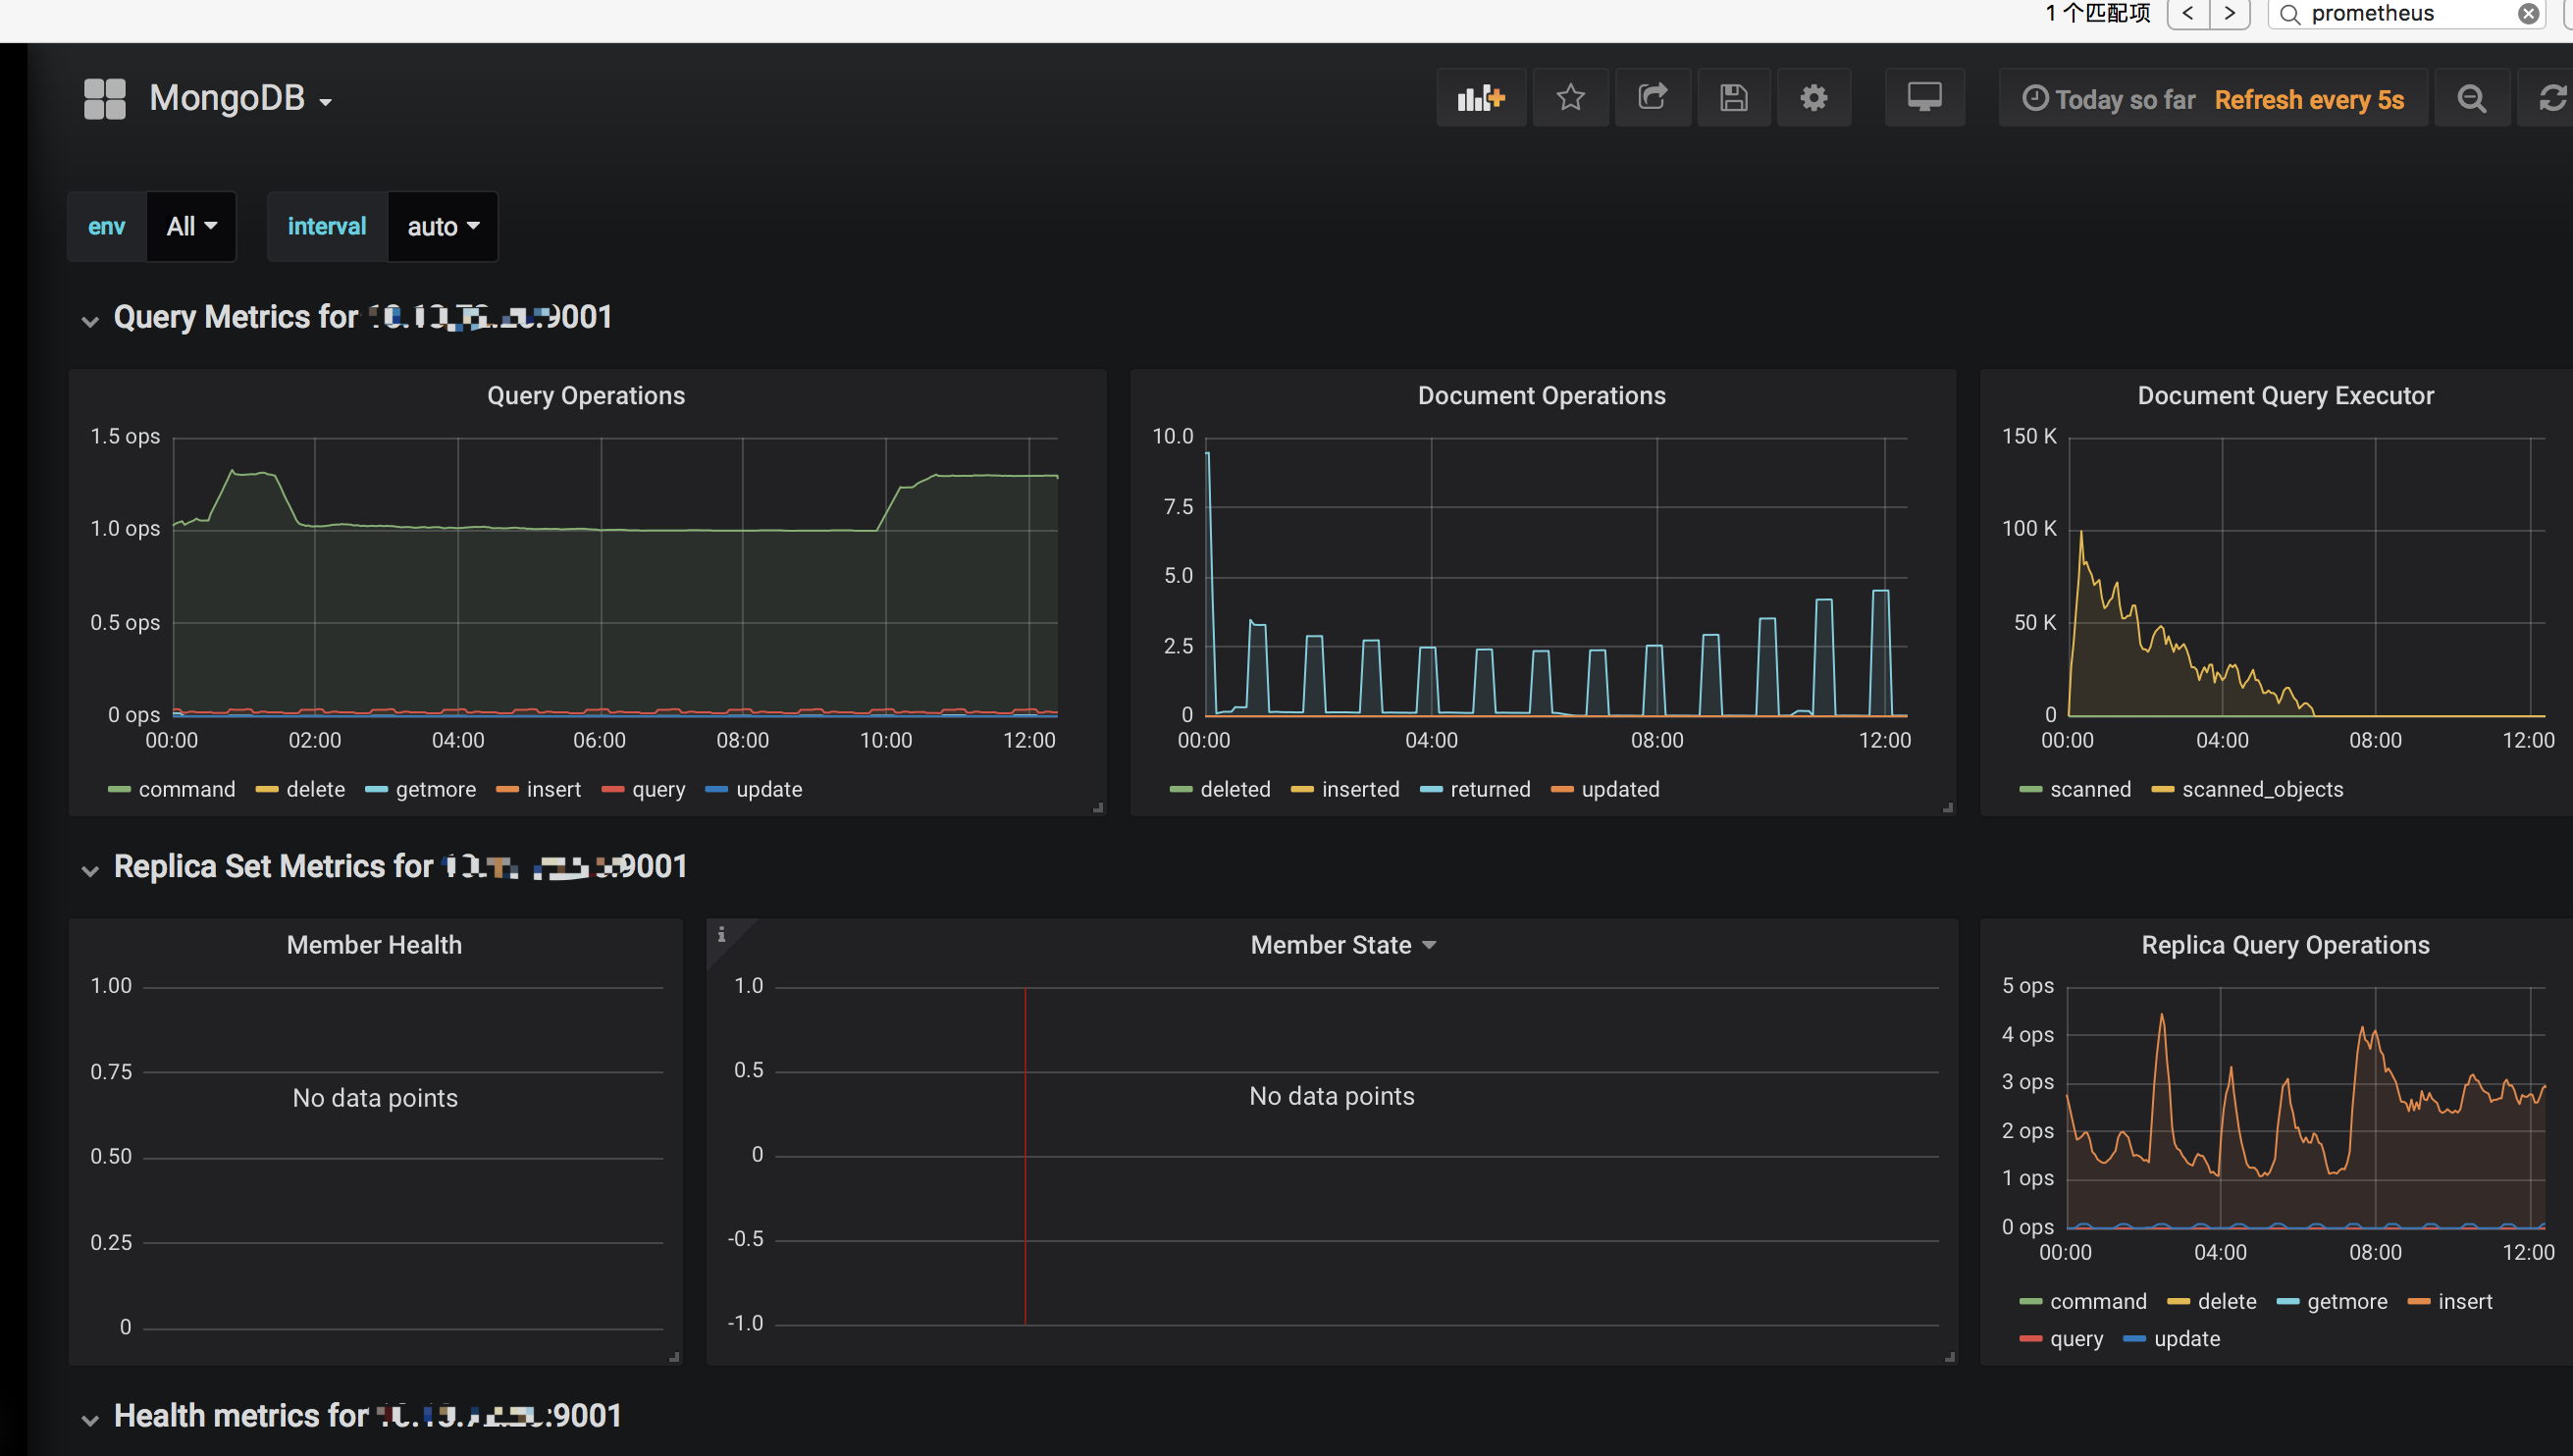
效果圖
報警
Prometheus的報警分為兩部分,通過在Prometheus服務端設置告警規則,Prometheus服務端產生報警向Alertmanager發送報警。Alertmanager管理這些報警,通過電子郵件,PagerDuty和HipChat等方法發送通知。
設置報警及通知的步驟:
* 配置Alertmanager
* 配置Prometheus對Alertmanager訪問
* 配置ruler報警規則
我們的需求是能將報警信息發送到企業微信中。
* 注冊企業微信賬號(不需要企業認證)
* 創建第三方應用如Prometheus,填寫應用信息(此應用的配置信息用于altermanager.yml配置及接收報警信息)
下載Alertmanager
wget?https://github.com/prometheus/alertmanager/releases/download/v0.18.0-rc.0/alertmanager-0.18.0-rc.0.linux-amd64.tar.gz
tar -xzvf alertmanager-0.18.0-rc.0.linux-amd64.tar.gz
創建或修改alertmanager.yml
global:resolve_timeout: 2mwechat_api_url: 'https://qyapi.weixin.qq.com/cgi-bin/'
route:group_by: ['alertname_wechat']group_wait: 10sgroup_interval: 10sreceiver: 'wechat'repeat_interval: 1h
receivers:
- name: 'wechat'wechat_configs:- send_resolved: trueto_party: '1'agent_id: '1000002'corp_id: 'w***'api_secret: 'W***'
參數說明:
- corp_id: 企業微信賬號唯一 ID, 可以在我的企業中查看。
- to_party: 需要發送的組。
- agent_id: 第三方企業應用的 ID(上面步驟創建的應用),可以在自己創建的第三方企業應用詳情頁面查看。
- api_secret: 第三方企業應用的密鑰,可以在自己創建的第三方企業應用詳情頁面查看
啟動altermanager
nohup ./altermanager &
修改prometheus配置文件
增加如下配置
alerting:alertmanagers:- static_configs:- targets:- localhost:9093
rule_files:- "rules.yml"
創建rules.yml文件
groups:
- name: noderules:- alert: server_statusexpr: up{job="node"} == 0for: 15sannotations:summary: "機器掛了"
停止node_explorer,企業微信就會收到消息
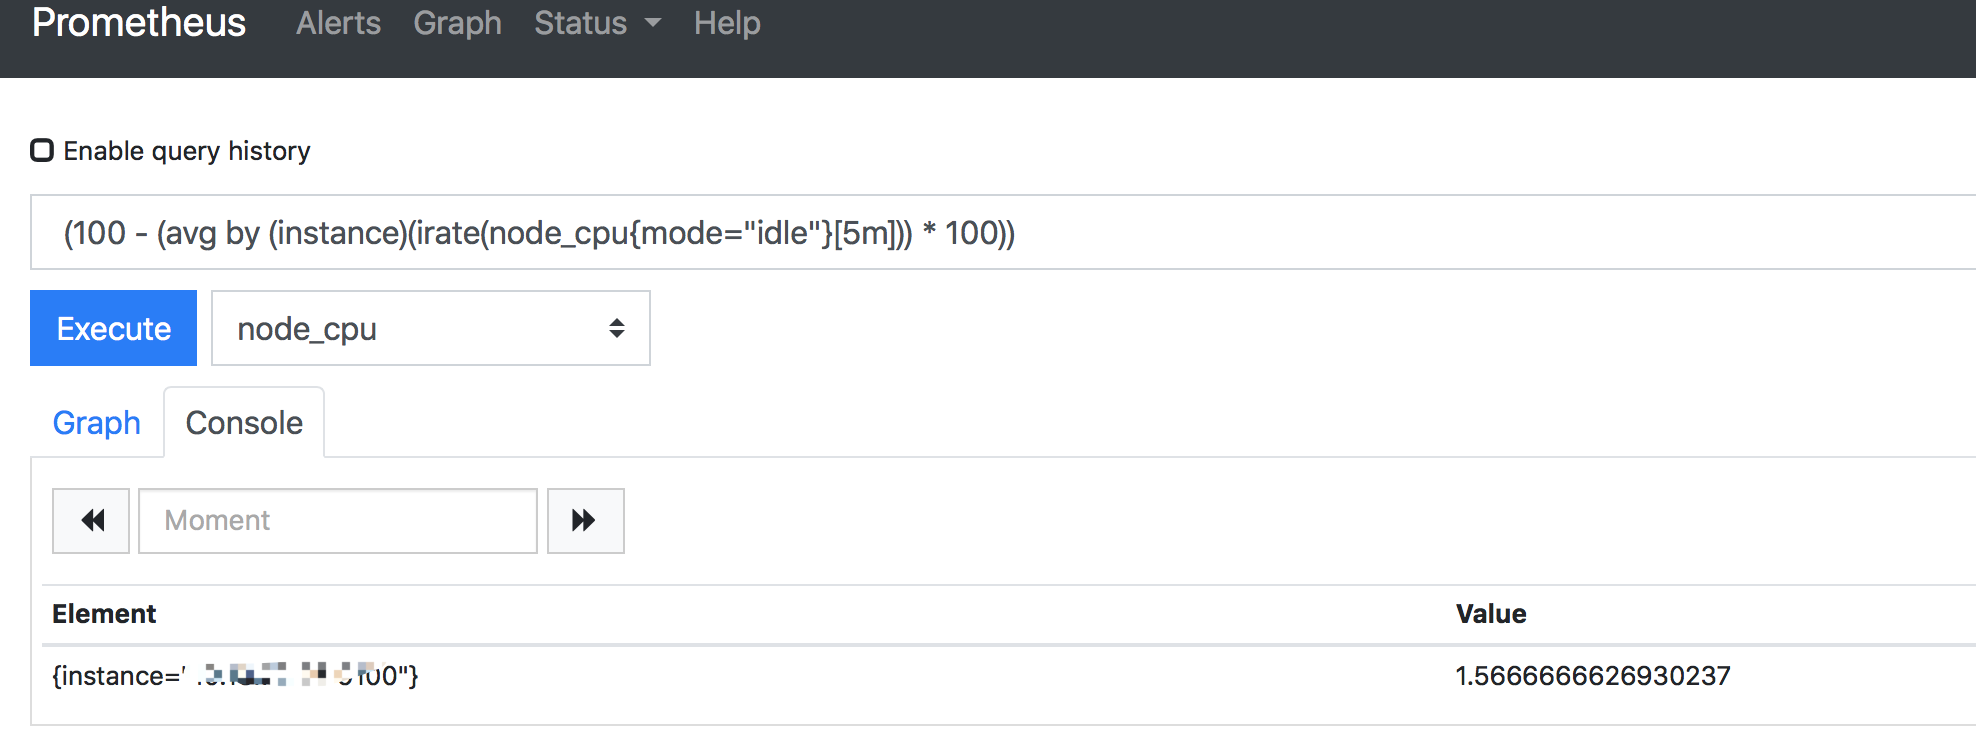
備注:起初困擾我的是如何設置rules,后來發現Prometheus的前端頁面可以直接執行query,將規則設置好后,可以在頁面中執行,如圖:
規則配置
磁盤占用規則:node_filesystem_avail{device="/dev/sde1",fstype="ext3",instance="hostip:9100",job="node",mountpoint="/data4"} < 1073741824  (1G)
磁盤使用率:(1-  (node_filesystem_free{fstype=~"ext3|ext4|xfs",mountpoint="/data4"} / node_filesystem_size{fstype=~"ext3|ext4|xfs",mountpoint="/data4"}) ) * 100數據同步:進程存在
mongodb_connections{instance="hostip:9001",job="mongo1",state="available"}==0內存使用率:
((node_memory_MemTotal - (node_memory_MemFree+node_memory_Buffers+node_memory_Cached))/node_memory_MemTotal) * 100cpu使用率(100 - (avg by (instance)(irate(node_cpu{mode="idle"}[5m])) * 100))
使用promtool驗證規則是否準確
./promtool check rules alert_rule_test.yml
報警信息
如圖


 和 updateByPrimaryKey() 的區別)


指數衰減法)
和 waitpid( ))


)


